The unequivocal identification and classification of living organisms to the species level frequently relies on genetic evidence. Specific DNA sequences act as unrepeatable signatures and therefore constitute a unique DNA barcode for each species. Hebert et al. (2003) proposed that a single gene sequence would be sufficient to differentiate all, or at least the vast majority of animal species, and proposed the use of the mitochondrial DNA gene cytochrome oxidase subunit I (COI) as a global bioidentification system for animals. Initiatives, such as The Barcode of Life Database (http://www.barcodinglife.org) including The Fish Barcode of Life (http://www.fishbol.org), use a DNA-based identification system based on a relatively small fragment of COI.
However, the approach is not without controversy (Lipscomb et al., 2003; Moritz and Cicero, 2004). For a barcoding approach to species identification to succeed, within-species DNA sequences need to be more similar to one another than to sequences in different species. Recent studies show that this is generally the case, but there are exceptions. Hybridization among species would create taxonomic uncertainty: mitochondrial DNA is maternally inherited and any hybrid or subsequent generation would have the maternal species DNA only. Thus, the idea of a multi-locus DNA barcoding approach is progressively emerging, and limitations of mtDNA underline the requirement of nuclear regions (Frezal and Leblois, 2008). It is clear that longer length DNA barcodes will provide more efficient identification labels. Barcode efficiency can be further improved by the simultaneous use of genes showing different evolutionary rates and genomic positions.
RHOopsin, a nuclear gene encoding a transmembrane Gprotein- coupled receptor for visual transduction cascade, proved to be very suitable for barcoding purposes because it has a single copy in the genome, does not contain introns in Teleostei fishes, its evolutionary rate in fish is less than 2-fold lower than, for example, cyt
Here we examine the diversity of two genes with different phylogenetic signal: relatively variable mitochondrial COI and conservative nuclear RHOopsin (RHO) within and among 9 Mugilid species belonging to 4 genera, many of which have been examined from multiple specimens, with the goal of determining whether DNA barcoding can achieve unambiguous species recognition of Mugilid species.
Grey mullets of the family Mugilidae (Pisces, Mugiliformes) are distributed worldwide and inhabit marine, estuarine, and freshwater environments in all tropical and temperate regions. Various Mugilid species are commercially important species in fishery and aquaculture of many countries. Mugilid taxonomy still has not been finalized. The family includes from 14 to 20 genera recognized as valid according to the most recent revisions and 55 currently recognized species (Thomson, 1997; Nelson, 2006). Most of them are representatives of
>
Sampling, DNA extraction, polymerase chain reaction (PCR) amplification and sequencing
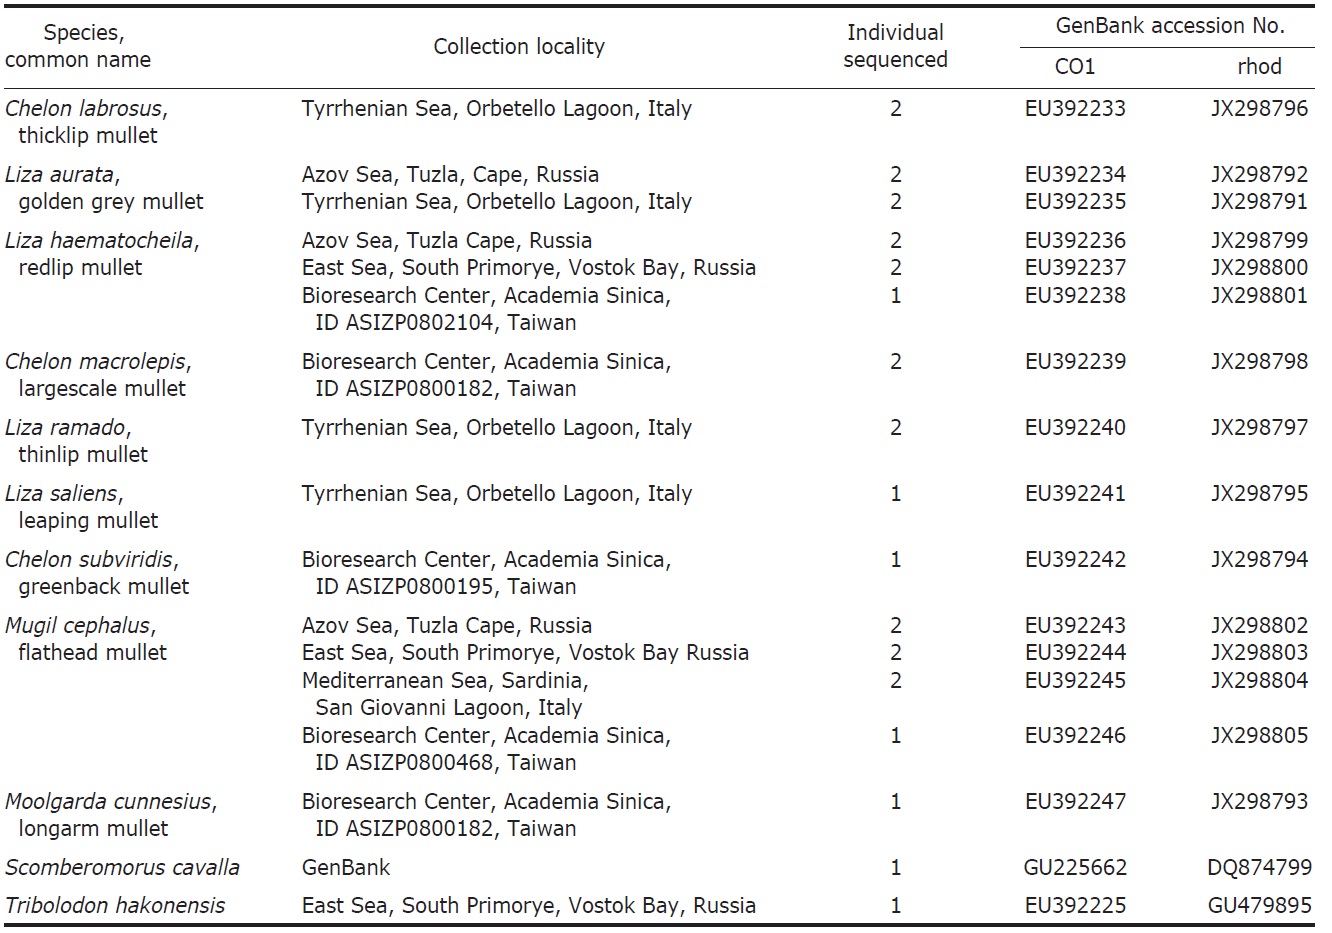
One to seven specimens were collected for each of the nine species of Mugilidae (Table 1). DNA extracts were prepared from either muscle or heart tissue or fin clips preserved in 95% ethanol alcohol according to the protocol of Sambrook et al. (1989). Amplification of the COI gene fragments was carried out using the primers: FishF1 (5′-TCAACCAACCACAAAGACATTGGCAC-3′) and FishR1 (5′-TAGACTTCTGGGTGGCCAAAGAATCA-3′) (Ward et al., 1994). Primers RHOO545 (5′-GCAAGCCCATCAGCAACTTCCG-3′) and RHOO1039 (5′-TGCTTGTTCATGCAGATGTAGA-3′) (Chen et al., 2003) were used to amplify the RHO gene fragments.
PCRs were conducted for both genes with a total volume of 25 μL consisting of approximately 50 ng of template DNA, 0.25 μM of each primer, 2.5 μL of 10× PCR reaction buffer, 2 mM of each dNTP, and 1U of Taq DNA polymerase (Sibenzyme, Russia). PCR consisted of an initial denaturation step at 94℃ for 5 min., followed by 30 cycles of denaturation at 94℃ for 30 s, annealing for 30 s at 60℃ for COI gene fragment and 55℃ for RHO gene fragments and extension at 72℃ for 1 min. The terminal extension was at 72℃ for 10 min. Aliquots (3 μL) of amplicons were examined in 1.5% gels, stained with ethidium bromide, and photographed upon transillumination. DNA fragments were cut from the agarose gels, frozen-thawed, and re-PCRed under the same conditions. The rePCRed products were precipitated with ethyl alcohol and vacuum dried. Then they were sequenced under conditions recommended by the manufacturer, using the BigDye Terminator v.3.1 Cycle Sequencing Kit (Applied Biosystems, Foster City, CA, USA). Electrophoreses of sequencing products were made in ABI Prism 3130 DNA sequencer in 50 cm capillary array with polymer POP-7.
The sequences of COI and RHO gene fragments were analyzed both separately and together. DNA sequences were aligned using Clustal W 1.8 in MEGA 5.05. Evolution models and parameters were separately selected for COI and RHO and were then used in the following analyses.
COI sequence divergences were calculated using the Hasegawa, Kishino, and Yano (HKY85+ G) model (Hasegawa et al., 1985) as the appropriate model of sequence evolution chosen on the basis of hierarchical likelihood ratio tests (LRTs) as implemented in ModelTest 3.8 (Posada and Crandall, 1998). RHO sequence divergences were estimated using MEGA 5.05 by Kimura 2-parameter model. Saturation levels of each gene fragment and the combined data set were assessed by plotting transitions and transvertions accumulation for each pair of haplotypes against Hasegawa, Kishino, and Yano distances for COI and Kimura 2 distances for RHO in DAMBE 4.5.2 and MEGA 5.05.
Data were analyzed using three approaches, neighbour joining (NJ), maximum parsimony (MP), and Bayesian inference (BI). NJ, MP and BI trees were created to provide a graphic representation of the patterning of divergence between species computed in MEGA ver. 5.05 and MrBayes 3.2.1. MP analyses were performed using heuristic searches with 50 random stepwise additions and tree bisection-reconnection branch swapping. Bootstrap analyses were used to assess the relative robustness of branches with 1,000 replicates. BI analyses were conducted in MrBayes 3.2.1 with the selected best fit models and parameters. Each BI analysis was run over 4,000,000 generations using four Markov Chain Monte Carlo chains and every 200th tree saved. Four thousand trees were discarded as burn-in. The robustness of trees was tested using posterior probability.
All sequences are available in Genbank under the accession

List of Mugilidae species studied with collection locality, number of individuals sequenced, GenBank accession number
numbers shown in the Table 1.
A total of 9 Mugilid species were analyzed, generating (because of multiple specimens for most species) a total of 60 sequences. Approximately 652 bp were amplified and sequenced from the 5′ region of the COI gene from mitochondrial DNA. No insertions, deletions or stop codons were observed in any sequence. One hundred ninty-eight variable sites were revealed, most of them (88.9%) were attributable to the the 3rd codon base, 10.1% to the 2nd, and 1% to the 1st codon base. Fourteen nucleotide substitutions resulted in amino acid replacement.
The GC content of the
The HKY85 distance of individuals within
RHOopsin sequences were 515 bp length. All RHOopsin sequences were species-specific. We observed no intraspecific variability, except one nucleotide substitution in 3rd codon position in
Forty-four variable sites were revealed, 28 of them were found to be parsimony-informative, most of them (67%) were attributable to the 3rd codon base, 5% to the 2nd, and 28% to the 1st codon base. Eight nucleotide substitutions resulted in amino acid replacement. GC content was about the same in all the species studied-53-55%. The level of divergence due to conservativeness of RHO gene was much lower compared to COI ranging from only 0.4% between
>
The phylogenetic relationships of Mugilidae
Although DNA barcoding aims to develop species identification systems, some phylogenetic signal was apparent in the data. No saturation was detected for each dataset of COI and RHO sequences. The plots of transversion and transitions against genetic distances were almost linear. Therefore, all substitutions in COI and RHO gene fragments were used for phylogenetic reconstructions.
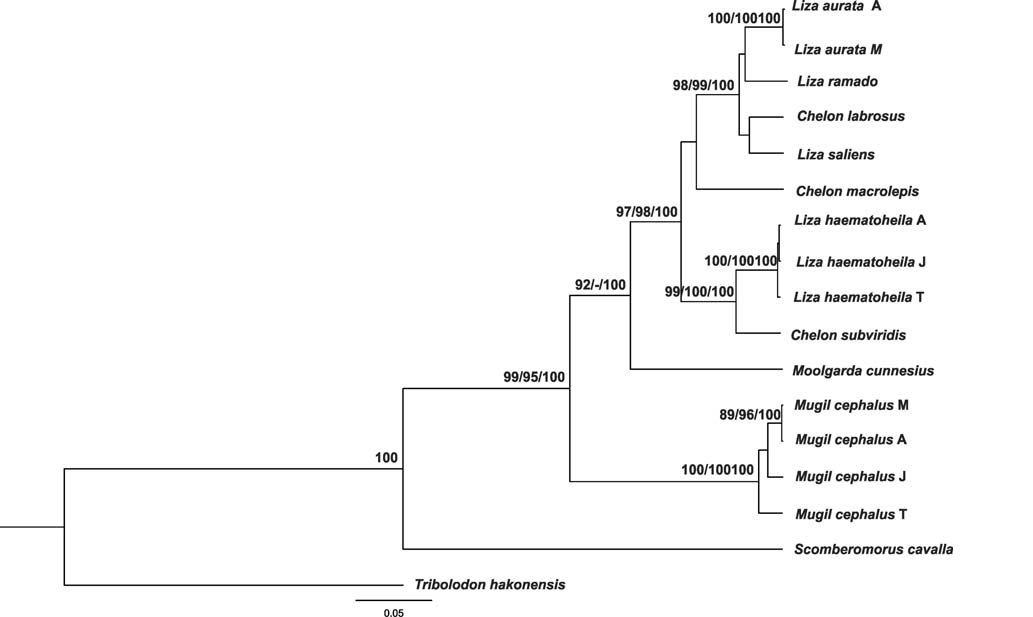
In all cases, no significant differences among the NJ, MP, and BI tree topologies based on COI and RHO gene sequences were found. The consensus tree obtained from Bayesian analysis of COI dataset was completely identical in topology to the one produced using NJ and MP analysis. The topologies of NJ, MP, and BI trees based on RHO gene analyses were very similar to each other. Thus only the Bayesian tree based on combined COI and RHO gene fragments was presented together with major nodal support values for NJ and MP (Fig. 1).
Haplotypes of the same species were always clustered together in both phylogenetic reconstructions based on COI, RHO and combined COI and RHO gene fragments dataset. All haplotypes of
Although the phylogenetic trees based on COI and RHO sequences were significantly similar to each other, there were differences between them. Haplotypes of
Molecular markers are used for explanation and refining the taxonomic and phylogenetic relationships in the groups of the species. Furthermore, molecular markers are used for the accurate and unambiguous identification of fish and fish product from eggs to adult, and it is important in many areas.
Although phylogenetic analyses of Mugilidae species were carried out based on 16S and 12S rRNA mtDNA sequences (Liu et al., 2010), Phe 12SrRNA, cyt b and COI (Heras et al., 2009), three mtDNA loci 16SrRNA, COI and cyt b (Durand et al., 2012), the author supposed that employing slowerevolved and independent nuclear genes might prove helpful to provide molecular systematic of Mugilidae.
For the barcoding we proposed to use not only variable mitochondrial cytochrome oxidase subunit I, but also the highly conserved nuclear RHOopsin gene, which has not previously been used for such purposes. The use of the nuclear genes for the barcoding is especially important in the case of hybridization among species. The mitochondrial COI gene is the most efficient gene marker. However, in some cases 5′-COI “barcoding” region is not enough and even be misleading for purposes of identification due interspecific COI recombination reflecting putative historical hybridization events between species (Balakirev et al., 2012).
All 9 species can be differentiated by both COI and RHO. The lack of stop codons is consistent with all amplified sequences being functional mitochondrial COI sequences, and that, together with the fact that all amplified sequences were about 628-652 bp in length, suggests that NUMTs (nuclear DNA sequences originating from mitochondrial DNA sequences) were not sequenced (vertebrate NUMTS are typically smaller than 600 bp (Zhang and Hewitt, 1996).
The data obtained showed that information based on COI sequences was diagnostic not only for species level identification but also for recognition of intraspecific units, e.g., allopatric populations of circumtropical
COI sequences of each specimen of each sample proved to be identical. We found no difference within each of
All RHOopsin sequences were species-specific. Even
The clades revealed after bootstrapping generally corresponded well with expectations. Topologies of NJ, MP and BI trees conformed to our previous data (Semina et al., 2007) based on PCR-restiction fragment length polymorphismanalysis of extended mtDNA segments.
The data obtained indicated that
Based on the data obtained, we conclude that COI, as well as RHO sequencing, can be used to unambiguously identify fish species. Topologies of phylogeny based on COI and RHO sequences coincided with each other, while together they had a good phylogenetic signal.