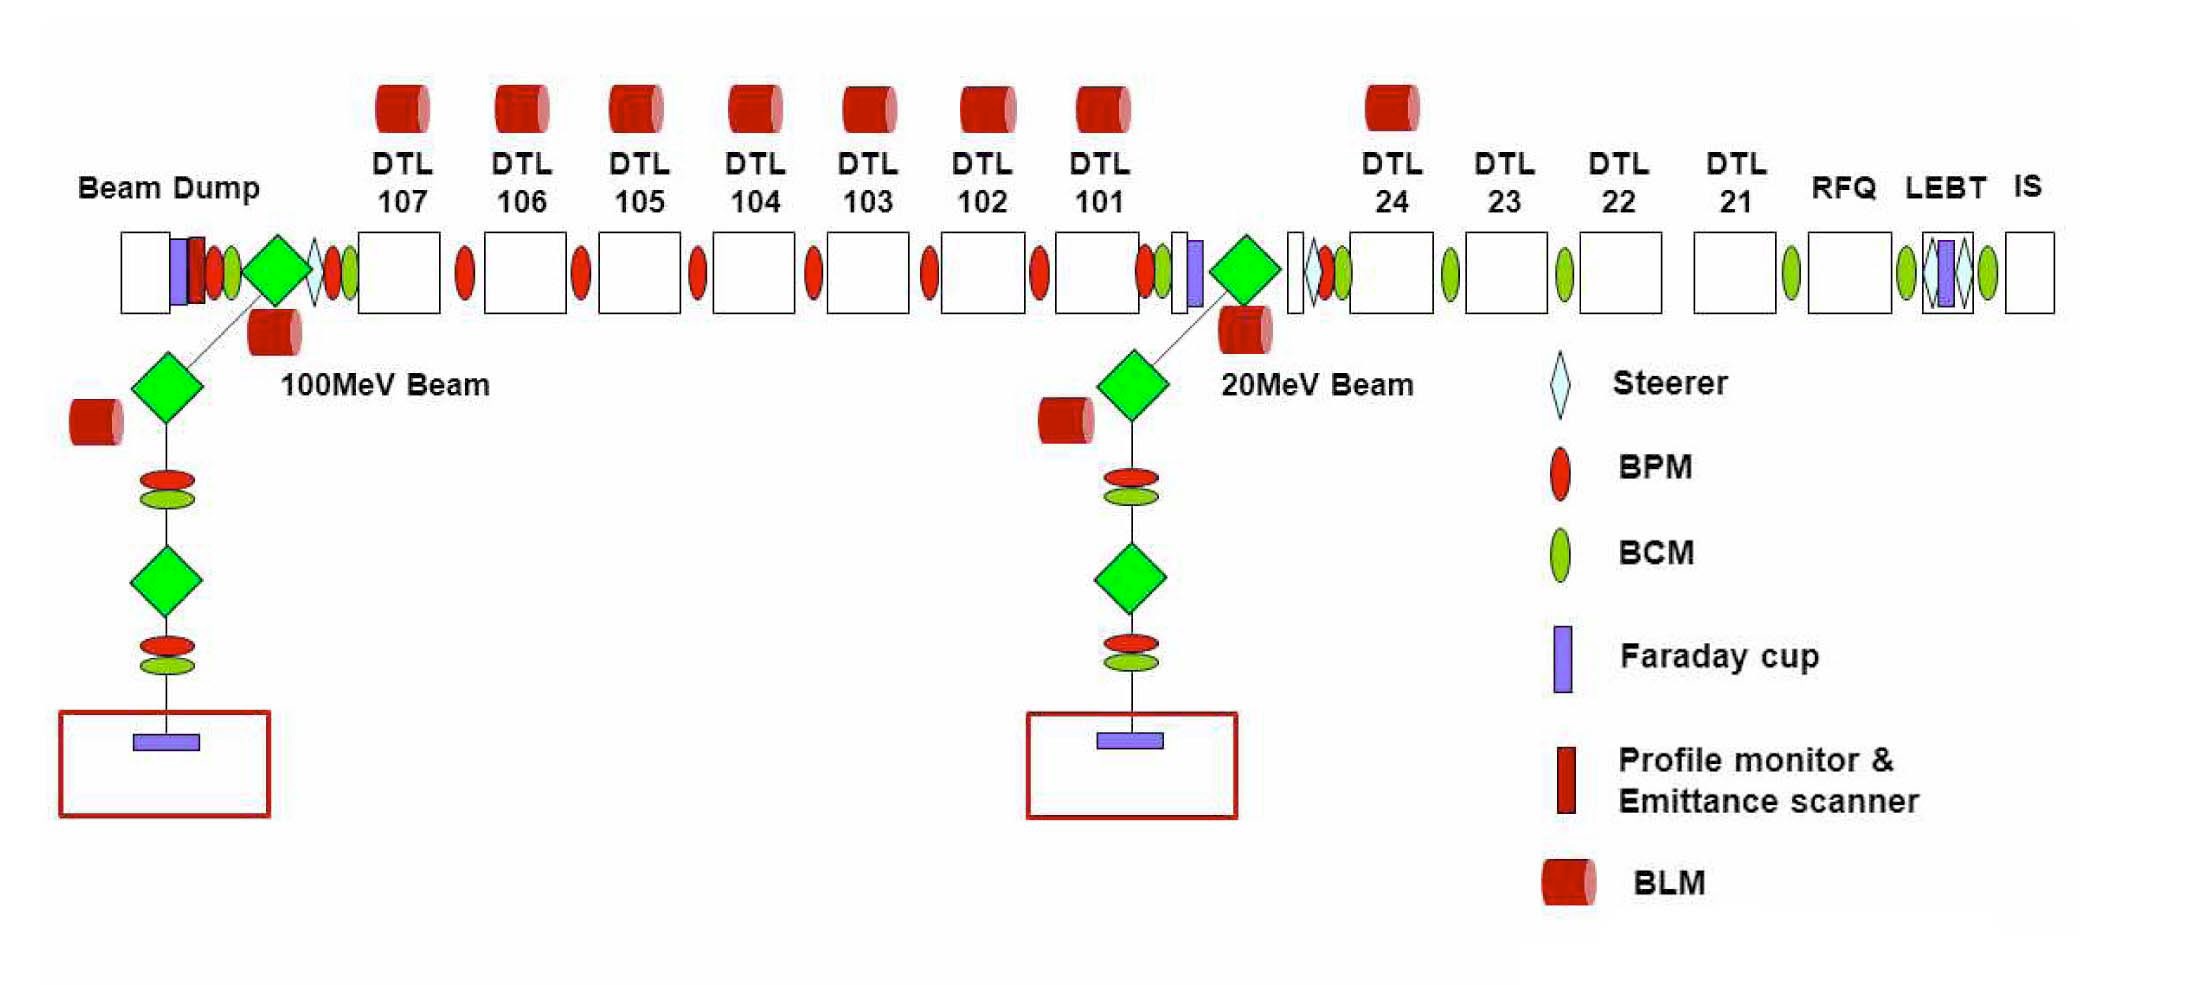
One of the goals of the Proton Engineering Frontier Project (PEFP) is to construct a 100-MeV proton accelerator [1-3]. The fabrication of the PEFP 100-MeV DTL tanks finished in 2010, the installation starts in 2011, and the commissioning is planned to start in June 2013. A phase scan method will be used to adjust the RF set points, such as the amplitude and the phase, during the commissioning stage [4]. A beam position monitor (BPM), which is used to measure the beam phase, is a crucial component for the phase scan method. The beam diagnostics layout of the 100- MeV proton accelerator is shown in Fig. 1. The BPMs will be used not only for measuring the beam phase but also for
measuring the beam position to adjust the steering magnets.
Button-type BPMs were installed for the 20-MeV accelerator, which has been operating since 2007. A striplinetype BPM is being considered for the remaining higher energy part, which accelerates the proton beam from 20- MeV to 100-MeV, because the 100-MeV accelerator has enough space to accommodate a stripline-type BPM.
The goal of this study is to design, fabricate, and test a prototype BPM for the PEFP 100-MeV accelerator. The design of the BPM is described in Section II, the fabrication is described in Section III, and the low-power test results are described in Section IV. Finally, Section V discusses the test results and future plans for the prototype BPM.
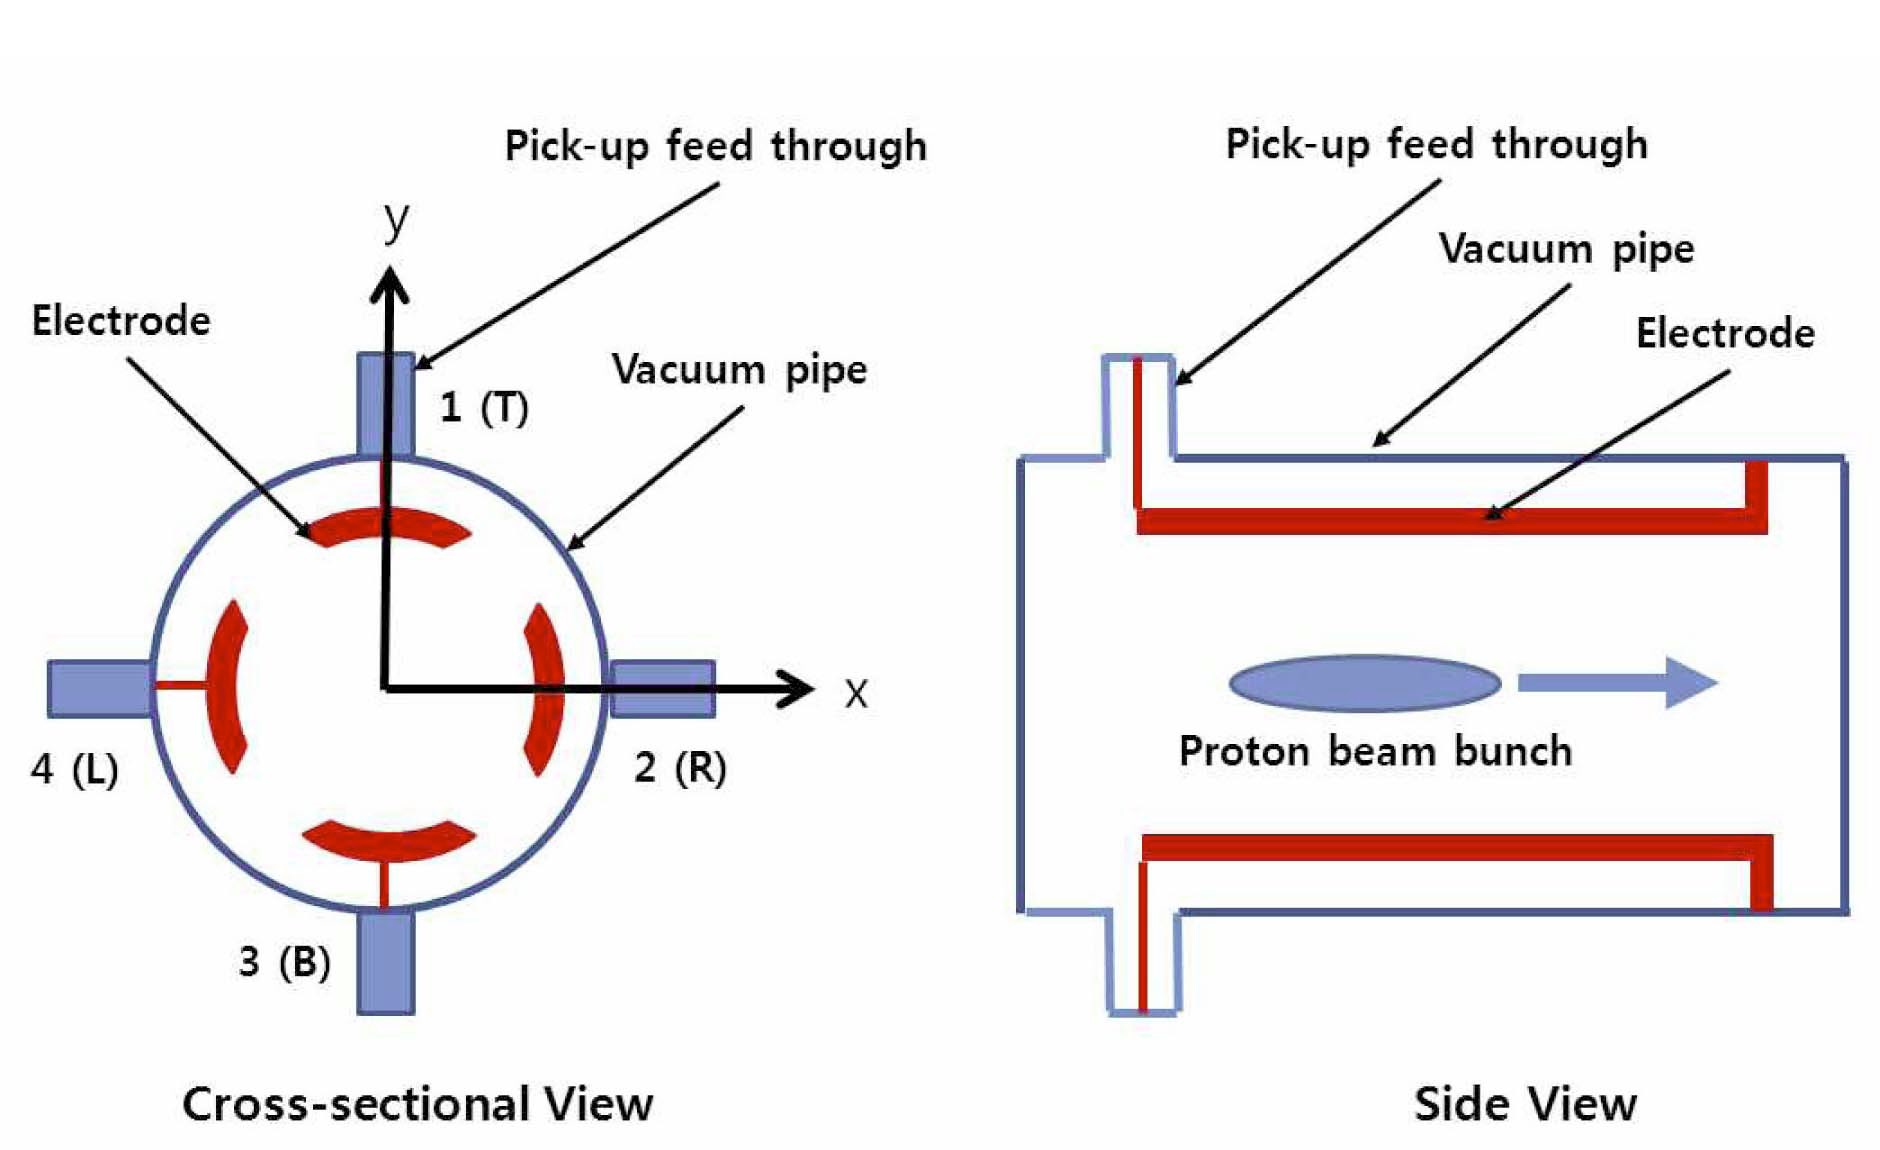
The design parameters of the PEFP linac BPM are summarized in Table 1. The beam parameters for the BPM design are such that the energy ranges from 20 MeV to 100 MeV with a peak beam current from 1 mA, which will be used at the early commissioning stage, to 20 mA, which is the accelerator’s design value. The minimum beam pulse width is 50 us which was selected in consideration of the Low Level RF (LLRF) control margin. Schematics of the stripline-type BPM are shown in Fig. 2. The stripline-type BPM consists of four electrodes to measure the RF power induced by the proton beam, four pick-up feedthroughs to deliver the RF power induced in the electrode to the electronics in order to calculate the beam position, and a vacuum pipe. At first, we should consider the BPM length because the available space is limited. The BPMs will be installed between Drift Tube Linac (DTL) tanks, and the shortest inter-tank gap is 124.6 mm between the DTL101 and the DTL102 endplates, which includes a BPM, a gate valve, and a bellow. The net available space for the BPM is 48.2 mm. With this constraint, the electrode aperture is 20 mm in diameter, which is the same as the drift tube’s
[Table 1.] Design Parameters of the PEFP linac BPM
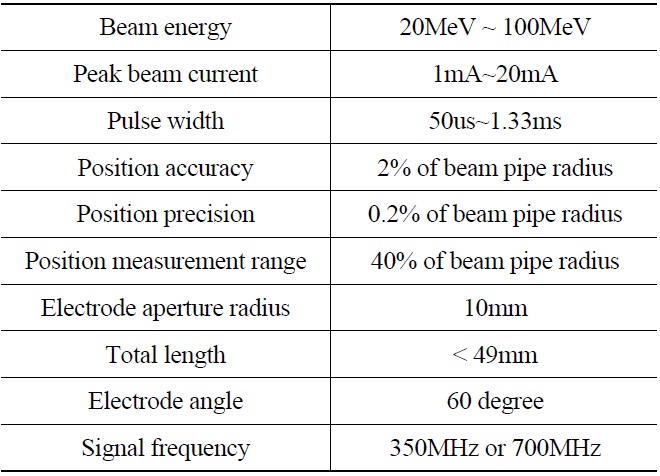
Design Parameters of the PEFP linac BPM
inner diameter. The electrode width is 60°, which is used in many BPM designs because the signal power is larger with less inter-electrode coupling. The electrode thickness is 2 mm, considering the mechanical stiffness. The gap size between the electrode and the outer vacuum pipe is 3.5 mm in order to give the 50Ω impedance calculated by using the POISSON/SUPERFISH code. One side of the electrode is connected to the SMA feedthrough for signal measurement, and the other side is terminated as a short. A simulation using the MWS code showed that the gap size between the electrode and the vacuum pipe transition had little influence on the electromagnetic properties, such as the matching and the coupling between electrodes, of the BPM.
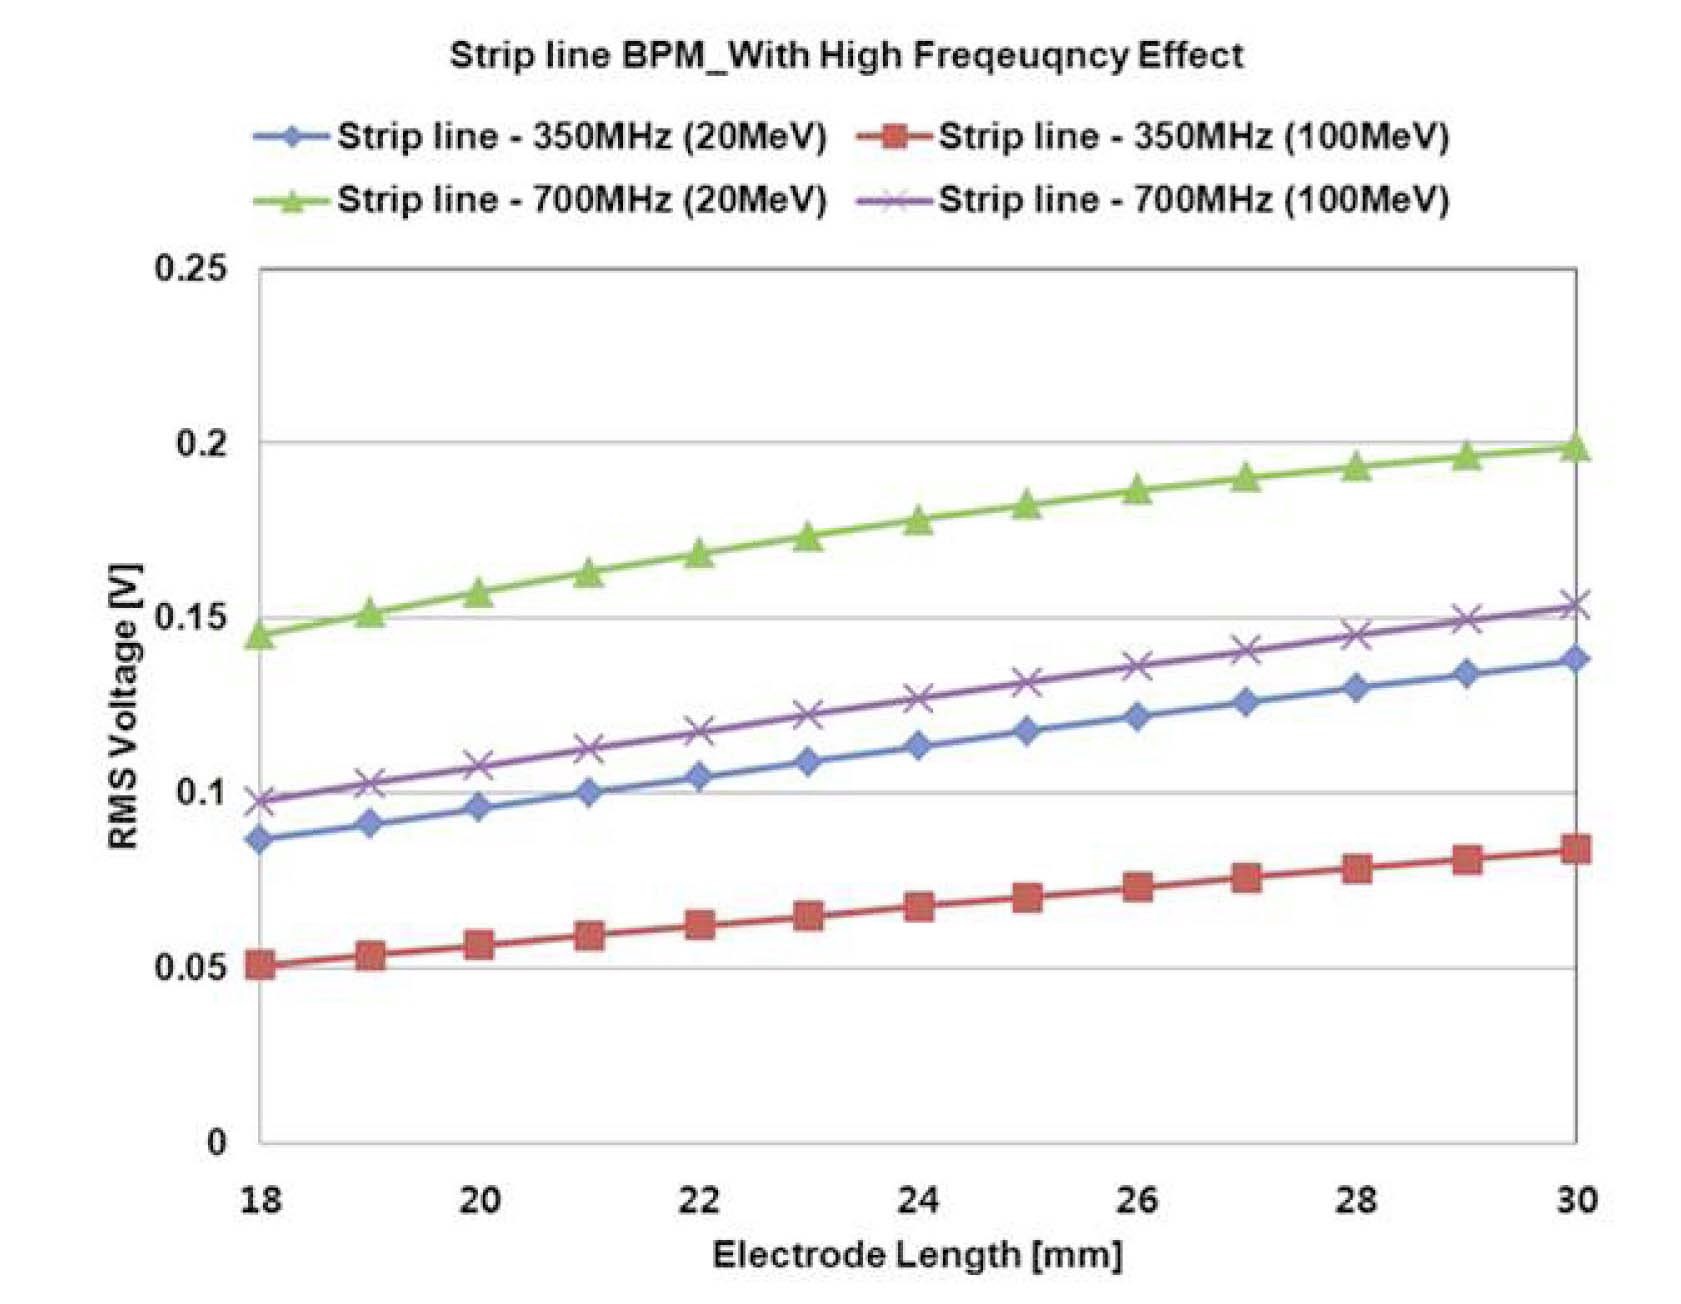
The signal amplitude was estimated by using an analytic formula that included high frequency effects such as the transit time factor and the Bessel factor [5]. Beam parameters, such as the beam bunch size, were obtained from the PARMILA code and are summarized in Table 2. The beam was assumed to have a Gaussian profile. The signal amplitudes, expressed as rms values, were calculated by varying the electrode length for the fundamental and the second harmonic frequencies. The 700-MHz signal amplitude was higher than the 350-MHz signal amplitude because the electrode length was much shorter than the quarter wavelength for a 350-MHz frequency. The signal power increased as the electrode length was increased, as shown in Fig. 3. From Fig. 3, an electrode length of 25 mm was selected, which will be able to produce enough signal amplitude and fit in the given space.
[Table 2.] Beam Parameters for BPM Design
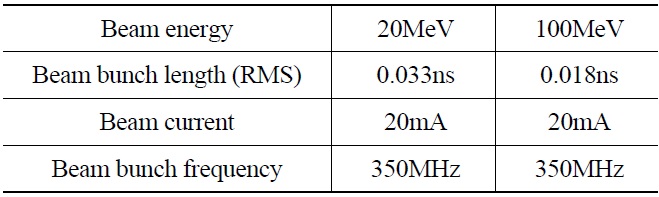
Beam Parameters for BPM Design
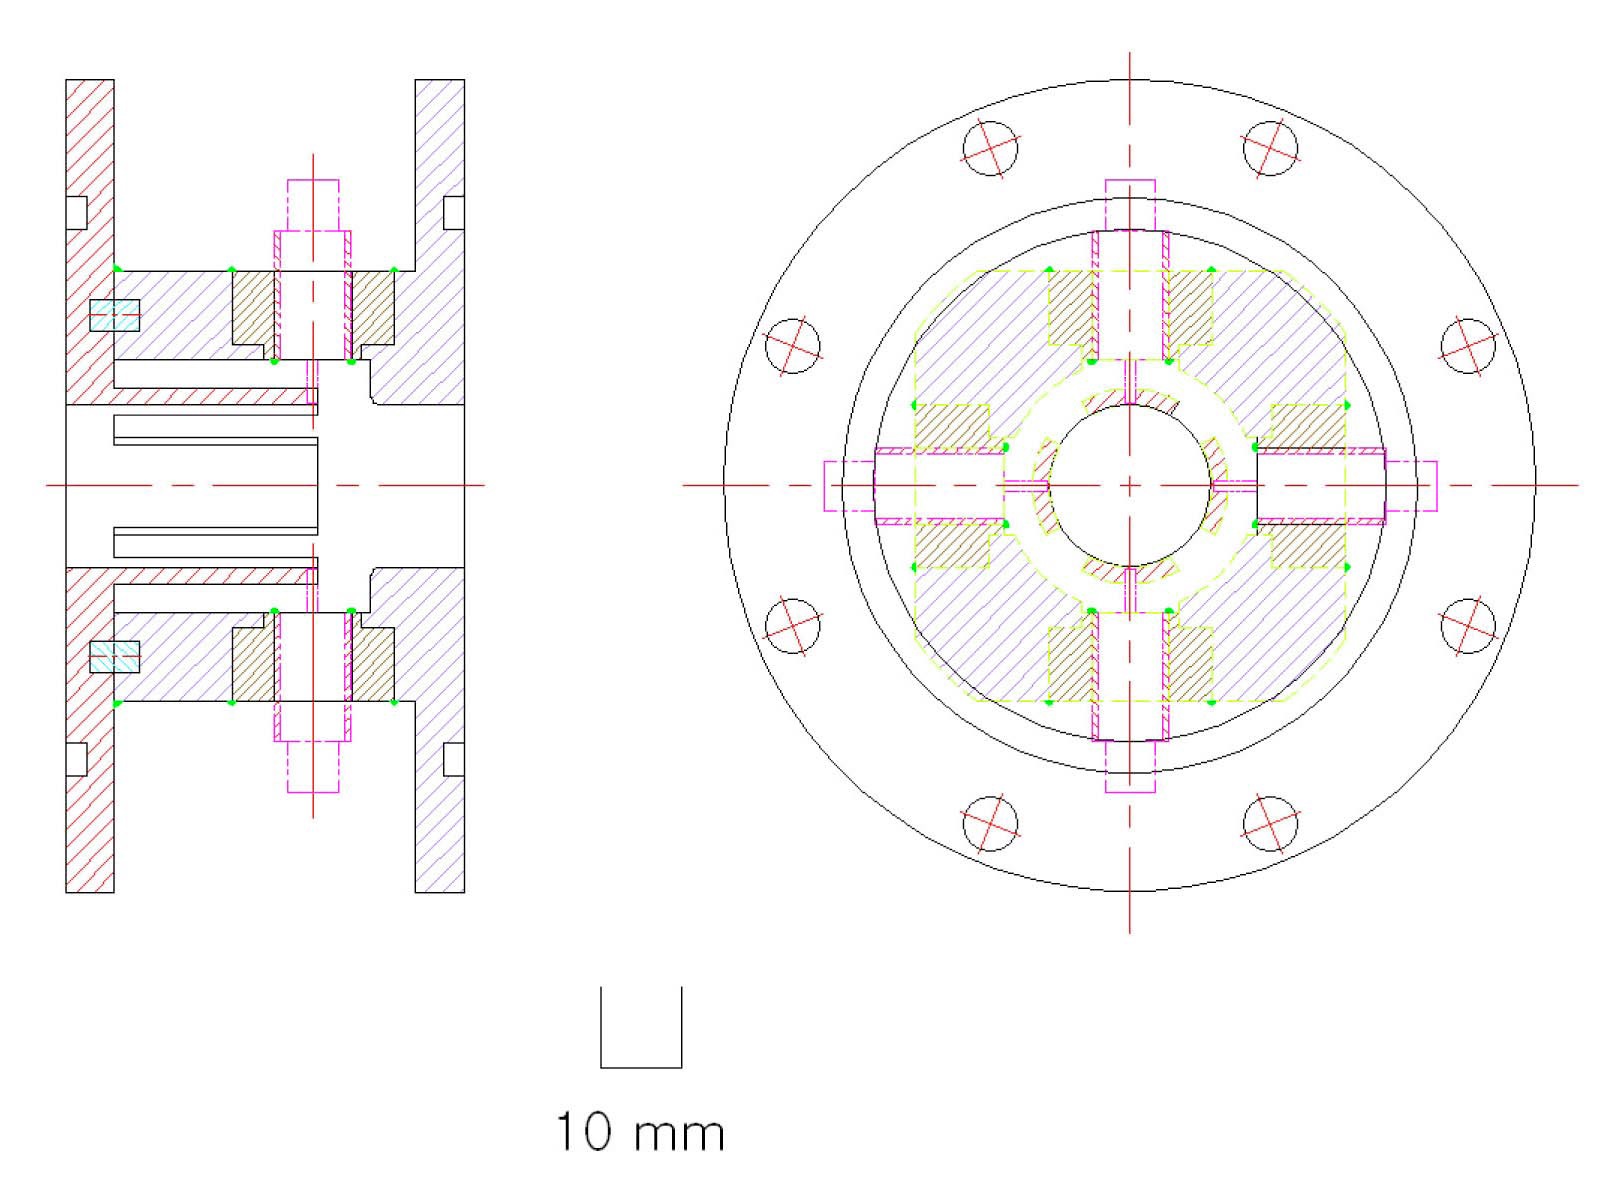
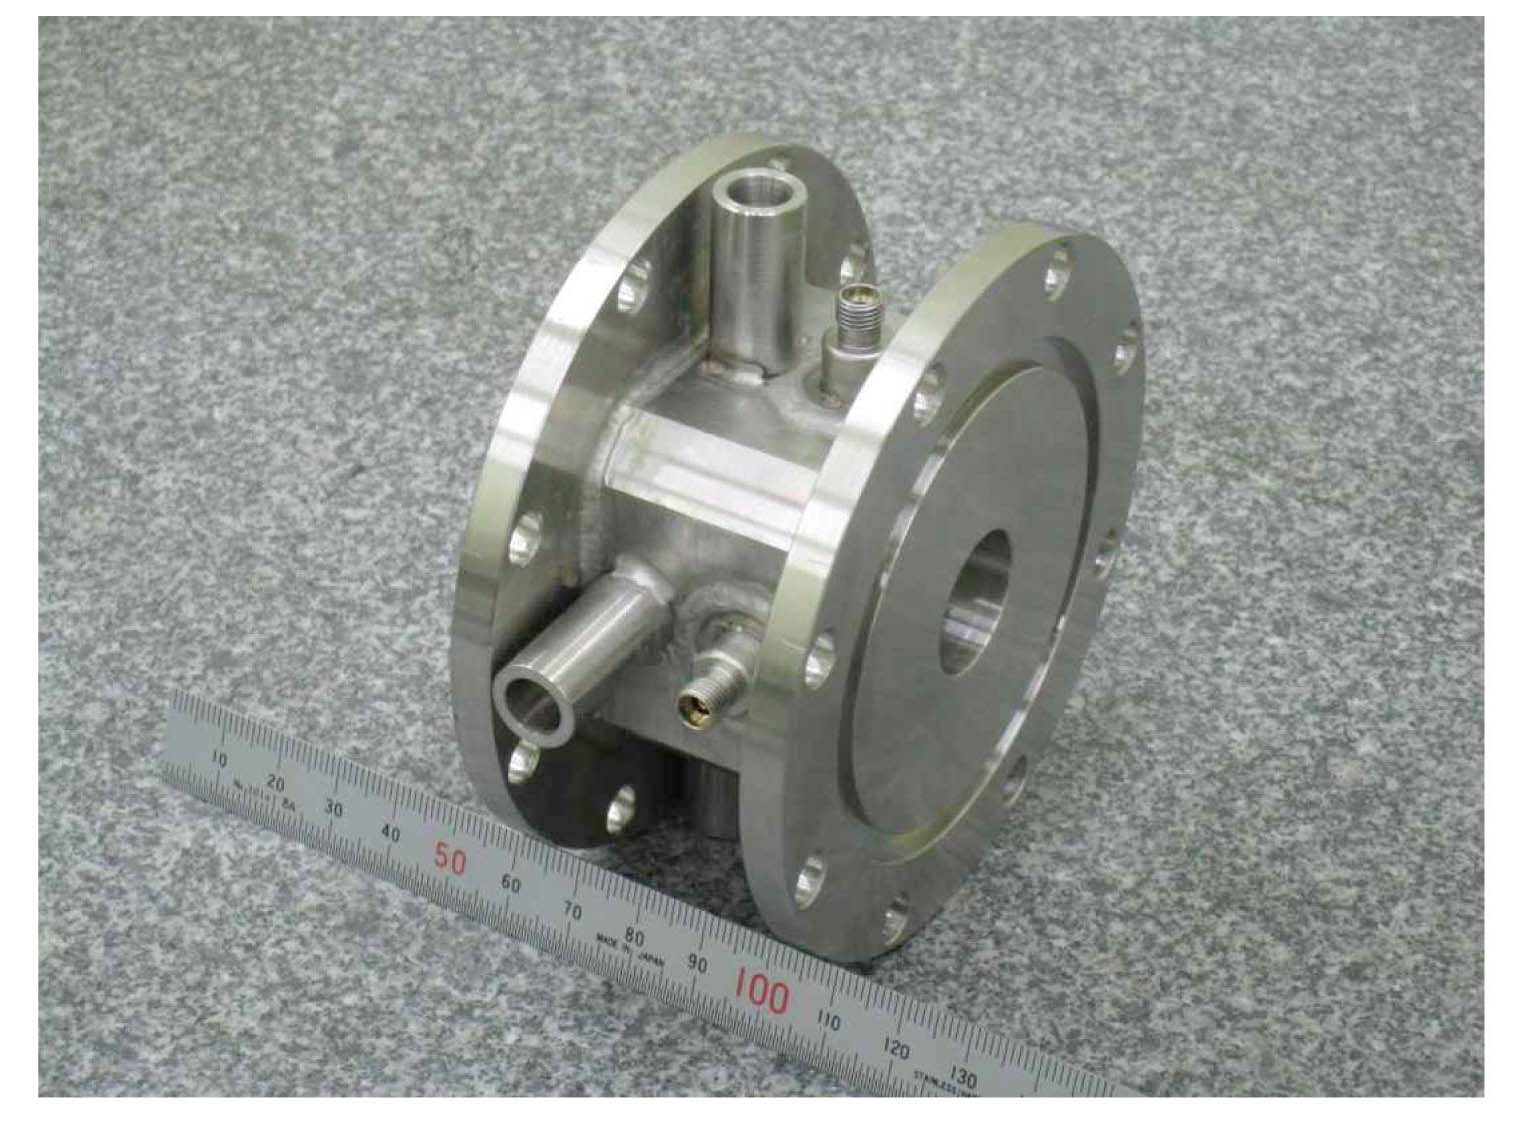
Side and cross-sectional views of the designed BPM are shown in Fig. 4. The electrodes, vacuum pipe, and flange were made of stainless steel. A low-frequency weldable SMA feedthrough (CERAMASEAL, 15310-03-W) was used as a pick-up feedthrough. The feedthrough was welded into the adapter first, then the adapter was welded into the BPM body because there was no welding lip in the feedthough. The four electrodes were machined with the wire cutting method. The vacuum pipe and the inner conductor were aligned mechanically by using an alignment pin. The inner conductor of the feedthrough was Tungsten Inert Gas (TIG) welded into the electrode. Four sets of fiducial points were installed on the BPM for the alignment. The flange was designed to fit into the DTL endplate. The fabricated BPM is shown in Fig. 5. A vacuum leak test was conducted with a helium leak detector and showed a leak rate of less than 1×10⁻⁹ Torr L/s.
The fabricated BPM was installed on the test stand to measure the RF properties, such as the coupling between electrodes and the response to the antenna location. The test stand consists of an antenna to drive the RF power, an x-y table to move the antenna, and a network analyzer to measure the RF parameters.
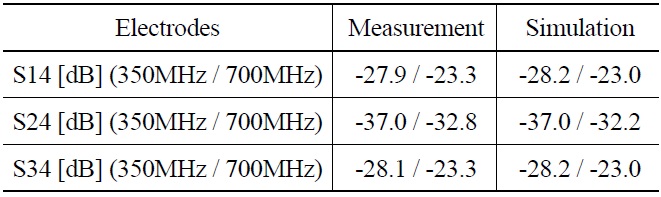
The inter-electrode coupling between two electrodes was measured by using the S21 parameters of the network analyzer on the condition that all the other ports were matched. The results are summarized in Table 3. The same properties were simulated by using the MWS code, and the results are also summarized in Table 3. The measured results showed good agreement with the simulation ones, within a 2% difference.
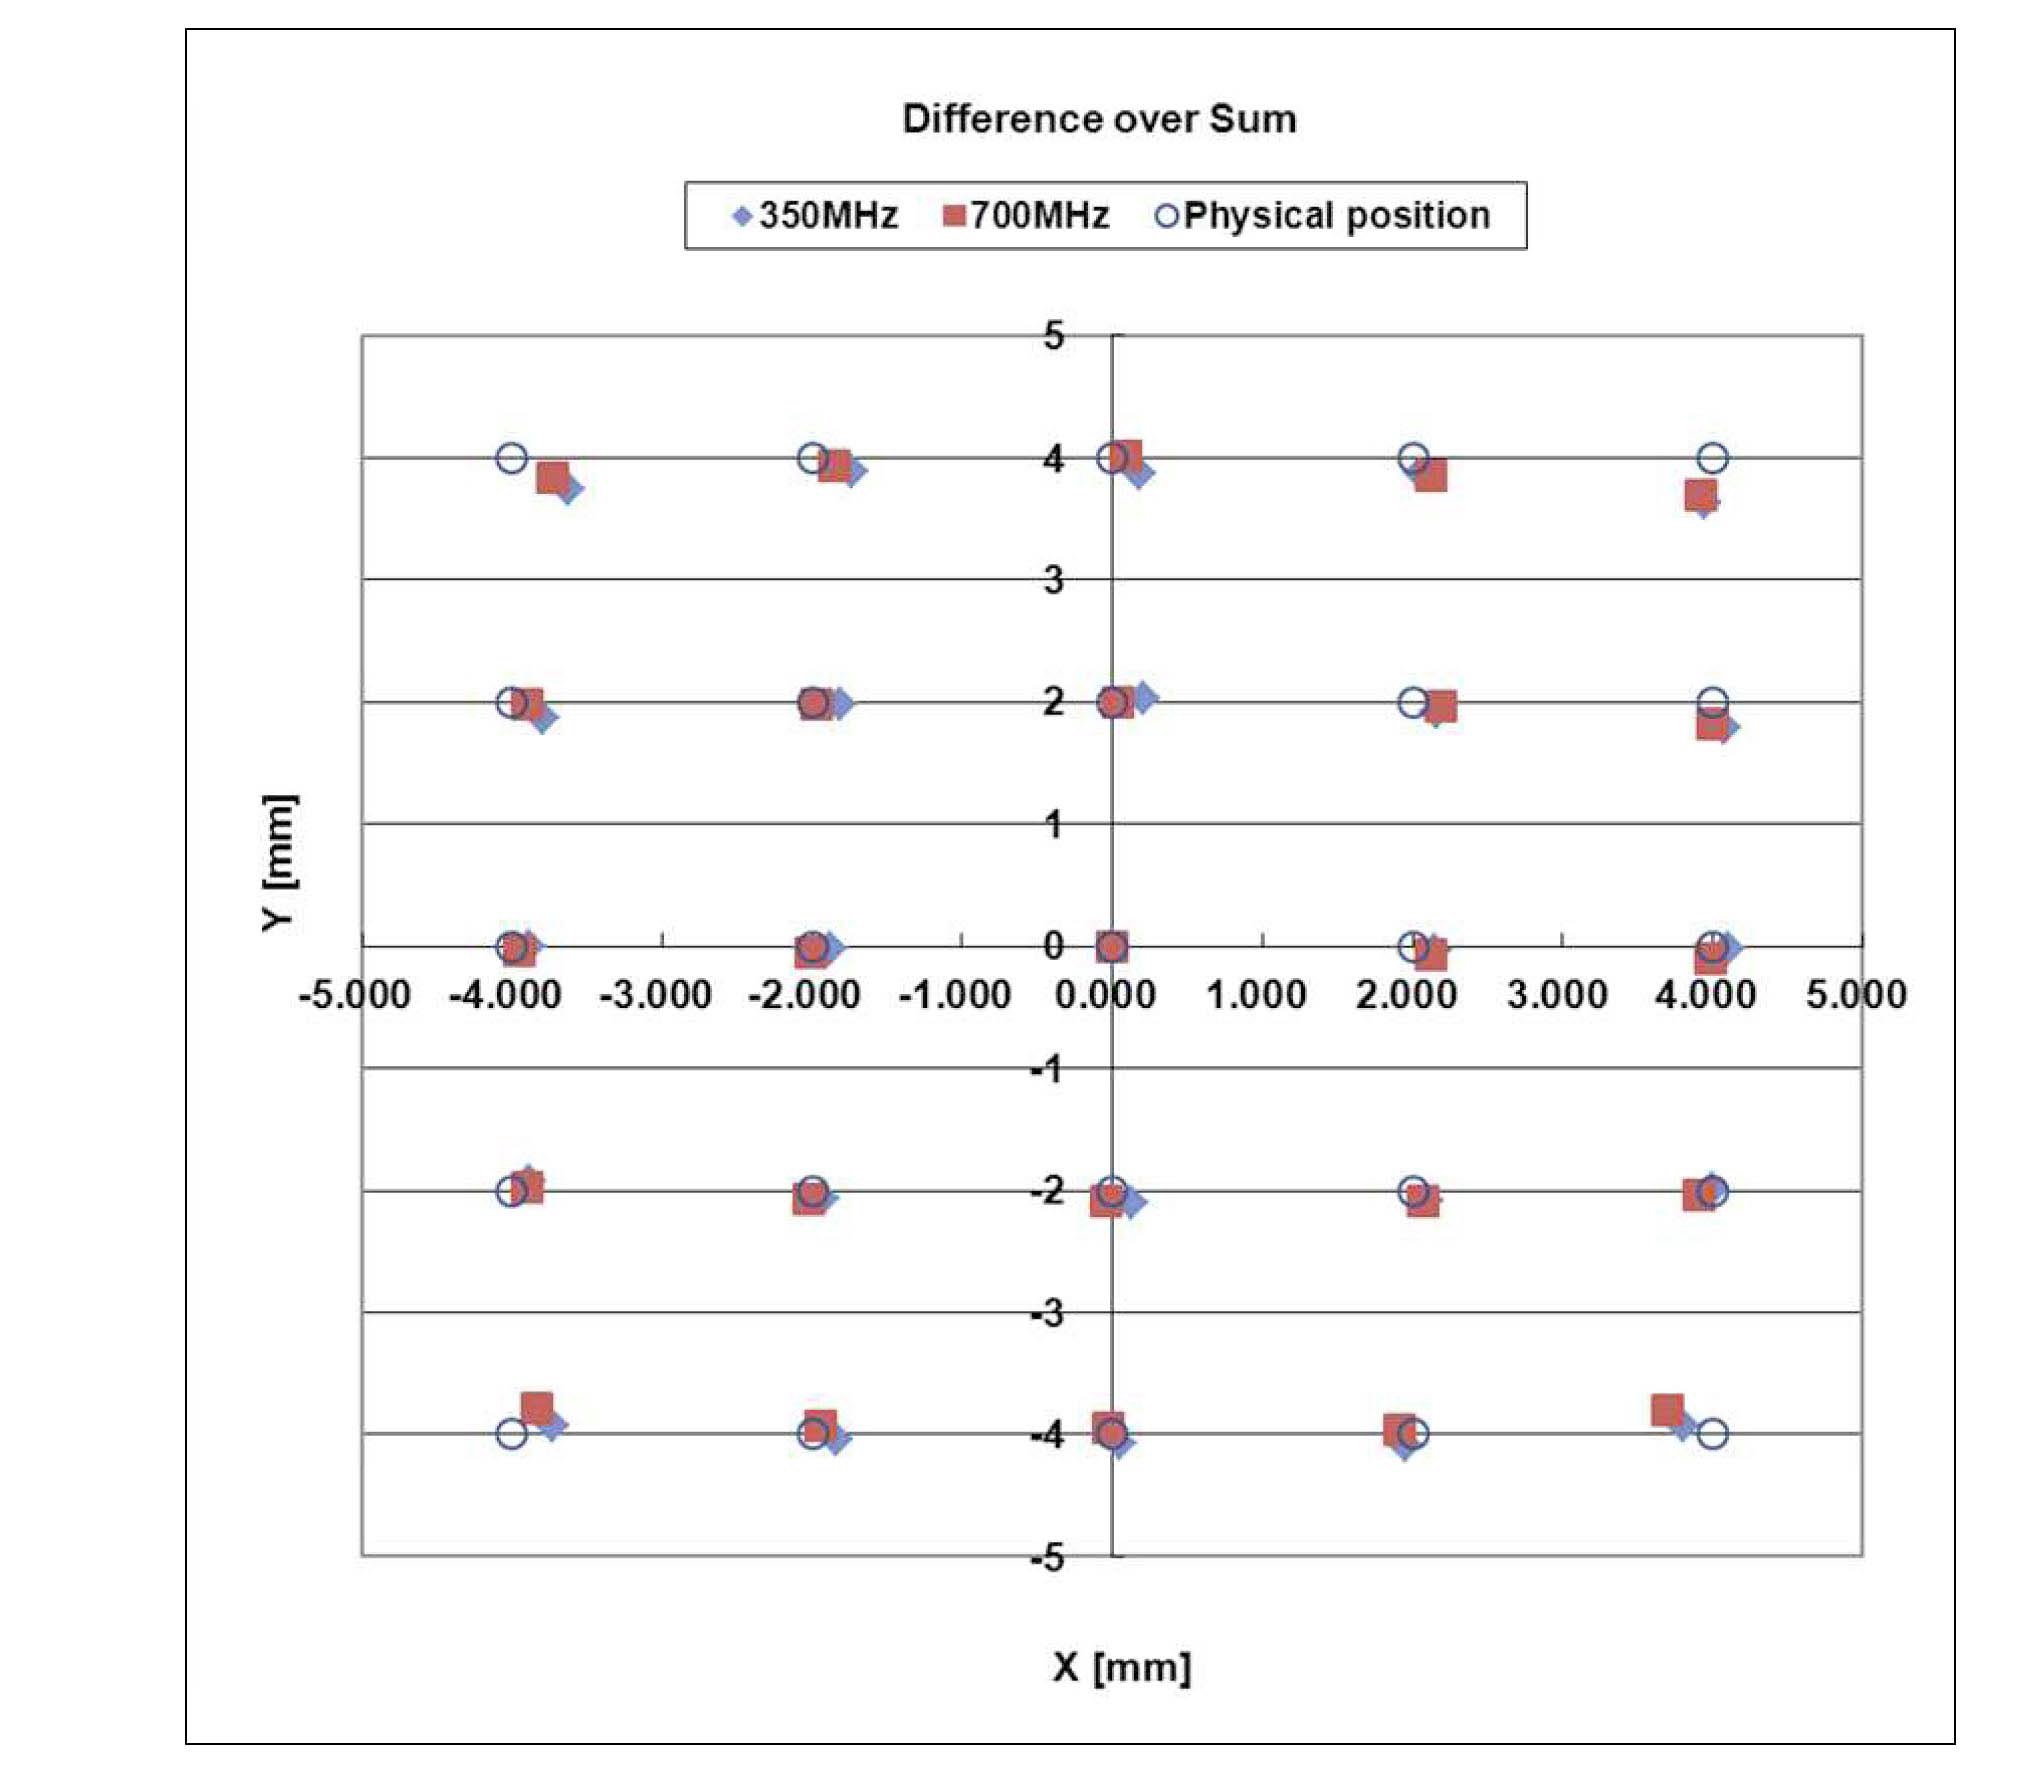
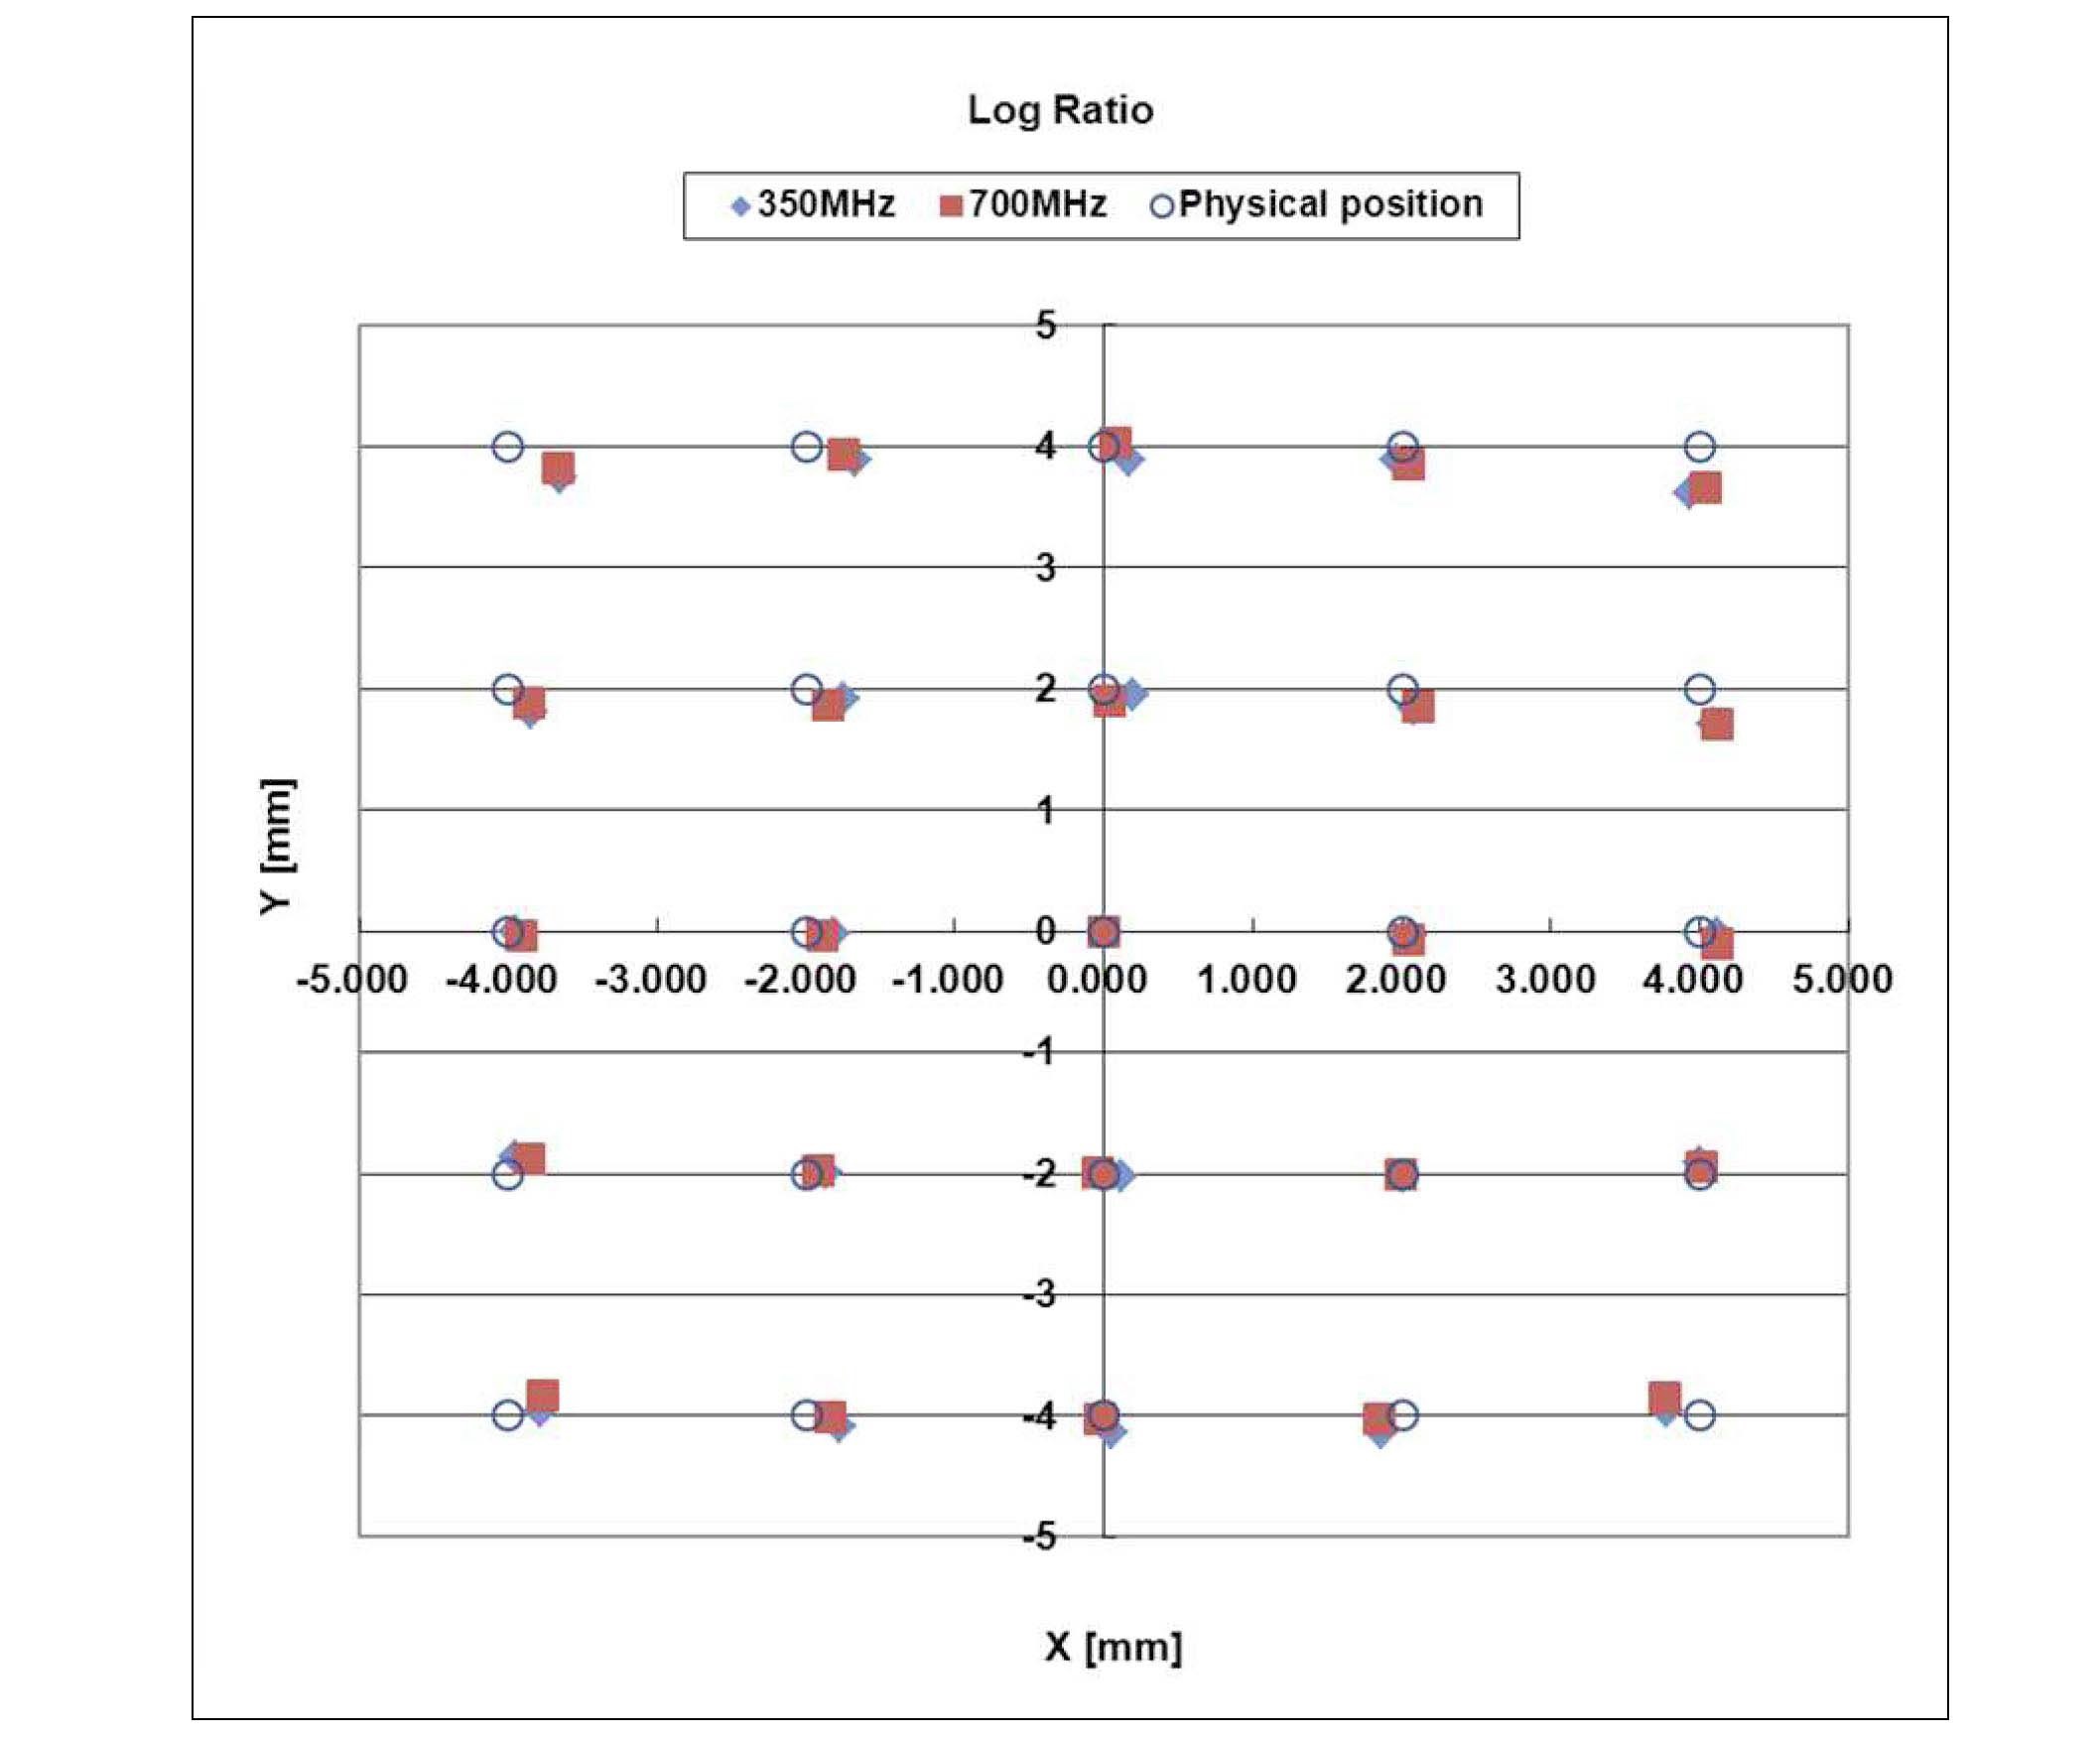
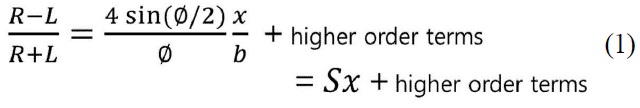
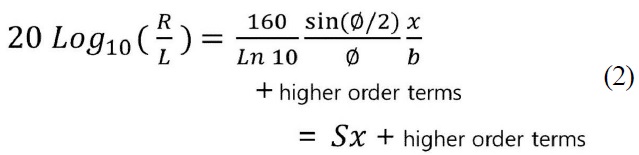
There are three general methods for deriving position data from raw pick-up electrode signals. They are the difference- over-sum method, the log-ratio method, and the amplitude-to-phase-conversion method. The differenceover- sum method is the easiest to implement and, therefore, is the most popular method. The log-ratio method has the advantage of yielding the response most linear in beam position. The amplitude-to-phase-conversion method is the most expensive one to implement, but it has the advantage of its large dynamic range and high real-time bandwidth [5]. In this paper, the difference-over-sum method and the log-ratio method were used to derive the position data from the pick-up electrode signals. An antenna was used to simulate the beam. The RF amplitudes from each of the four pick-up electrodes were measured according to the antenna position, and the measured signals were converted to position data by using the above two methods. To convert the signal amplitude to position data, the following two equations were used, i.e. Eq. (1) for the difference-oversum method and Eq. (2) for the log-ratio method:
[Table 3.] Inter-electrode Coupling Measurement Summary

Inter-electrode Coupling Measurement Summary
Here R and L are the signal amplitudes of opposite electrodes, ? is the electrode width, b is the electrode radius, x is the beam position, and S is the sensitivity of each signal processing method [5].
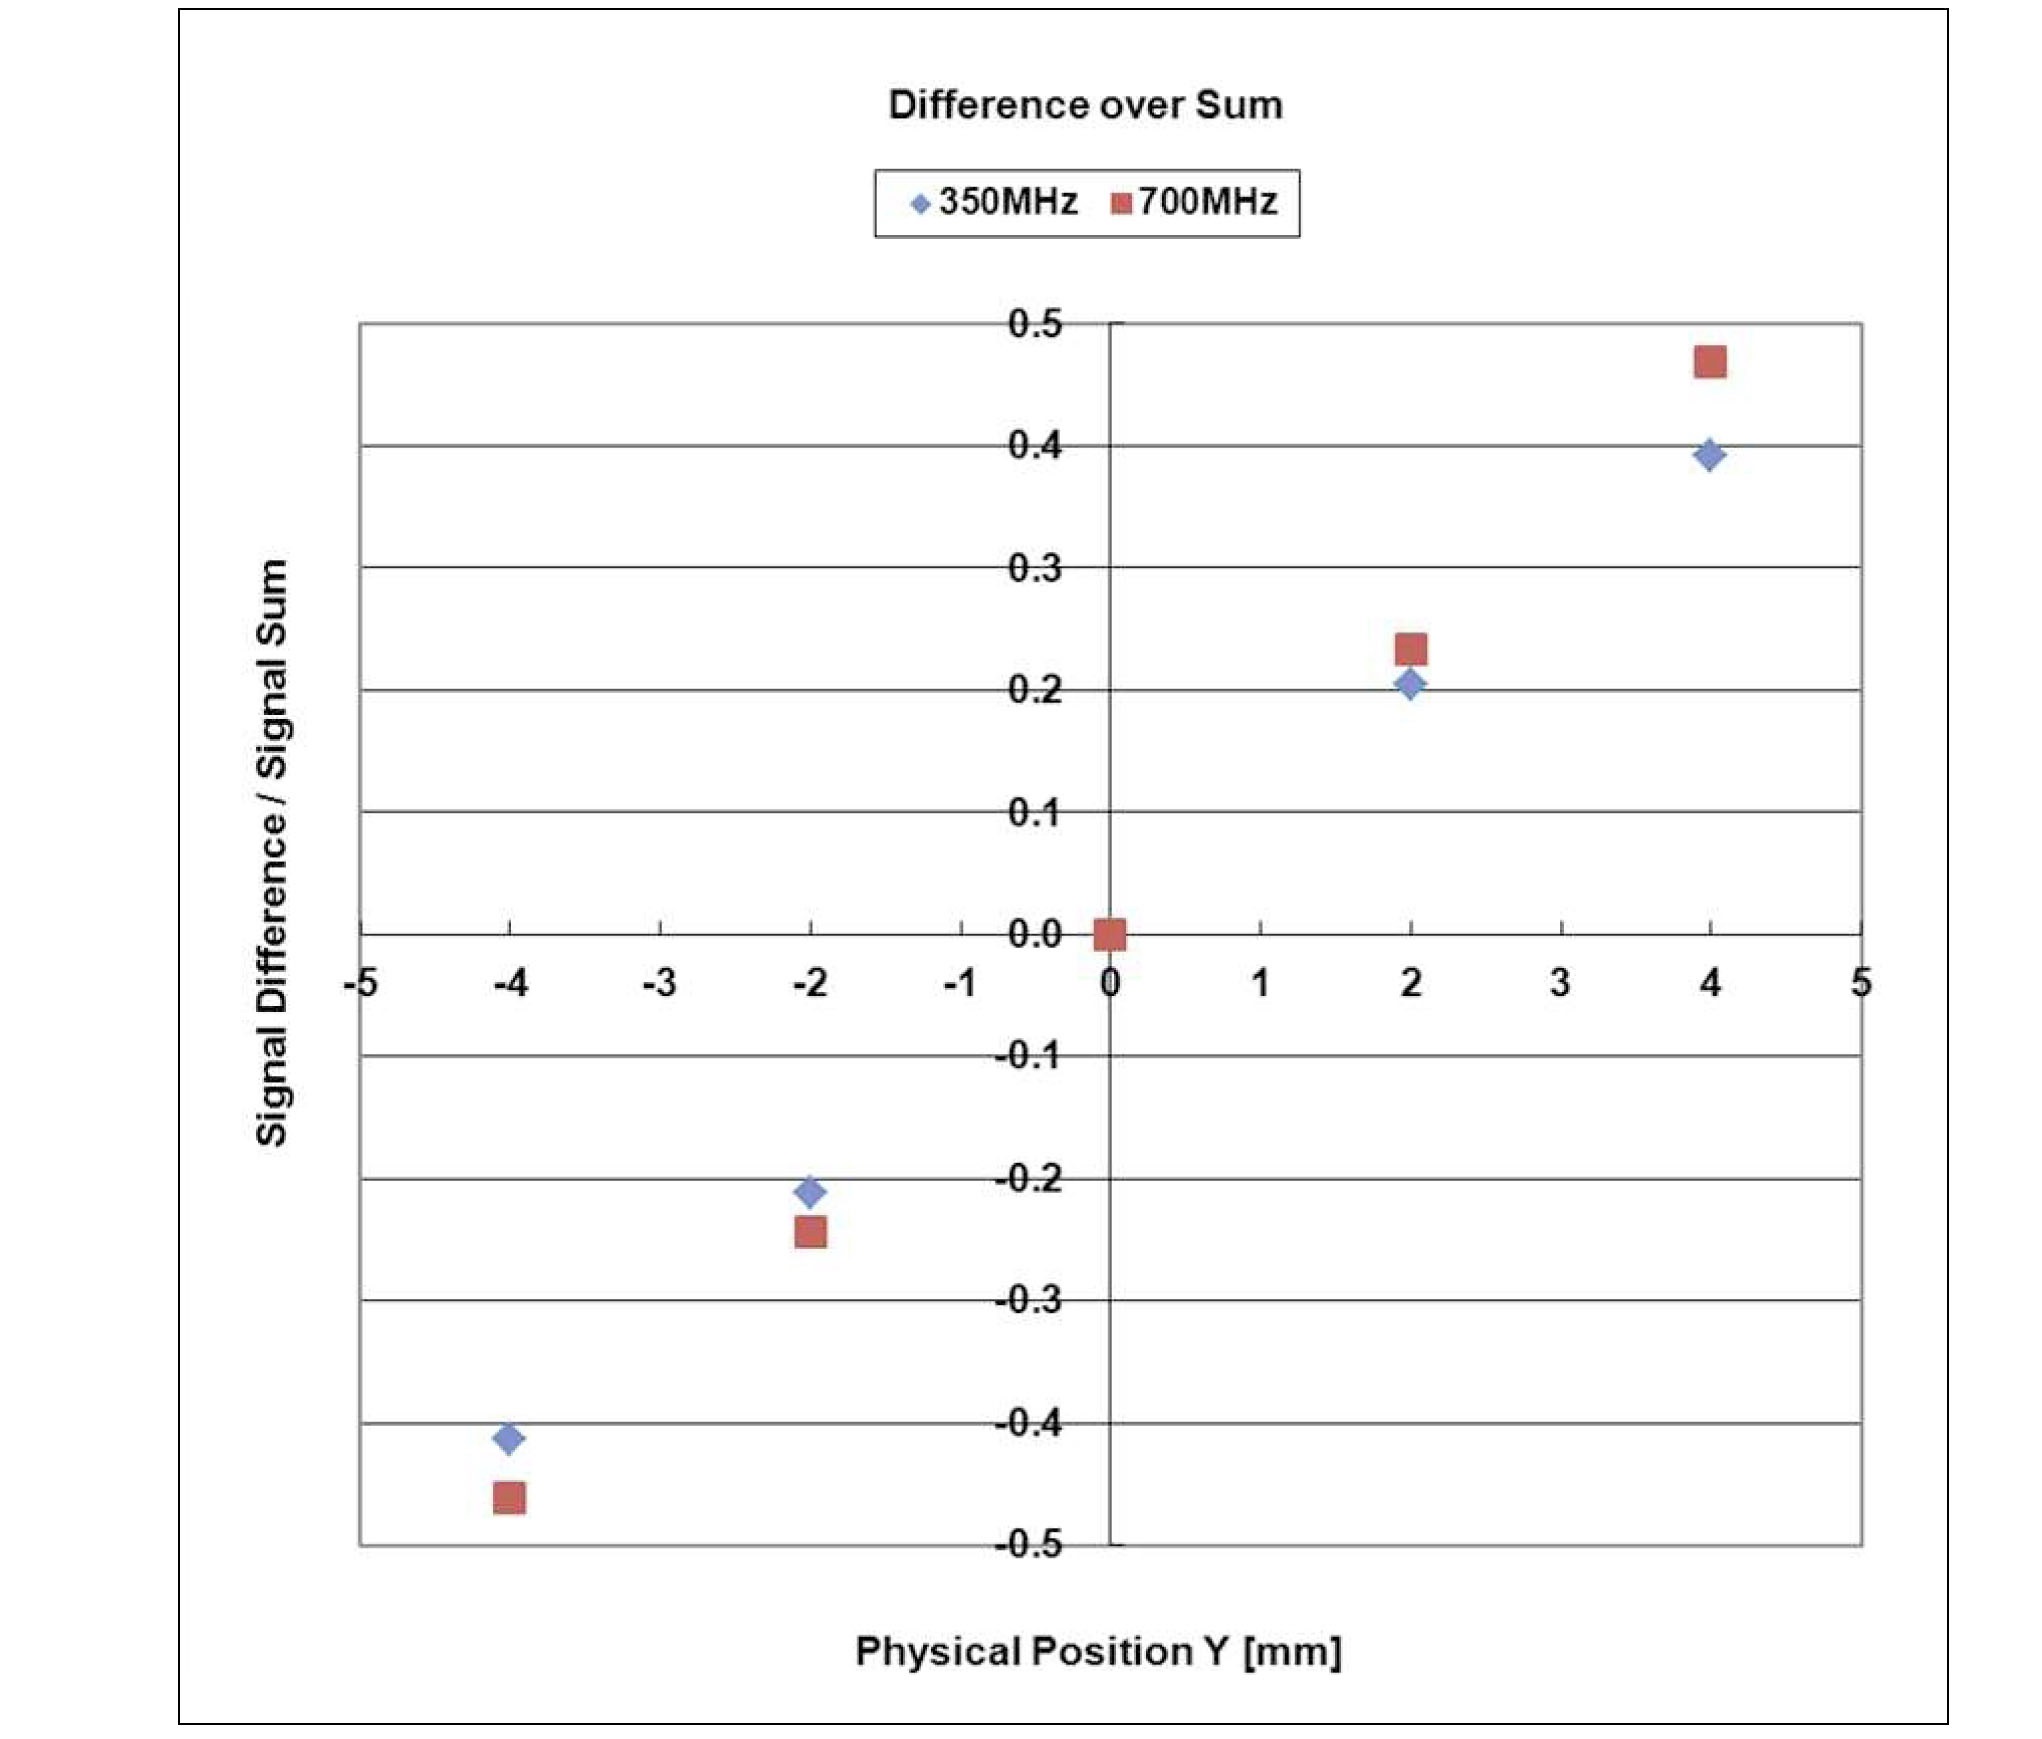
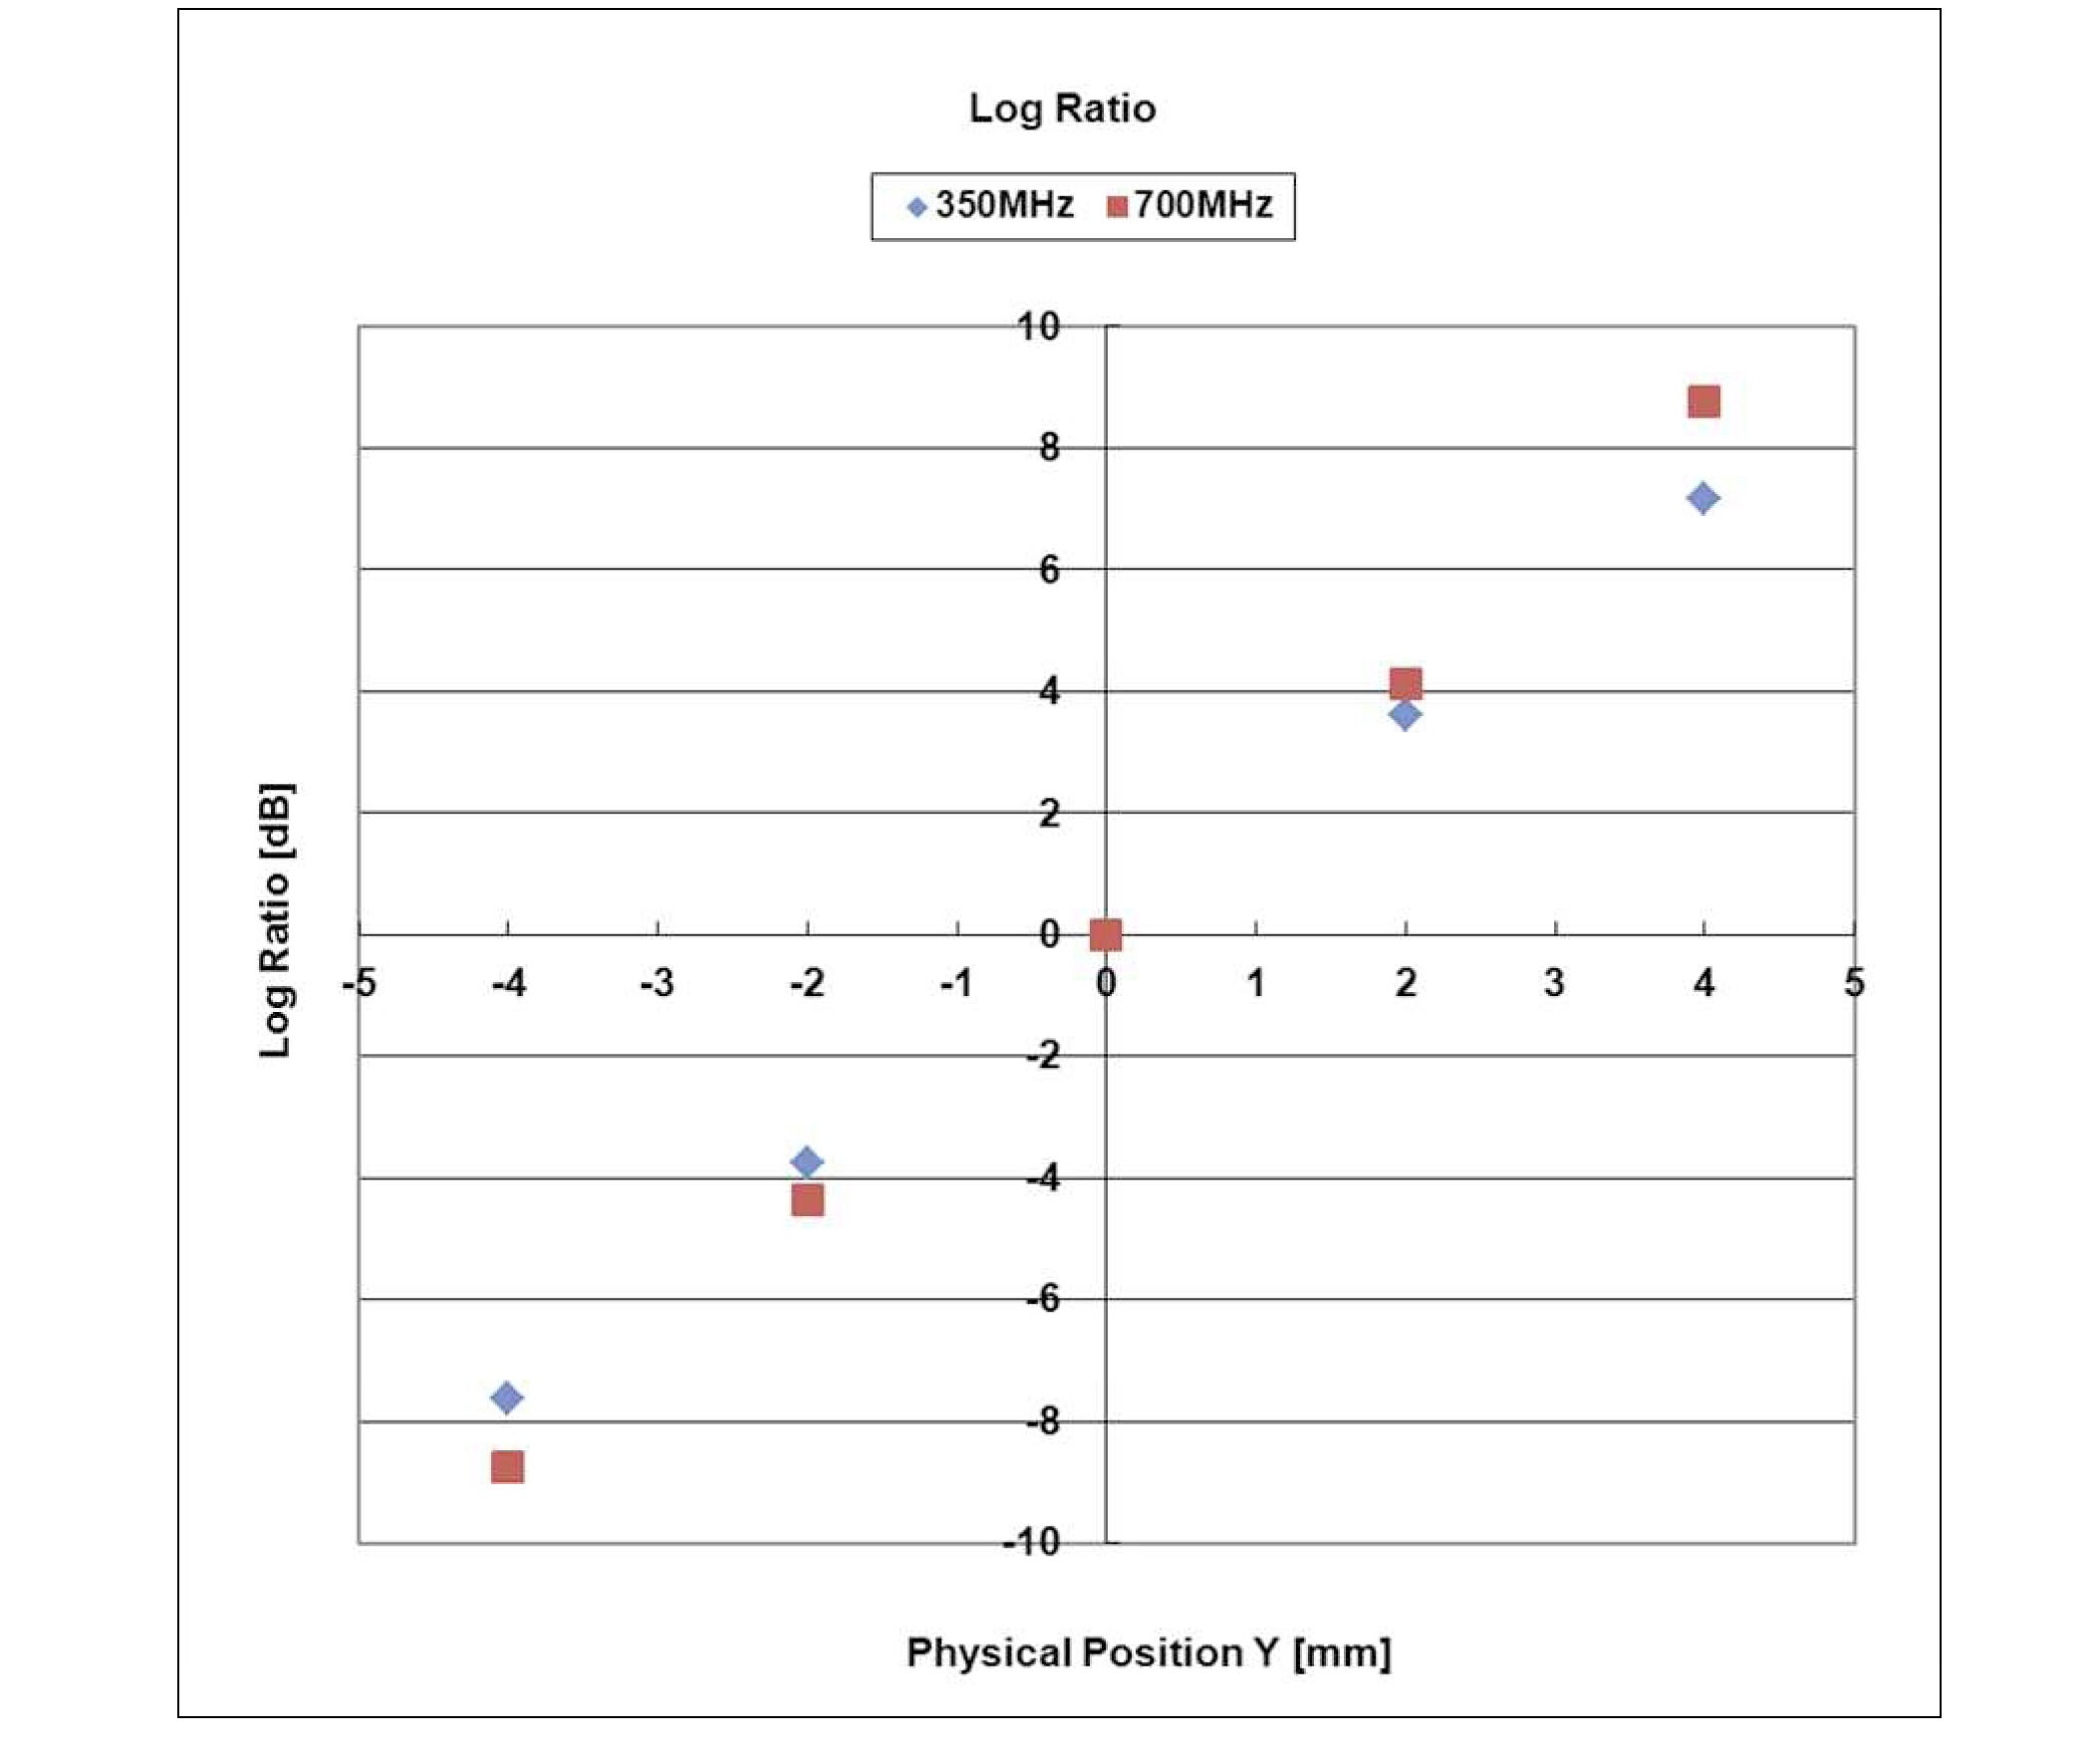
For the BPM design value, the calculated sensitivity was 19.1%/mm for the difference-over-sum method and 3.3 dB/mm for the log-ratio method. The sensitivity was measured at various antenna positions along the x-axis and the y-axis, and the results are shown in Fig. 6 and Fig. 7 for the y-axis case. In Fig. 6 and Fig. 7, the physical position
means the antenna’s position. The measured sensitivities were 10.1 %/mm at 350-MHz and 11.7 %/mm at 700-MHz for the difference-over-sum method and 1.85 dB/mm at 350-MHz and 2.18 dB/mm at 700-MHz for the log-ratio method. The difference between the measured sensitivities for the y-axis and the x-axis was less than 0.5 %. The difference between the calculated sensitivity and the measured values results from the fact that the formula was derived in two dimensions whereas the real BPM has a three-dimensional geometry.
The electrical position mapping graphs are shown in Fig. 8 and Fig. 9 for each method. The measured sensitivities were used to convert the measured signals to position data. In Fig. 8 and Fig. 9, the circles are the real positions of the antenna whereas the rectangles and the diamonds represent the processed positions derived from the measured signals. Therefore, the processed position needs to be correlated to the real position for each BPM to get real beam position data. If we use the calculated sensitivities to convert the measured data to position data, the processed position
differs from Fig. 8 and Fig. 9, but a correlation between the physical position and the processed position is still needed. The difference between the two cases, whether we used the measured sensitivity or the calculated sensitivity, is only a proportional constant. Also, the processed positions in Fig. 8 and Fig. 9 show more deviation from the physical position when they are far from the center. If the measured position is far beyond 40% of the BPM radius, which is beyond the field mapping range, the nonlinearity becomes more severe because of the higher order terms in Eq. (1) and Eq. (2). However, we don’t need to know the exact position of the beam beyond 40% of the BPM radius because it is enough to do the coarse adjustment in this range, which is decided by the BPM requirement. At a position within 40% of the BPM radius, we can find the real beam position by using the correlation data from the mapping in spite of such nonlinearity.
The strip line type BPM for the 100-MeV proton linac commissioning was designed and prototyped. The most important restriction of the design was the BPM length. An electrode length was chosen to give maximum output power with the given restriction. The designed BPM was fabricated to confirm the manufacturing procedures. Low power RF tests were done and compared with the simulation results. The coupling measurement results showed that the measured data were within 2% of the simulation results. The difference mainly results from the minor difference of the connection points between the feedthrough and the electrode. The values of the difference over sum and log-ratio were measured and the results showed that the difference between the 350 MHz signal and 700MHz signal of each method was small whereas the absolute port power of the 700MHz signal was higher than that of the 350MHz signal, which was the same result estimated in the design stage. The advantage of the 700MHz signal is its higher power level but it needs additional electronics to treat the 700MHz signal. Therefore, we are going to select the BPM operation frequency considering not only the power level but also the ancillary system requirements. Two signal processing methods were compared, which were the difference over sum and logratio methods. Both the difference over sum and log-ratio method showed little difference, and had linear response within 40% of the BPM radius. We are going to use the log-ratio method to treat the signal because we already used log-ratio BPM electronics for the 20-MeV linac BPM.