Zirconium cladding tubes are the first barrier of nuclear fuel in light water reactors (LWRs) since they have good corrosion resistance and mechanical properties under the operating conditions of LWRs. Welded tubes, which are manufactured by the welding of rolled sheet materials, cannot be used in a nuclear system because a non-uniform area with a mechanical property and texture is formed at the welded point. Thus, non-welded (seamless) tubes have to be used in components such as fuel cladding tubes, guide tubes, and instrumentation tubes in the fuel assembly of LWRs. Generally, a seamless tube can be manufactured by drawing, extruding, or pilgering. Among them, pilgering is the most common production method for the manufacturing of cladding tubes, because a degree of cold work of more than 75% in the area fraction can be achieved [1]. Therefore, zirconium cladding tubes have been manufactured by applying the pilgering process to hot extruded billets.
At the present time, advanced zirconium alloys have been developed in many countries to achieve the environmental needs of LWRs, such as a high burn-up and extended fuel cycle. The advanced zirconium alloys contain Nb as an alloying element, unlike Zircaloy-4 (Zr-1.5Sn-0.2Fe- 0.1Cr in wt.%), to improve the corrosion resistance up to a high burn-up [2-4]. Tube manufacturing of Nb-containing Zr alloy is difficult because the strength of that alloy is increased by the solution and precipitation hardening effect [5,6]. In addition, the intermediate annealing temperature during the tube manufacturing process of Nb-containing Zr alloy is lower than 610℃ to improve the corrosion resistance [6]. Since this temperature is considerably lower than Zircaloy-4’s annealing temperature of 700℃ [1], the Nb-containing Zr alloy has a smaller grain than Zircaloy- 4 after the intermediate annealing during the tube manufacturing. For this reason, it is anticipated that tube manufacturing using an Nb-containing Zr alloy will be more difficult than using Zircaloy-4.
Work hardening (strain hardening) is one of the major factors to evaluate the deformation behavior of metal base materials in general. In the zirconium base alloy, it was reported that the uniform elongation and total elongation were related to the work hardening exponent [7]. Thus, the manufacturing properties of the Zr alloys can be estimated by the work hardening exponent. The objective of this study is to analyze the work hardening behaviors of zirconium base alloys containing high-Nb (more than 1.0 wt.%). Also, microstructural observation and crystalline texture analysis for the materials were performed to evaluate the work hardening behavior of the zirconium base alloys.
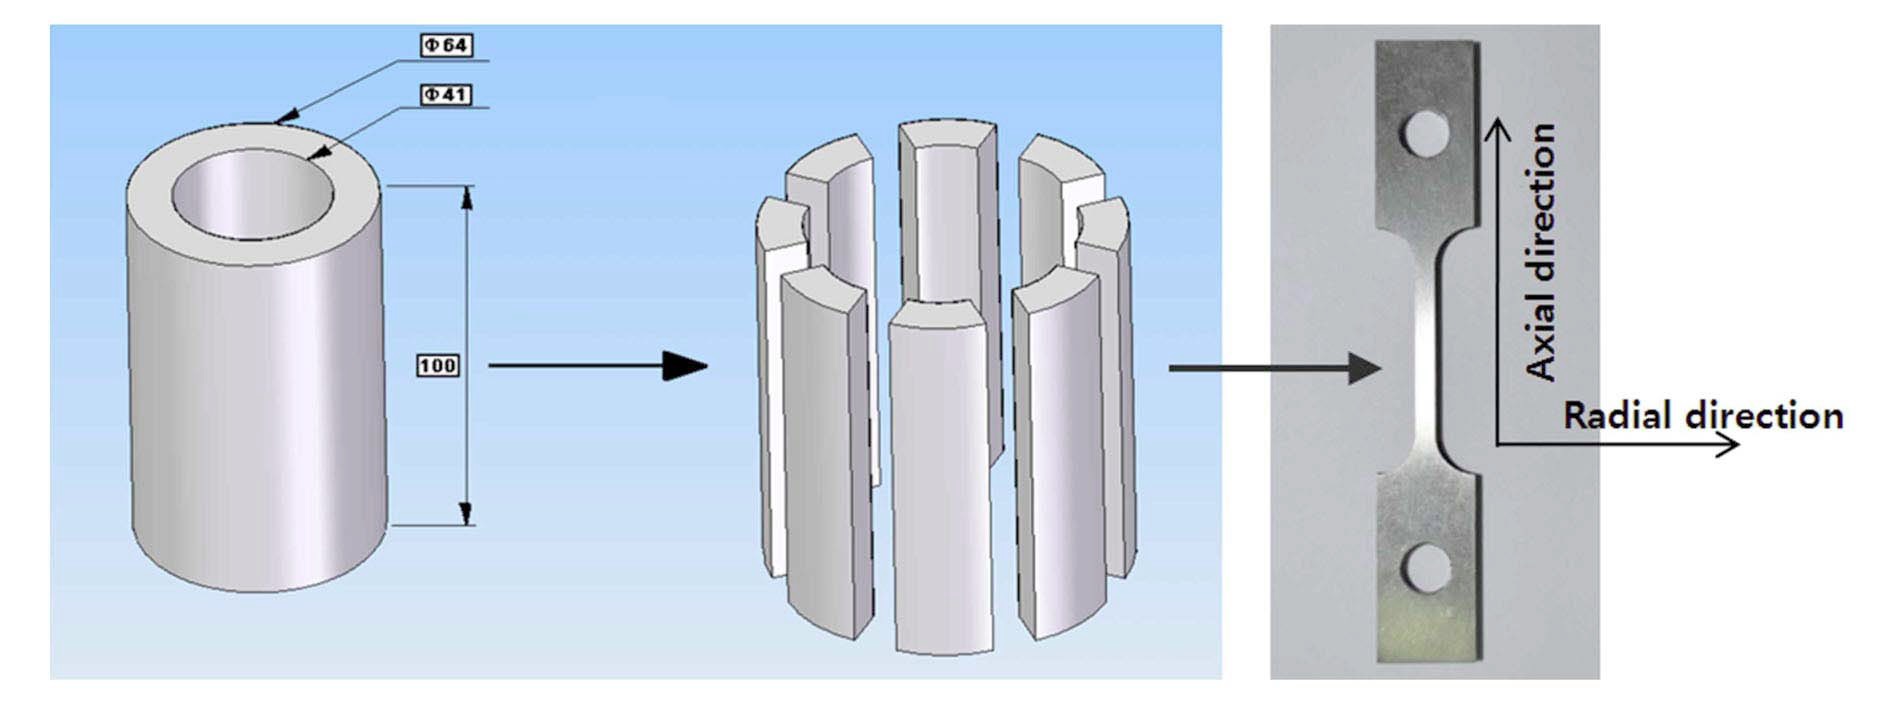
The chemical compositions and area fraction of the second phase particle (SPP) of the three selected alloys in this work are shown in Table 1. The alloy compositions were selected to evaluate the hardening effect on the advanced Zr alloys of ZIRLO (Zr-1Nb-1Sn-0.1Fe in wt.%) [2], HANA-4 (Zr-1.5Nb-0.4Sn-0.2Fe-0.1Cr in wt.%) [8], and HANA-6 (Zr-1.1Nb-0.05Cu in wt.%) [9]. The tensile specimens of a dog bone type were cut from the TREX (Tube Reduced Extrusion) of each alloy as shown in Fig. 1, because the tube manufacturing of zirconium cladding starts from TREX. The initial size of the TREX was 4,000 mm in the axial length, 10.9 mm in tube thickness, and 63.5 mm in outer diameter. X-ray diffraction analyses (XRD) were conducted to determine the texture of the TREX. The crystallographic texture was analyzed by means of X-ray diffraction with a four-cycle Goniometer (Bruker, AXS 5005 model). The pole figure of each alloy TREX was calculated from the measured

poles. Kearns proposed a texture orientation parameter (f) based on the measured pole figure [10]. The f-factor could be defined in terms of the effective fraction of the grains with their basal poles aligned in a particular direction as follows.
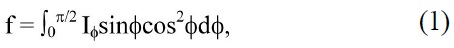
where I?sin? is the volume fraction of the grains with their c-axes oriented at a tilt angle from the reference direction, with I? expressed in the unit.
Tensile specimens were machined to have a gauge length of 12.5 mm with a width of 2 mm and 2 mm thicknesses lying parallel to the TREX axial axis. The specimens were tested at room temperature using an Instron type tensile testing machine with the procedure of ASTM E8 ? 82 [11], and the crosshead speed during the tensile test was 1.7 x 10⁻³ s-1 for all specimens. Three tests were done for each alloy in both single and repeated tests, and very good reproducibility in terms of strength can be confirmed from the comparison of the strength values for each test result. This test provided information on the strength and ductility of the materials under uniaxial tensile stresses. Stress and elongation values were obtained from the attached computer on the tester. Several parameters were calculated from the true stress (σ) versus true plastic strain (ε) curve to evaluate the work hardening behavior. The work hardening exponent (n) was estimated by fitting a straight line to the plots of log σ versus log ε. This behavior can be described by the Hollomon equation [12] as below.
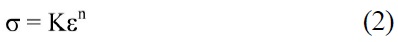
where K is the strength coefficient, ε is the plastic strain, and n is the work hardening exponent. The constant K is material dependent and is influenced by processing while the work hardening exponent (n) is a material property normally lying in the range of 0 ? 1. A value of zero means that a material is a perfectly plastic solid, while a value of 1 represents a 100% elastic solid. Most metals have an n value between 0.1 and 0.5 [13]. In this work, repeated tensile tests were applied for the one specimen to simulate the pilgering process, because cold working is repeatedly applied on TREX during the pilgering process. Also, the elongation at each test was up to 5%. Thus, the work hardening exponent (n) was repeatedly calculated from the elongation ranges of 0 - 5%. Since the yield stress will be increased by a factor depending on the amount of accumulated plastic at low temperature, the value of yield stress will be increased with the repeated tensile test of 5%.
After the tensile test, microstructural observation was performed using a scanning electron microscope (SEM) to evaluate the fractured surface and necking region of the tested samples. The transmission electron microscope (TEM) observation was performed to analyze the microstructural characteristics. The TEM samples were cut from the necking area of the tensile tested specimens, and then ground up to 70 μm using SiC paper. Finally, TEM samples were electro-polished by a twin-jet polisher with a solution of 10 vol.% HClO4 and 90 vol.% C2H5OH, and then examined for the microstructure both before and after tensile tests. The area fraction of SPP, which is shown in Table 1, was measured by image analyzer for the observed TEM images of the TREX.
3.1 TREX Property and Tensile Test of Zirconiumbased Alloys
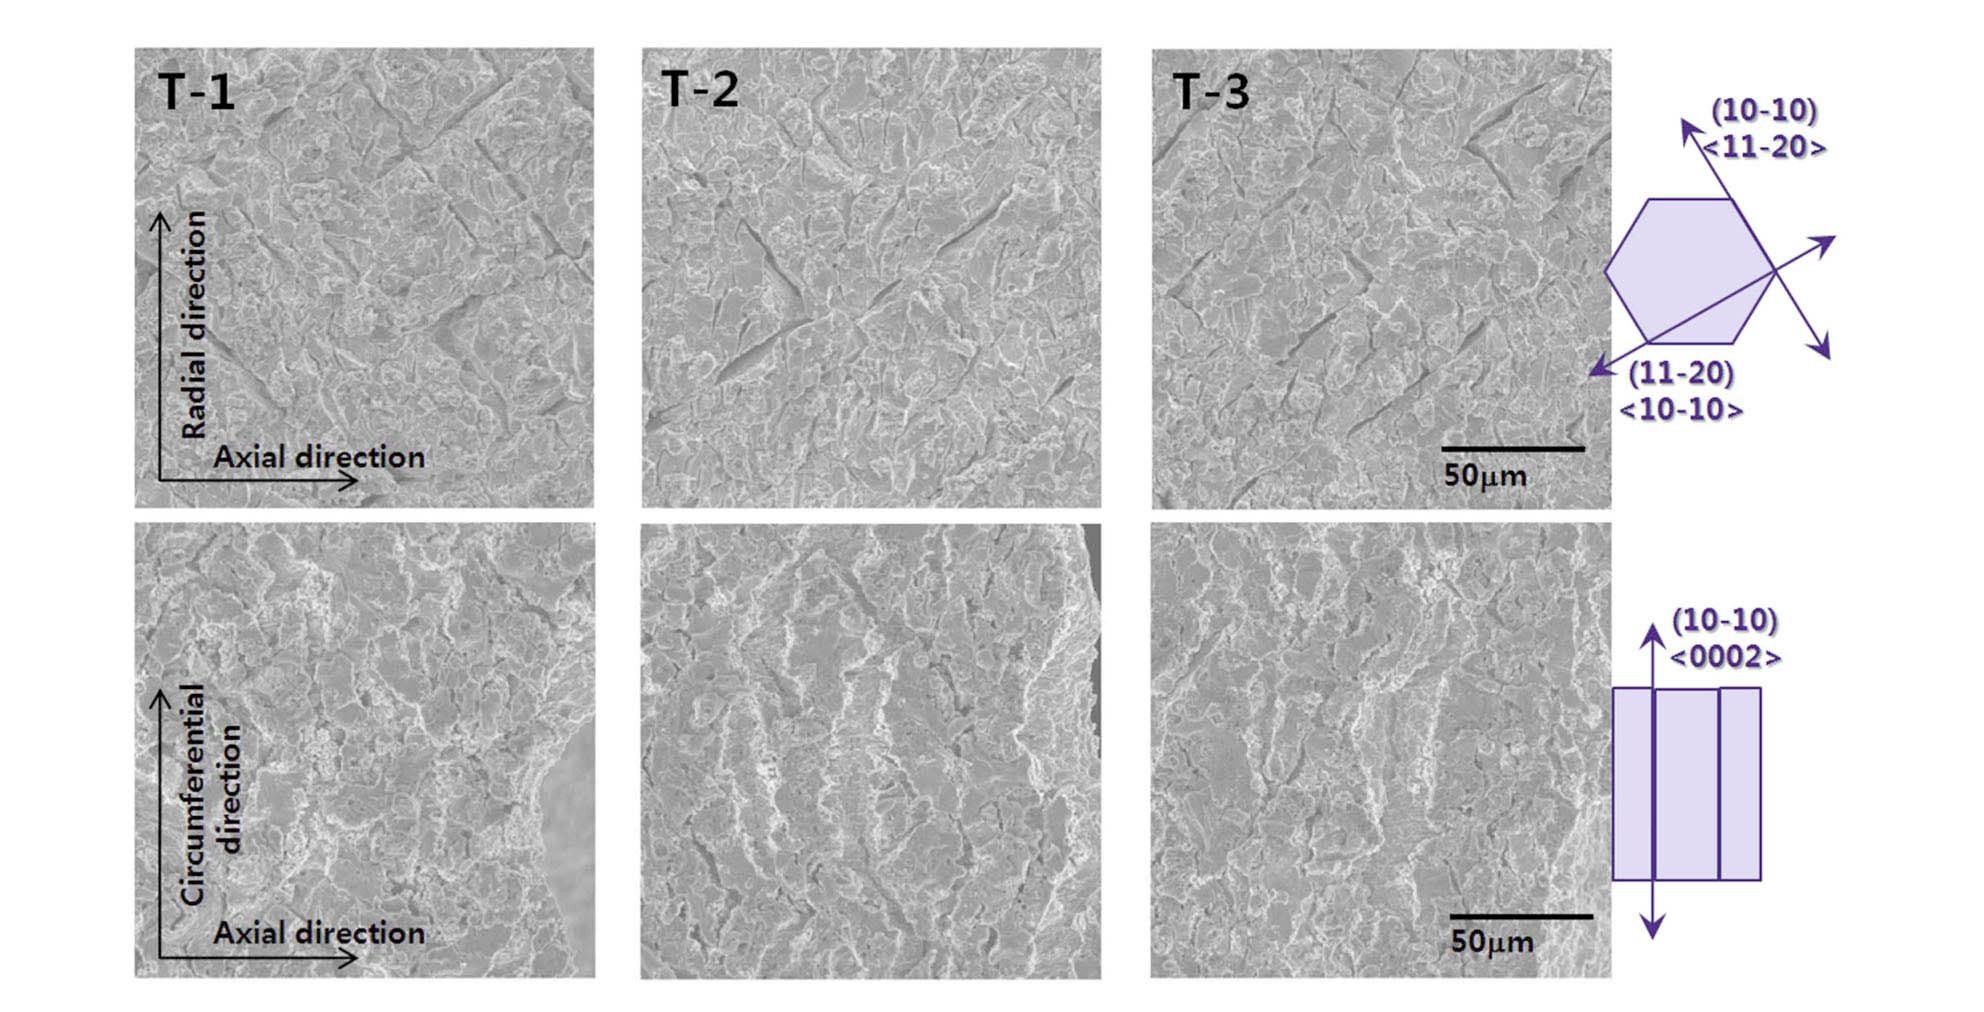
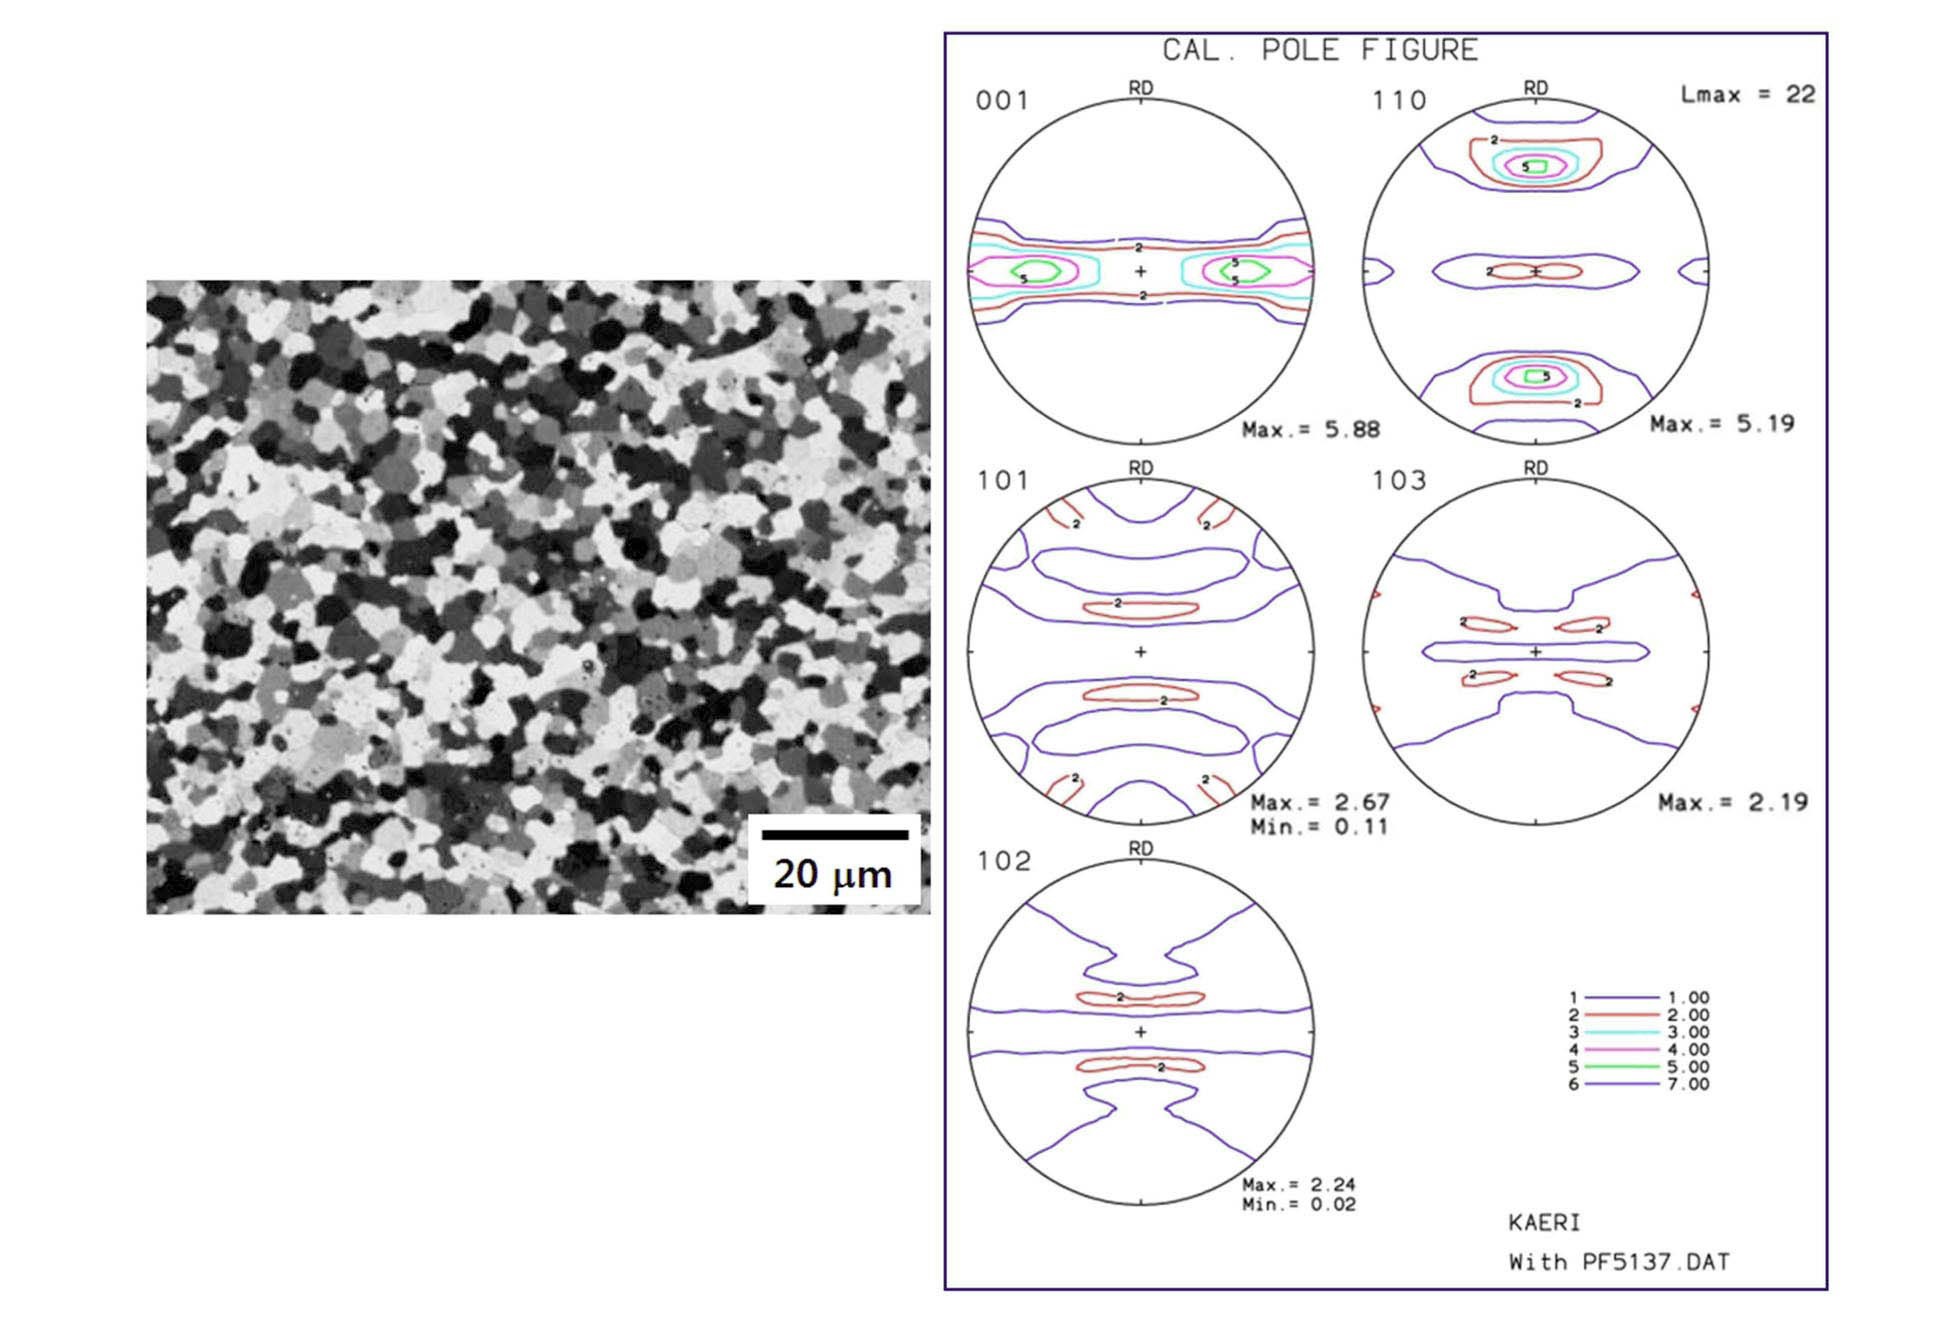
Fig. 2 shows the optical micrograph and pole figure results of T-1 alloy. The microstructure of TREX for the three selected alloys had a fully recrystallized state with a
[Table 1.] Chemical Composition and Area Fraction of SPP in Zirconium-based Alloys
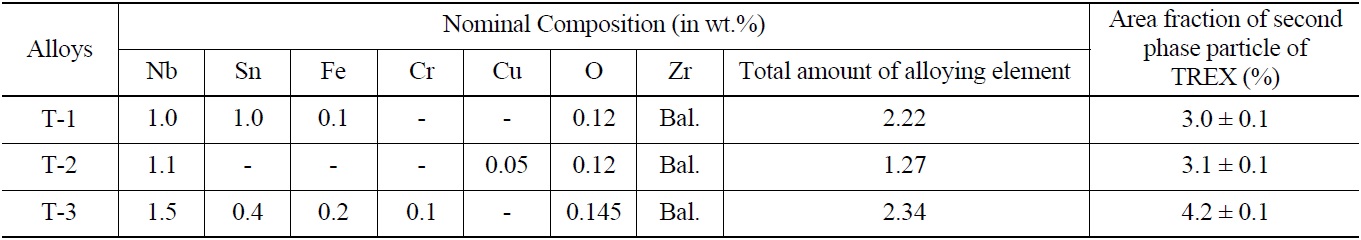
Chemical Composition and Area Fraction of SPP in Zirconium-based Alloys
mean grain size of 7 μm. In general, the TREX microstructure is controlled to make the fully recrystallized state, which shows low strength in Zr base alloys, because the tube pilgering is easily progressed when the strength value of alloys reaches the bottom state. In addition, the TREX annealing of Nb-containing Zr alloys is performed at the recrystallized temperature without the formation of β-Zr phase, because the strength is increased by the β-Zr phase formation. From this reason, the TREX microstructure of the Nb-containing Zr alloys such as T1, T2, and T3 alloys is very similar.
From the pole figure results obtained from the XRD analysis, the Kearns index of the three alloys was calculated, the results of which are shown in Table 2. The (0002) basal plain in the three types of alloy was considerably oriented to the circumferential normal (~49%) and radial normal directions (~44%) in TREX. It is known that the texture of the three alloys to study the work hardening was similarly developed in the TREX state. At the final cladding tube, the (0002) basal plane was strongly developed
[Table 2.] Kearns Index of the Zirconium-based Alloys
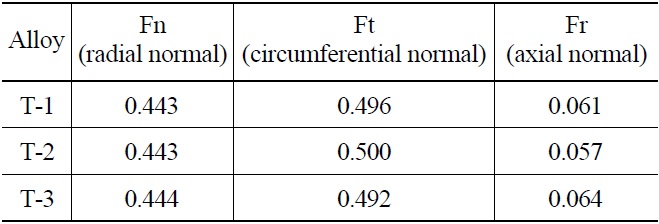
Kearns Index of the Zirconium-based Alloys
to the radial normal direction (~60%) using a tube pilgering process [14].
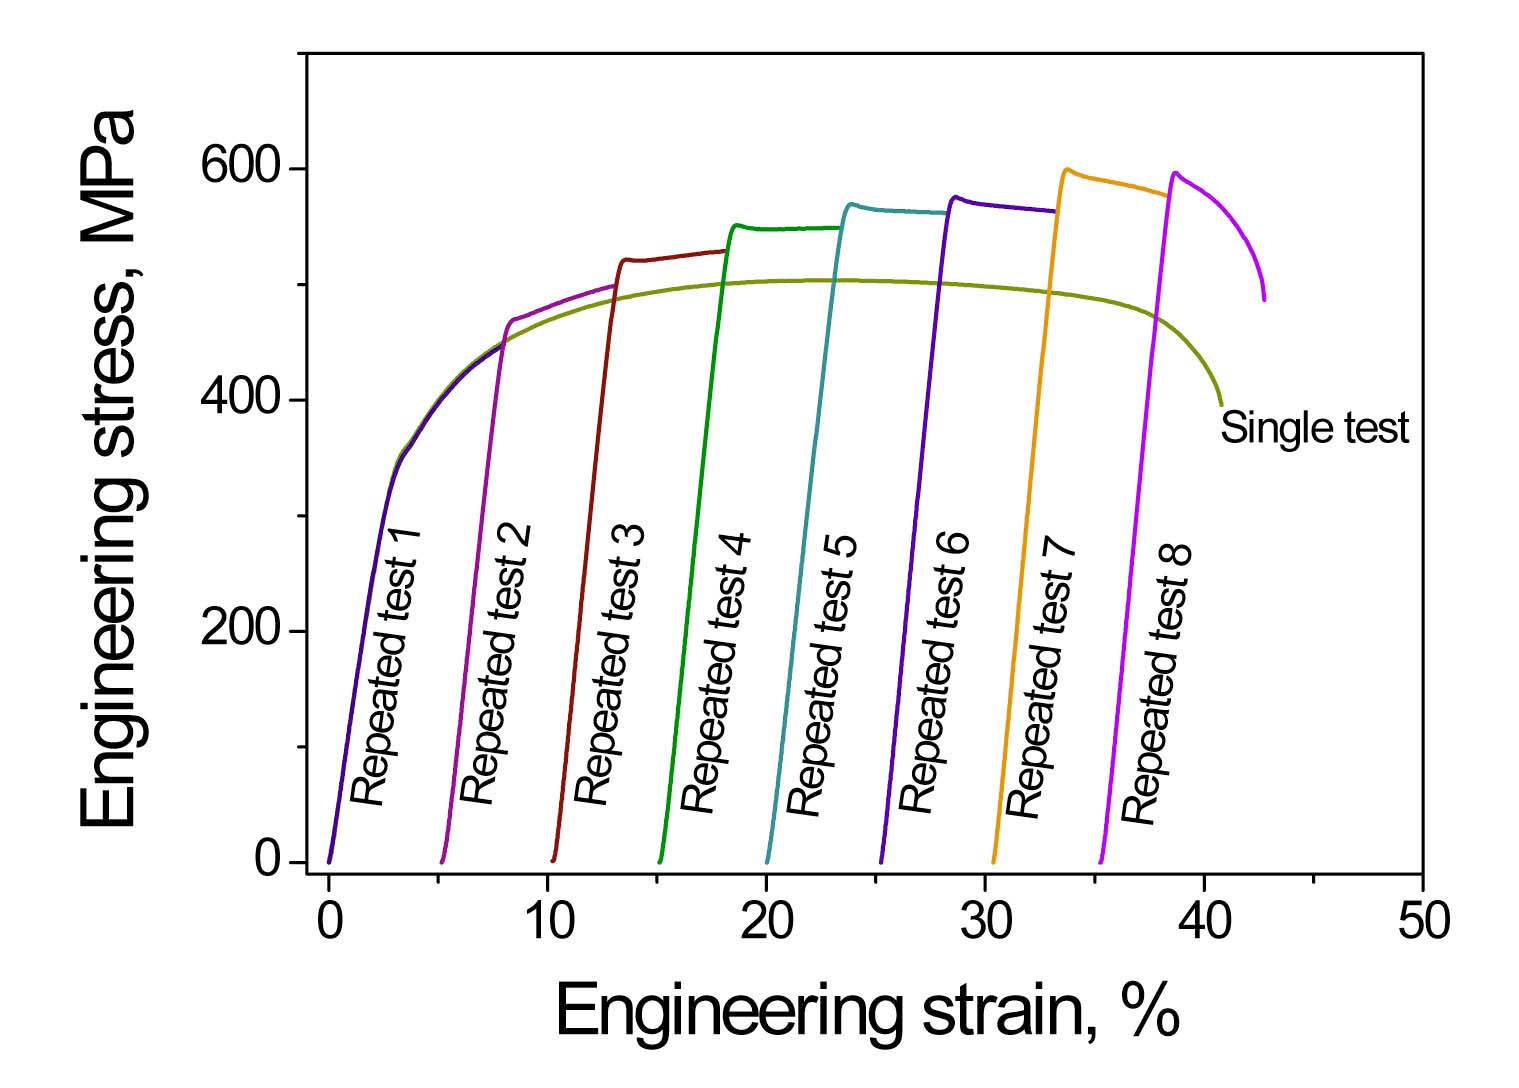
Fig. 3 shows the nominal stress-strain curve (marked as single test) and cyclic stress-strain curves (marked as repeated test), which were obtained by repeated tensile tests of a 5 % strain for the same sample of the T-1 alloy. These tests were also performed on the T-2 and T-3 alloys. When compared to the nominal stress-strain curve of the T-1 alloy, the yield strength (YS) was increased when increasing the test number up to 8 cycles except for the
repeated test number, 1. Thus, it is known that the work hardening effect was clearly shown by the 5% strain in the tested zirconium-based alloy. The total strain after the repeated tensile test was shown to be 40% in the T-1, 41% in the T-2, and 35.5% in the T-3 alloys. Thus, it is known that the ductility of the T-3 alloy was lower than the others.
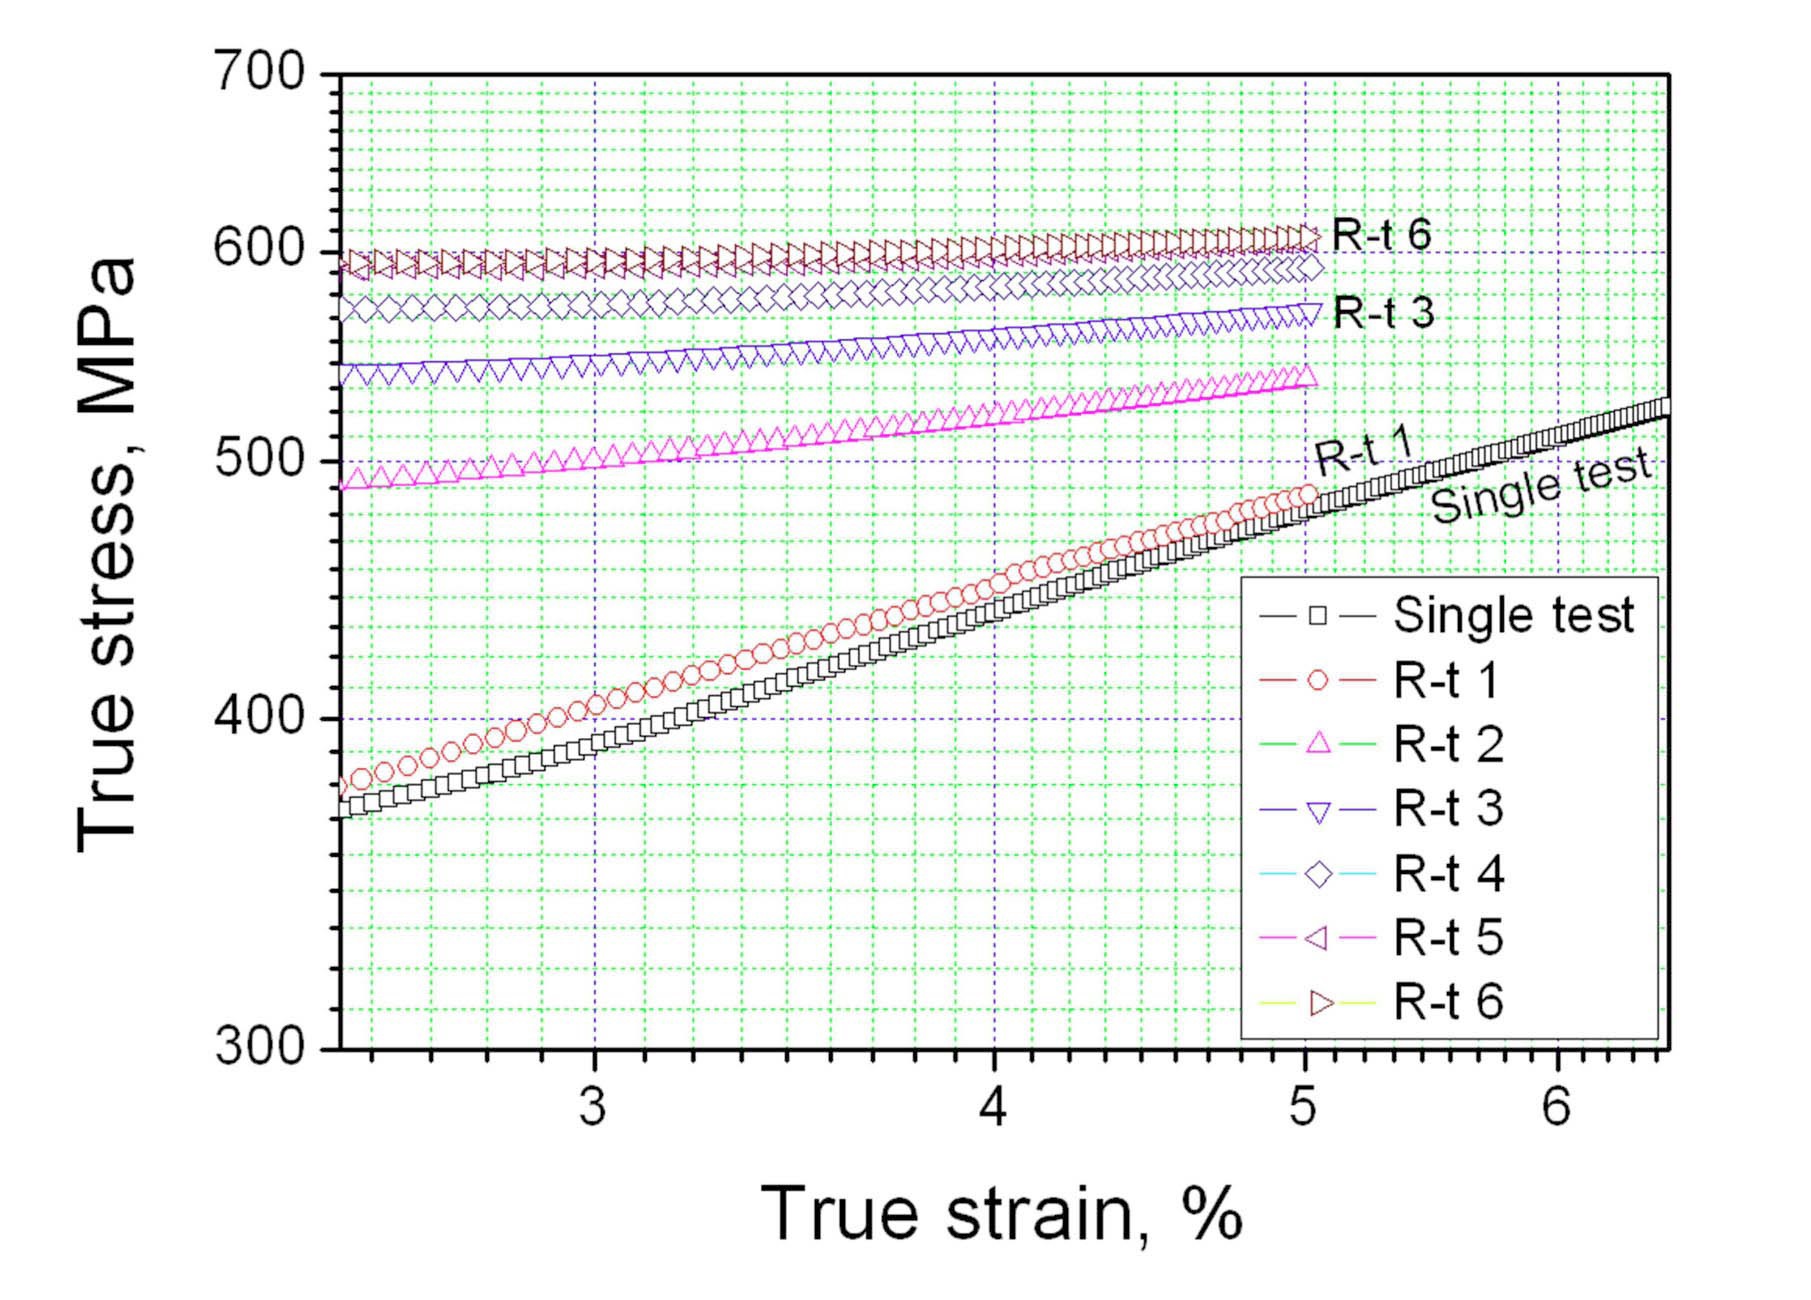
True stress-strain behaviors in both a single tensile test and repeated tensile tests are compared in Fig. 4. In the true stress-strain curves, the strength as a function of strain was increased more than the strength shown in the engineering stress-strain curve results, and the increment of the YS values was moderated with an increase in the repeated test numbers. However, the true stress from YS to the 5% strain region was increased with an increase in the true strain up to the 6th tests, because the area reduction in the gauge section was compensated for in this data. These trends were shown in three types of alloys. The work hardening exponent with the repeated test cycle was calculated based on these data.
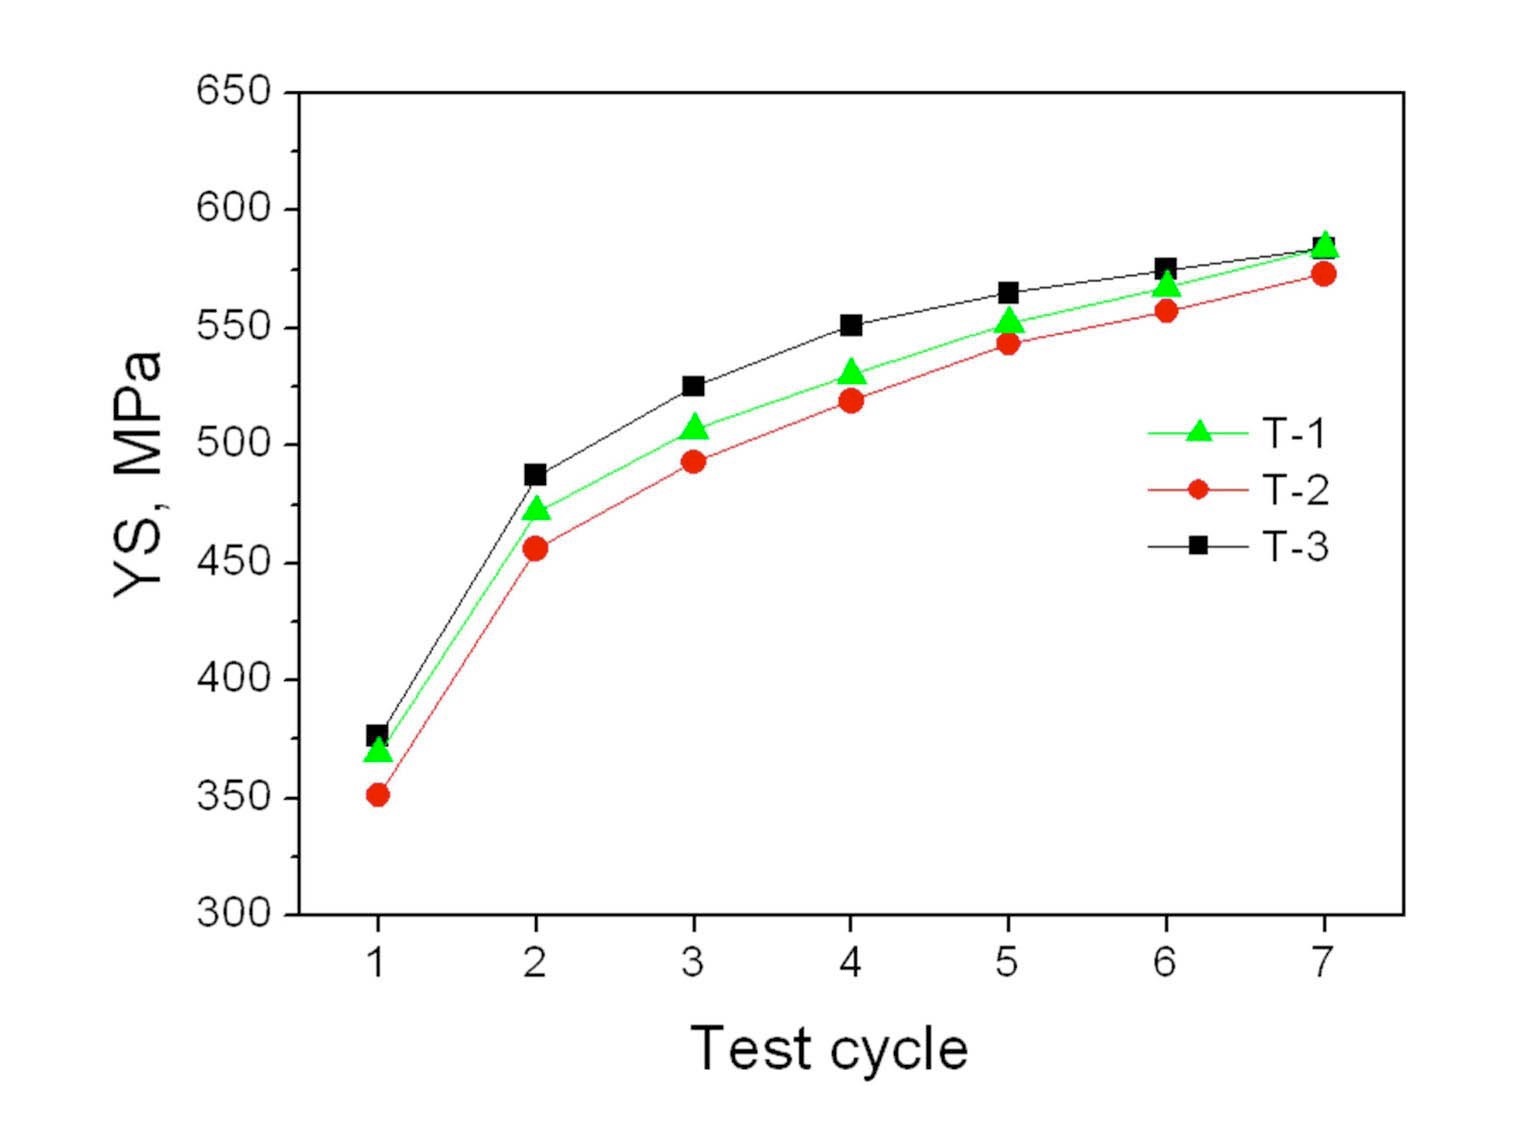
Fig. 5 shows the YS variation of the three types of alloy as a function of the test cycles. This data was averaged for the three times of tensile test results on each alloy. This result can be used to predict the work hardening behavior of the metals because the increased YS result with the repeated tensile test of 5% was caused by accumulated plastic deformation during each tensile test. When compared to the YS variation with the tested alloys, the T-1 and T-2 alloys showed a very similar trend, whereas the T-3 alloy showed a different YS variation. In the T-1 and T-2 alloys, the YS gradually increased with the test cycles. However, the YS in the T-3 alloy was similarly increased up to the 4th cycle, and after the 5th test cycle the YS increment was slightly decreased when compared to the YS of the T-1 and T-2 alloys. The YS was determined by the initial microstructure of the TREX, such as dislocation density, grain size, alloy composition, and texture. Among them, the dislocation density, grain size, and texture of the three alloys were very similar. Thus, it is known that the variation of the YS in Fig. 5 was caused by the alloy composition, which acts on the soluble and SPP (Second Phase Particle)
hardening in zirconium alloys. The higher increase of YS from the 1st test to the 2nd test was caused by the formation of many dislocations in the recrystallized TREX grains. After the 2nd test, the dislocation formation was limited by the accumulation of the dislocation density related to the repeated strain of 5%. In the T-3 alloy, the decrease of the YS increment from the 5th to 8th test when compared to the T-1 and T-2 alloys was related to a higher work hardening effect than the T-1 and T-2 alloys. This means that the dislocation slip of the T-3 alloy was more difficult than that of the T-1 and T-2 alloys after the 5th test cycle.
3.2 Work Hardening Behavior of Tested Alloys
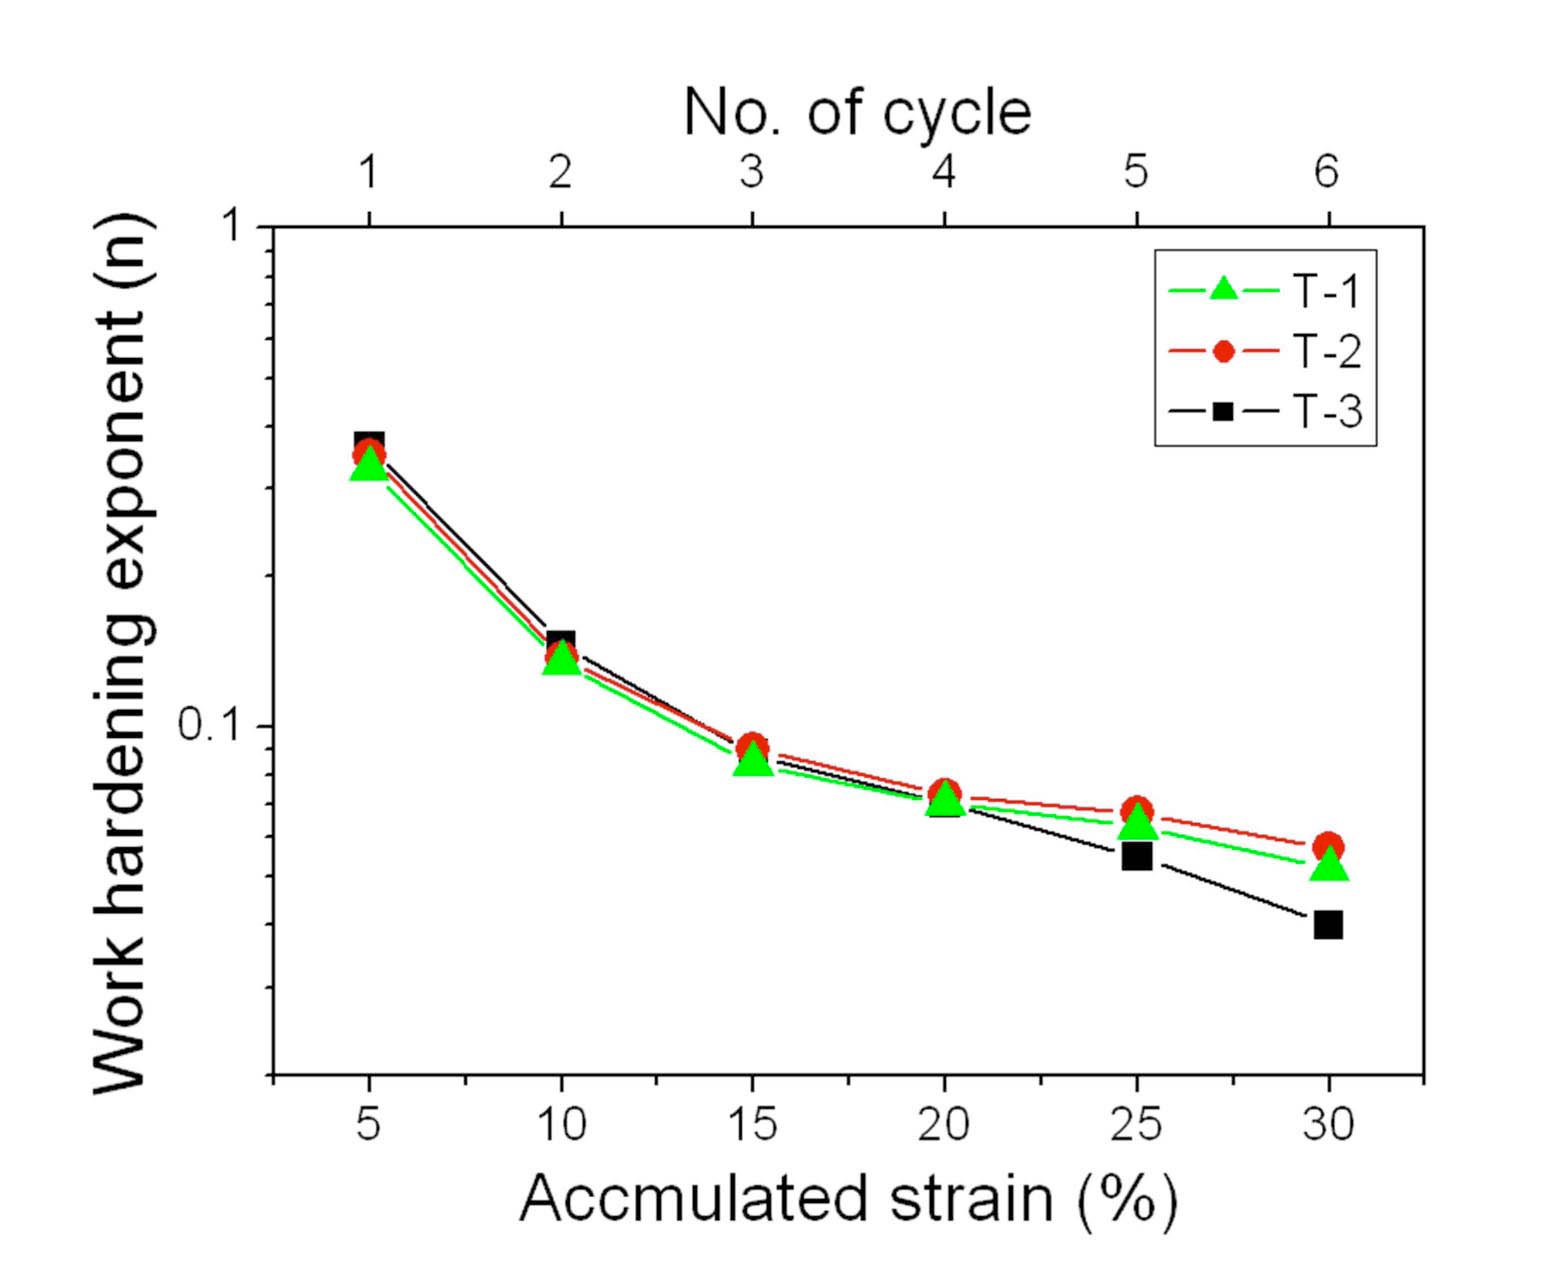
Work hardening is generally evaluated in terms of either the work-hardening rate (ds/de) or the work hardening exponent (n). In this work, the work hardening exponent (n) of the tested alloys was calculated with the test cycles based on the true stress-strain curves, as shown in Fig. 4. The work hardening exponent (n) is known to be a good indicator for the work formability of materials. A material with a higher ‘n’ value is preferred for manufacturing processes which involve plastic deformation [15]. Fig. 6 shows the work hardening exponent variation of tested zirconium base alloys as a function of the accumulated strain. The work hardening exponent was decreased with the accumulated strain, and the trends of this exponent of three alloys were similar up to a 20% strain. However, the work hardening exponent of the T-3 alloy was lower than that of the T-1 and T-2 alloys after the 20% strain by the repeated tensile test. This result corresponds to the YS variation of these alloys. Antoine et al. [16] recognized that all the factors controlling YS will also affect the work hardening exponent (n). In carbon steel, it is reported that the working hardening exponent (n) is linearly decreased with an increase of YS [17]. From this, it can be expected that the work hardening exponent (n) was reduced as an increase of the accumulated strain (i.e. No. of cycle) because the YS was increased with an increase of the accumulated strain. The decrease of the work hardening exponent was related to the increase of the dislocation density in the matrix by the accumulated strain of the tested alloys. From this, it is known that the formability behavior of the T-1 and
T-2 alloys is similar, and that the behavior of the T-3 alloy is decreased after the 20% strain compared to the T-1 and T-2 alloys.
The work hardening behavior is caused by the strengthening of the metal by plastic deformation which is shown as the dislocation formation and movement within the grains, and therefore the ductility of the work-hardened material is decreased. In the pilgering process for manufacturing zirconium tubes, too much work-hardened alloy composition is undesirable because the pilgering process is performed at room temperature and the area reduction is higher than 75%. In the T-3 alloy, the total alloy composition was higher than the others. However the simple comparison for the total alloying element is not matched with the tested alloys in this work and the work hardening behavior. For example, the dislocation movement was affected by the force direction on the slip plane, the amount and types of solute atoms, and the SPP characteristics. Regarding the grain size effect on the materials, the work hardening rate of Al-based alloy was decreased with a decrease in the average grain size [18]. However the work hardening rate in this work was not affected by the grain size and texture since these factors were very similar in the three types of alloy. Thus, the different work hardening behaviors of the three tested alloys were related to the alloy composition effect rather than the texture and grain sizes.
3.3 Microstructural Observation of the Fractured Region
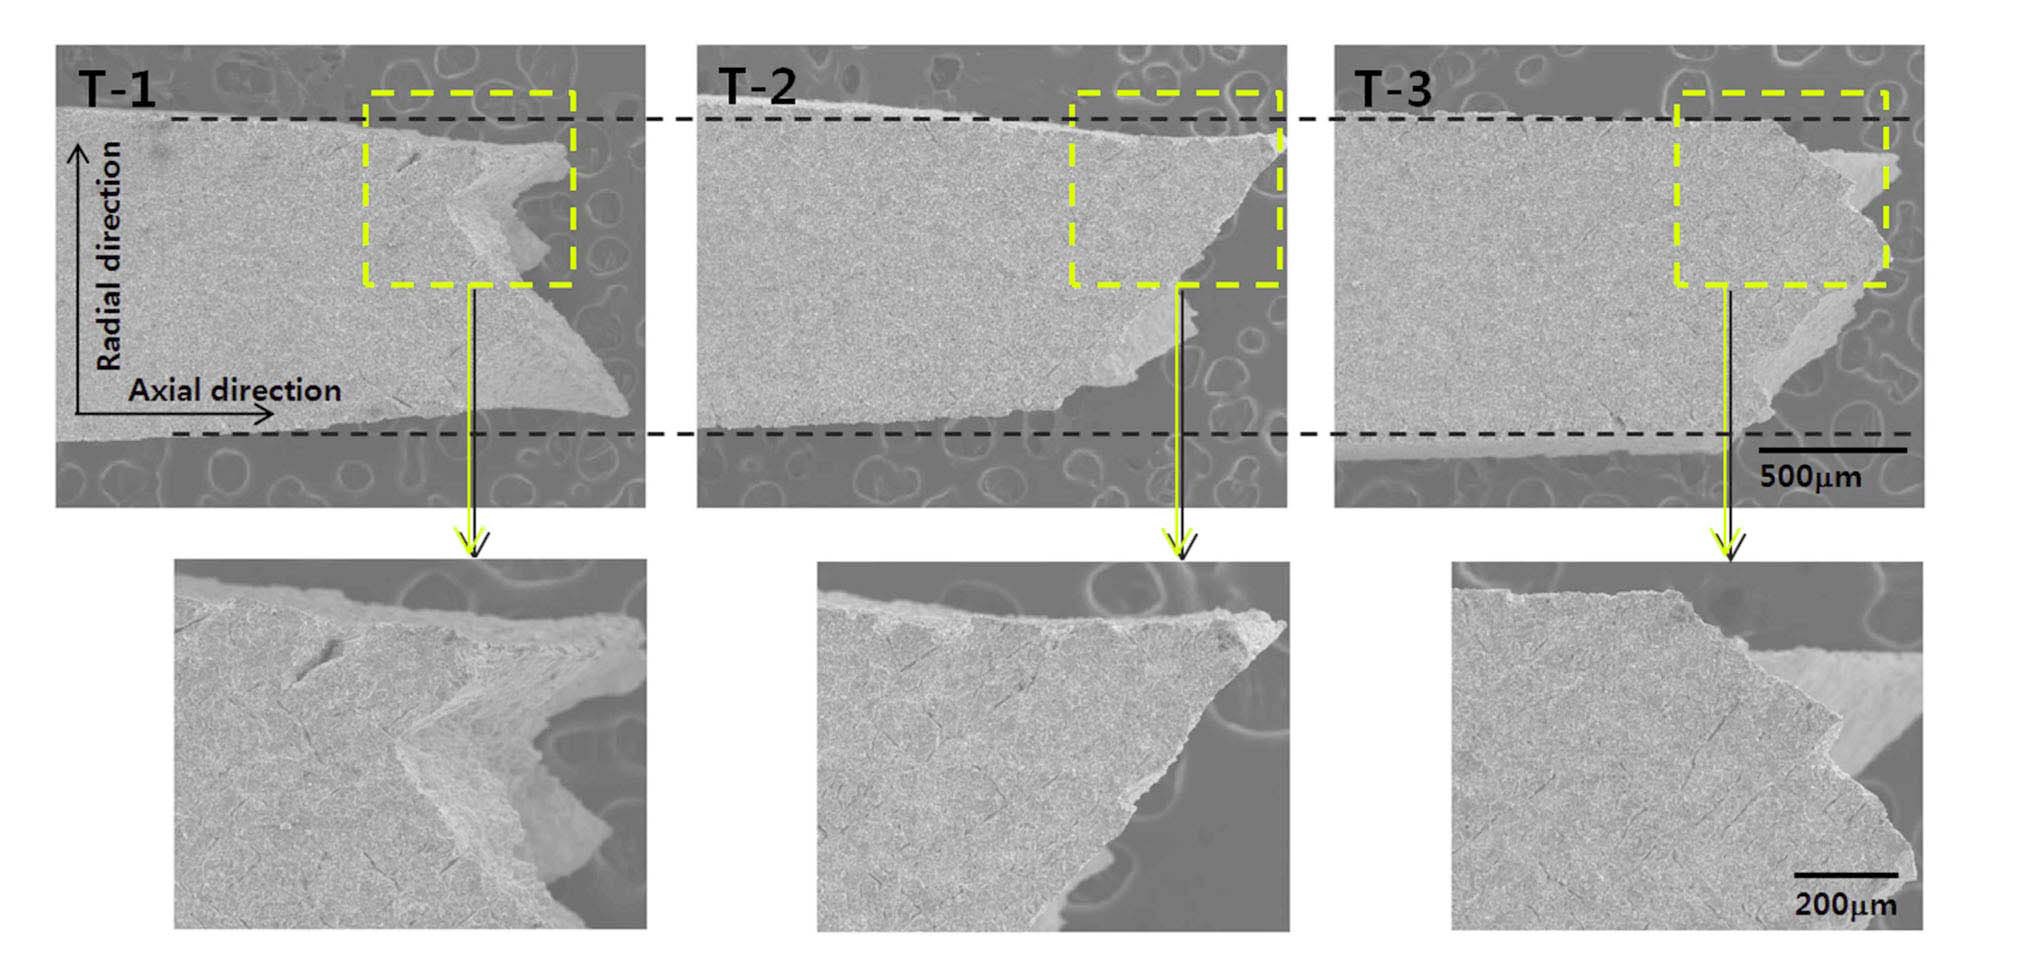
Fig. 7 shows the SEM images for the necking region of the tested alloys. The observation direction of the samples was the circumferential normal plane in the TREX. At the necking point the reduction height of the tensile specimens was different as marked with the dotted line at the top of the figure. The T-1 and T-2 alloys showed a higher deformation than the T-3 alloy. This is matched with the total elongation of each alloy and the work hardening behavior after the repeated tensile test. In ductile materials, such as the T-1 and T-2 alloys, the deformation was increased. The interesting point at the fractured region of the specimens is the surface cracks, which can be identified at high magnification in the pictures below. The angle of the surface cracks was about 45 degrees to the radial and axial direction of the specimens. Thus, it is known that the fracture progressed from the surface cracks in the tensile samples.
To identify the surface crack formation on the tensile samples, the crystallographic relation was considered from the texture analysis results as shown in table 2. Fig. 8 shows the SEM observation results of crack shapes on the sample surface. The upper part showed the circumferential normal plane of the TREX, and the lower part showed the radial normal plane. The cracks observed in the circumferential normal plane were developed to have an angle of 30° and 60° to the axial direction of the TREX, and the cracks observed in the radial normal plane were developed toward the direction parallel to the circumferential direction of the TREX, respectively. After considering the crystallographic relation, which was identified by the XRD texture analysis for the TREX, the crack formation direction was well matched with the major slip plain and direction in the HCP structure of zirconium.
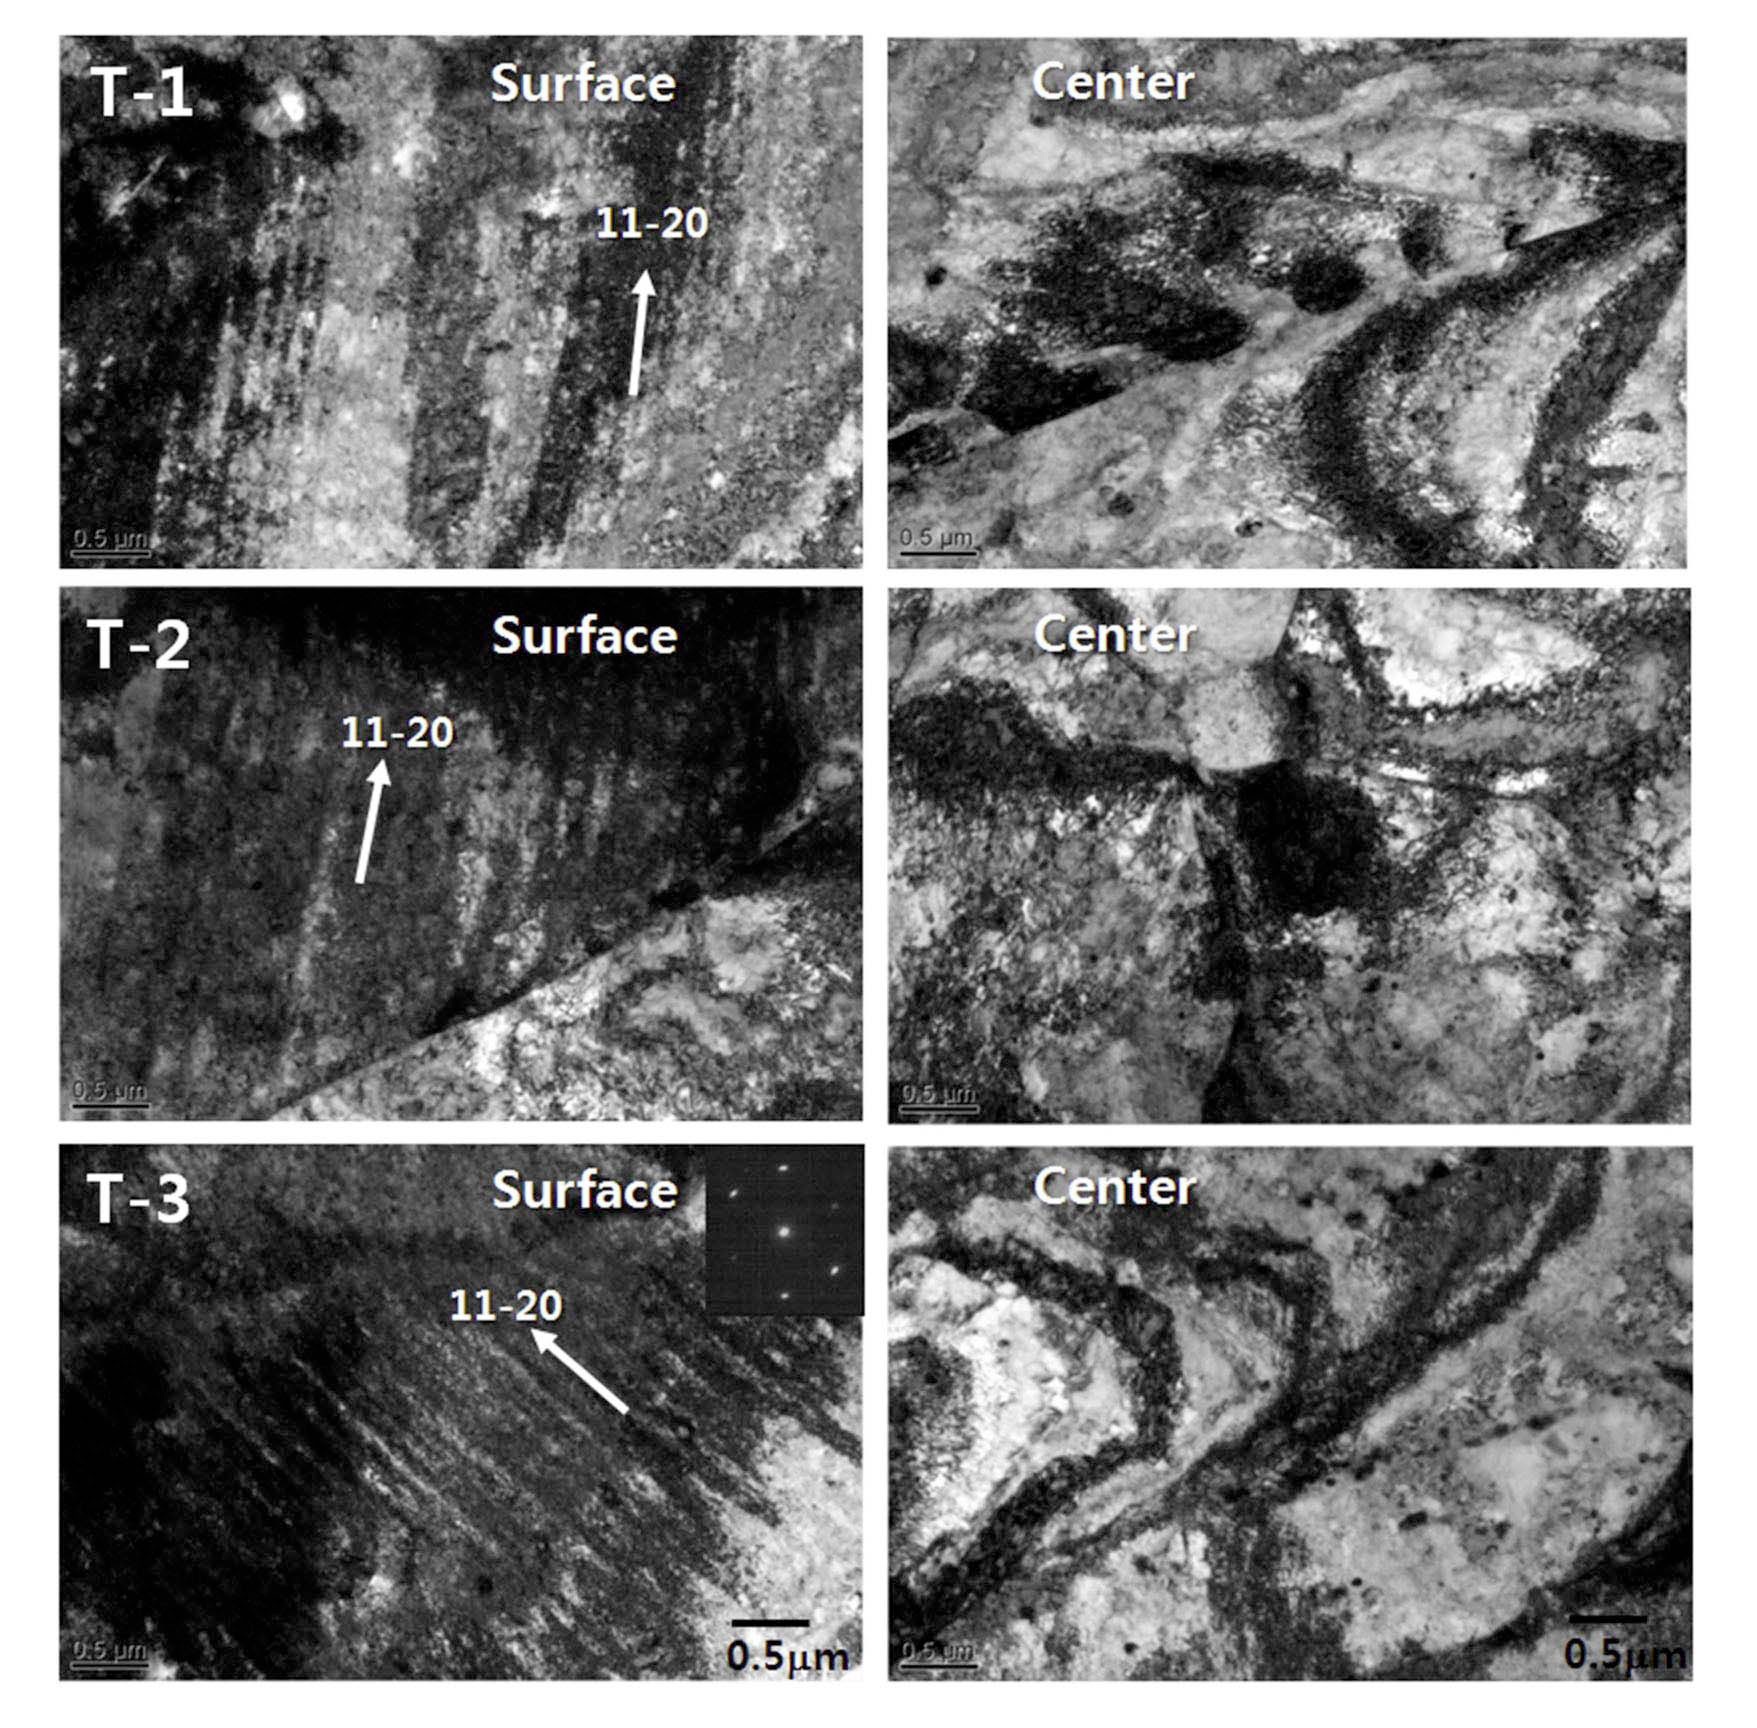
A dislocation structure was observed using the TEM for the repeated-tensile tested samples as shown in Fig. 9. A planar slip with a high dislocation density was shown in the three types of alloys. Although the work hardening behavior for the three tested alloys was differently shown owing to the different alloying composition in this work as shown in Fig. 6, dislocation density and grain size for the three tested alloys were very similar as shown in Fig. 9. It seems quite probable that the grain size was affected by the initial state of grain size of each alloy, and the dislocation density cannot be determined by the TEM observation because the dislocation images were affected by the sample
thickness. Thus, comparison of the dislocation density with the alloy compositions using the TEM micrographs has a lot of uncertainty. However, it is possible that the dislocation glide direction along the HCP slip plane is obtained as shown in Fig. 9, since the crystallographic direction between dislocations and matrix grain can be identified by TEM analysis. From the selected area pattern analysis, the planar slip direction followed the major slip plane of the

directions in the grains, but the twin structure was not observed in all samples. Thus, the twinrelated deformation did not occur by the repeated tensile test. It was clearly observed that the dislocation glide behavior was blocked by the grain boundary; however, the pile-up phenomenon of the dislocations near the second phase particles could not be determined. Thus, it is known that the dislocation movement follows the slip plane, and the surface crack pattern was affected by the dislocation pile-up to the slip plane during the repeated tensile test.
3.4 Consideration of the Work Hardening Behavior of Three Types of Alloys
The present results show that the alloying element is affected by the work hardening behavior of zirconiumbased alloy under repeated tensile deformations. From the YS variation of the tested alloys shown in Fig. 5, the T-3 alloy showed higher YS values than the T-1 and T-2 alloys at the initial state of the TREX, although the grain size was similar in the three types of alloy. Regarding the soluble alloying elements, Sn is a substitutional solid solution element in zirconium, and oxygen is an interstitial solid solution element. These two elements increase the mechanical strength up to their solubility [19]. The elements Nb, Fe, Cr, and Cu make a second phase particle if their contents are larger than their soluble limit in zirconium [19]. Owing to the combination of the soluble and precipitate hardening
of the alloying elements, the YS of the T-3 alloy at the initial state during the tensile tests was higher than the others, as shown in table 1.
The YS of the tested materials is increased by a repeated tensile test of 5%, since dislocations are formed and saturated in the matrix during the plastic deformation, as shown in Fig. 9. The interesting point during the repeated tensile test is that the YS variations of the three types of alloys are inversed after the 6th cycle. Also, the work hardening exponent (n) of the T-3 alloy is more decreased than the other two alloys with repeated test cycles, as shown in Fig. 6. From these results, it can be assumed that the work hardening behavior of the tested alloys is differently shown own to the alloying elements. After considering the alloying element in these alloys affecting the work hardening behavior, Sn was not a critical element because the work hardening behavior of the T-1 and T-2 alloys was similar, and the work hardening behavior of the three kinds of alloys did not vary with Sn content.
However, the trend of work hardening behavior can be explained with the Nb content ranging from 1.0 to 1.5 wt. %, since the Nb effect on the work hardening behavior was seen in the test alloys. It is known that the dislocation movement during the plastic deformation can be inhibited by the SPPs in the matrix. The area fraction of SPP in the T-3 alloy was higher than that of SPP in the T-1 and T-2 alloys as shown in Table 1. Thus, the dislocation movement of the T-3 alloy, which contained a higher SPP fraction than the T-1 and T-2 alloys, is more difficult than the other alloys when increasing the strain by repeated tensile tests, as the moving dislocations can be tangled by the SPPs. For this reason, the work hardening behavior of the T-3 alloy was different from the T-1 and T-2 alloys. Thus, it is recognized that the formability of zirconium-based alloy is considerably affected by the SPP fraction in the matrix.
Repeated tensile tests (5% elongation at each test) were performed at room temperature at a strain rate of 1.7 x 10⁻³ s-1 to evaluate the work hardening behavior of zirconium-based alloys. The three types of alloy showed different yield strengths and work hardening exponent (n) variations with repeated tensile tests, although the microstructure and texture at the initial state of the alloys were similarly controlled. The work hardening behavior of these alloys was affected more by the Nb content than the Sn content. The SPP fraction, which was determined by the Nb content, was considered to be responsible for the work hardening behavior of the tested alloys. Also, the facture mode during the repeated tensile tests followed the slip deformation of the HCP structure of zirconium alloys based on the texture and microstructural analysis.