Porous carbons, which have the collective name of activated carbon, have become more and more attractive materials for use in many adsorption and catalytic processes due to their high adsorptive capacity [1,2]. These carbons are prepared by physical activation (gasification of a char in oxidizing gases), or by chemical activation (carbonization of carbonaceous materials impregnated with chemical reagents). In addition to serving as an adsorbent, high porosity carbons have recently been used in the manufacture of high-performance double layer capacitors and lithium-ion batteries [3-5].
Activated carbon nanofibers (ACNF) are a microporous carbonaceous adsorbent developed from organic precursors either by physical or chemical activation. The advantages of ACNF are smaller fiber diameter (which minimizes diffusion limitations and allows rapid adsorption and desorption), more concentrated pore size distribution, and excellent adsorption capacity at low concentrations, in comparison with conventional activated granular or powdered carbons [6]. Typically, an ACNF is a microporous carbonaceous adsorbent exhibiting slit-shaped pores. This feature is the source of its high adsorption capacity. Factors affecting adsorption type are pore structure, surface chemistry, and adsorbent properties [7-14]. Basically, the type of porosity is mainly determined by the type of precursor employed; however, the method of activation is another parameter which may influence the final pore size distribution [15,16]. The properties of the ACNF are determined by the porous structure and pore surface chemistry, which are influenced by both the nature of the precursors and the method of activation. The methods of activation used to obtain porous carbon can be divided into two types, chemical and physical.
The physical activation method involves carbonization of the raw material and its subsequent activation at high temperature in CO2 or H2O vapor [17-20]. The chemical activation method involves the carbonization of a raw material previously impregnated with a chemical agent. A number of different, well-known chemical agents can be used in the chemical activation process, and among them, activation using KOH and ZnCl2 are two of the most used methods [21,22]. Chemical activation presents both advantages and disadvantages compared to physical activation. The main advantages are higher yield, lower temperature of activation, less activation time and generally, higher development of porosity [16,20]. Among the disadvantages, these activating agents are more expensive (KOH and ZnCl2 vs. CO2 and H2O) and an additional washing stage is also necessary. Moreover, these hydroxides are very corrosive. In fact, physical activation with CO2 or H2O is the usual procedure to obtain ACNF.
The pore structure of the porous carbons will largely depend on the activation methods. In order to make clear the influence of activation methods on pore development of porous carbons, we measured the specific surface areas of all the porous carbons prepared from polyacrylonitrile (PAN) using different activation methods.
Using different activation methods, samples with various porestructures can be obtained. So it is of great importance to investigate the differences in porous structure caused by different activation methods with the aid of adsorption measurement [23]
In this study, we investigated differences in the porous structure of ACNFs prepared from a single precursor (PAN), but by different activation methods including physical and chemical activation; using low-temperature nitrogen adsorption over a wide range of relative pressures.
PAN-based ACNFs with various degrees of activation were prepared in our laboratory using different activation agents (i.e., H2O, CO2, and KOH). The stabilized nanofibers were transferred to a quartz tube (1300 × 127 mm) in a tube furnace for carbonization under nitrogen at 1000℃ for 2 h using the heating rate of 5℃/min.
2.1.1. KOH activation
Chemical activation of the CNFs was performed using KOH as the chemical reagent. The CNFs were immersed in each KOH solution (4 M) respectively for 30 min. The mixture was dried at 80℃ for 12 h, before heating at 5℃/min under N2 (200 mL/min) to a selected temperature (850℃), using the apparatus and procedure described for chemical activation; with a reaction time of 30 min. To remove the potassium, hydrochloric acid (0.5 M) was added to the mixture for 30 min, before filtering and washing with distilled water until the pH of the filtrate reached pH 6. The CNFs were dried at 100℃ for 24 h.
2.1.2. CO2 activation
CO2 activation was performed in the same quartz tube with the carbonization. The CNFs were heated (5℃/min) to the required reaction temperature (1000℃) under N2 (500 mL/min), before the N2 was switched to CO2 (500 mL/min) for a reaction time of 1 h. The sample was then allowed to cool under N2 (500 mL/min).
2.1.3. H2O activation
For H2O activation, a stainless steel tube with fixed amount of steam-feed was used. All other conditions were same as that for CO2 activation. The CNFs were heated (5℃/min) to the required reaction temperature (900℃) under N2 (500 mL/min), before the N2 was switched to H2O (2 g/min) for a reaction time of 1 h. The sample was then allowed to cool under N2 (500 mL/min).
Nitrogen adsorption isotherms of CNFs and their activated forms were measured with BELSORP-max (BEL JAPAN, Japan) at liquid nitrogen temperature. All samples were degassed at 300℃ for 6 h prior to the measurements. The specific surface area was calculated in the relative pressure interval of 0.04-0.2 using the Brunauer-Emmett-Teller (BET) method [24]. Pore size and distribution were calculated by the Barrett-Joyner-Halenda (BJH) method from desorption curves [25]. Microstructural differences between pure CNF and ACNF were determined using a wide-angle X-ray diffractometer (WAXRD), employing a Rigaku SmartLab X-ray diffractor with a customized automount and a Cu Kα radiation source. Diffraction patterns were collected within the diffraction angles from 10° to 90° with a speed of 2°/min. The morphology and diameter of the CNF, ACNF- KOH, ACNF-CO2, ACNF-H2O, and PAN precursor nanofibers, and their stabilized and carbonized nanofiber forms, were explored using a field emission scanning electron microscope (JSM 6701-F, JEOL, Japan). In order to reduce charging during scanning electron microscopy (SEM) imaging, samples were first placed on a sample holder and coated with platinum. Diameter distributions of the nanofibers were determined measuring 50 nanofibers from different regions of each SEM image.
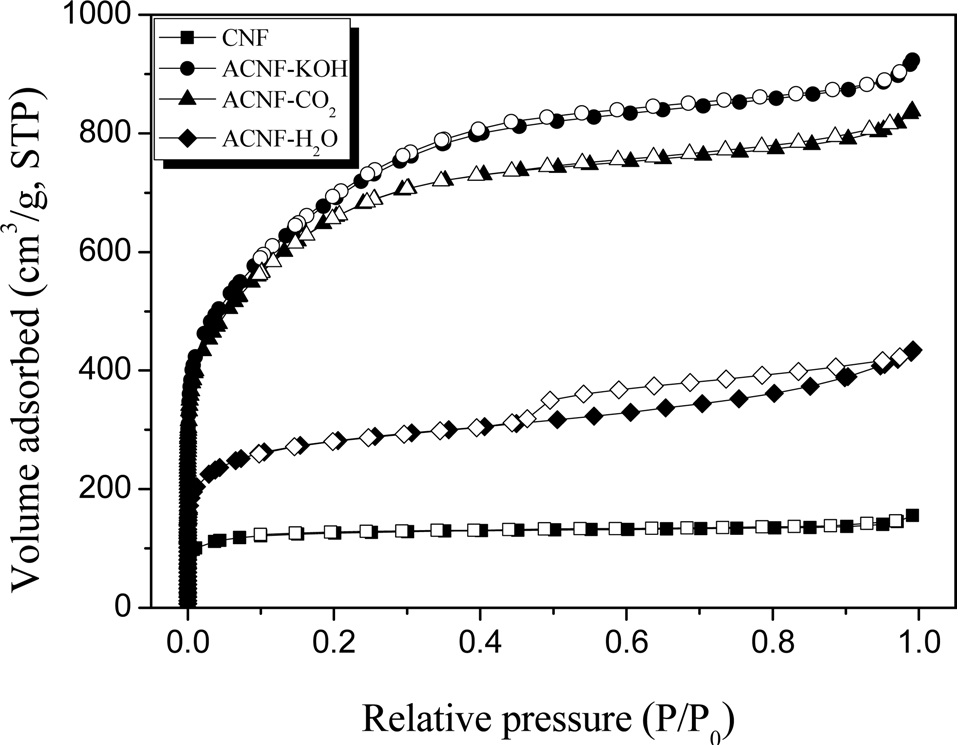
In order to gain an understanding on the influence of activation methods on the pore structure of ACNFs, the porous structure of various carbons had to be determined. Fig. 1 shows the typical N2 adsorption/desorption isotherms for all the ACNFs prepared in this work. There are six kinds of adsorption isotherm according to the International Union of Pure and Applied Chemistry (IUPAC) classification, and each is indicated by a distinct pore structure. Because the adsorption isotherms of N2 at 77 K contain a large amount of information related to pore structure, and because changes in them imply alteration of pore structures, their measurements are the basis from which to estimate the pore-structure parameters. Every curve is classified as type I by the IUPAC classification. However, there are differences in pore-structures between the samples. Each graph has a point of inflection called a ‘knee’ around P/P0 (0.1). This point indicates that monolayer adsorption is complete, so it is possible to calculate specific surface area at this point using the BET equation. Over P/P0 (0.1), the adsorbed volume was increased predominantly, which means that there are also mesopores on CNFs.
Typically, treatments for chemical activation require lower temperatures than for physical activation, to cause the precursor to develop an equal amount of new porosity. In this paper, 850℃ was selected as the treatment temperature for KOH activation. It confirmed by the N2 adsorption/desorption isotherms (Fig. 1). It resembles the IUPAC type I isotherm indicating micropore domination inside the material. In KOH activated samples, micropores
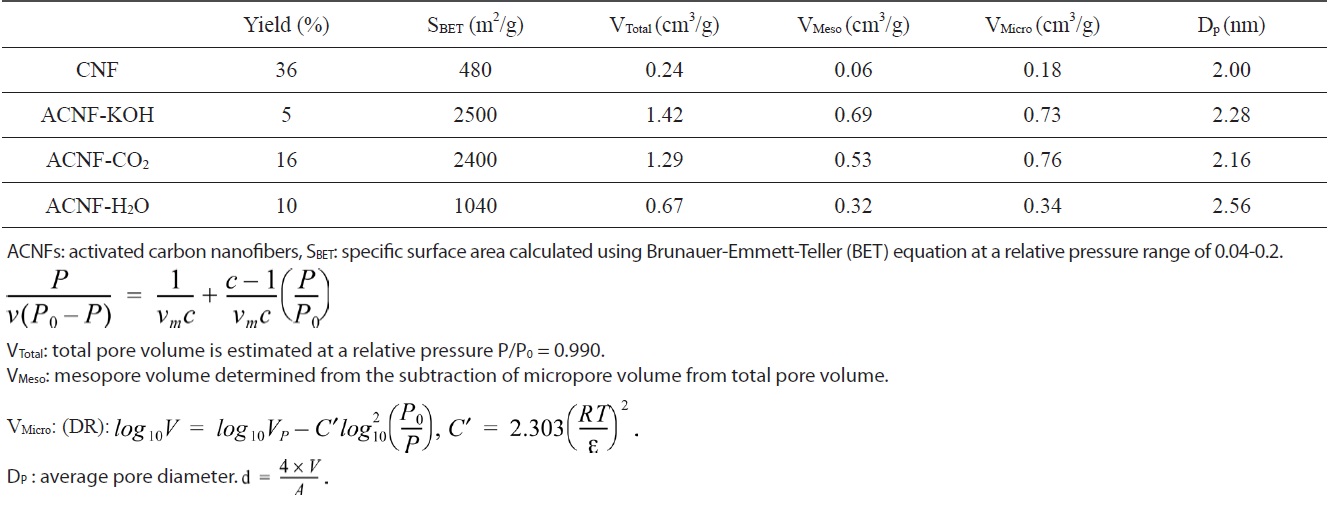
[Table 1.] Textural properties of ACNFs as a function of activation method

Textural properties of ACNFs as a function of activation method
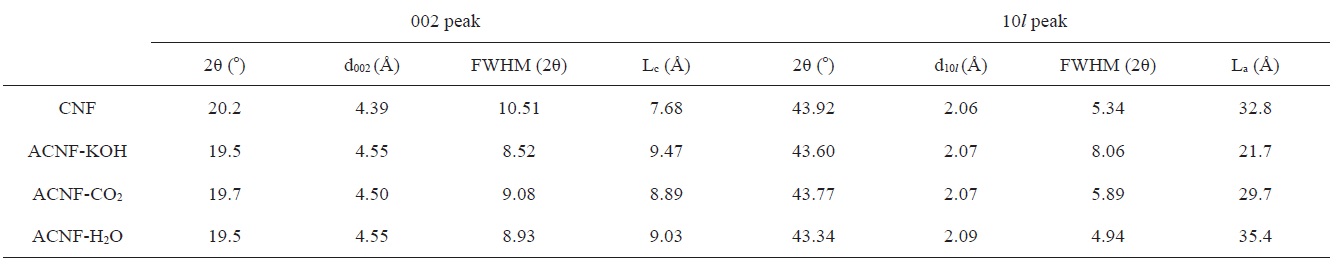
[Table 2.] Structural parameters of the ACNFs as a function of activation method

Structural parameters of the ACNFs as a function of activation method
cropores made up more than 51% of the total porosity.
In general, activation using physical methods requires high temperatures to develop sufficient internal porosity. In this paper, 900 and 1000℃ heat treatments were chosen to use with CO2 and H2O activation. Normally, CO2 activation produces activated carbon with well- developed micro-porosity. This characteristic is observable from the nitrogen isotherms (Fig. 1) as they resemble the IUPAC type I isotherm indicating micropore domination inside the material. The development of mesoporosity is also observable from the increase of the slope of nitrogen adsorption isotherm curve in the large P/Po region, and the appearance of desorption hysteresis. The textural properties summary of the CO2 activated samples is provided in Table 1. In the CO2 activated samples, micropores amounted to more than 59% of the total porosity.
Meanwhile, H2O activation produced highly mesopore-rich activated carbons. It is interesting to note that H2O-activated samples showed clear hysteresis in the desorption curve. It indicates that largely developed pores in H2O-activated CNF are pot-like structures.
The yield of porous carbons varies according to different activation methods for PAN. It can be seen from Table 1 that CO2 provided higher yields of porous carbon than other methods. Compared with CO2 activation, in the same activation time, H2O activation provided both inferior porosity development and lower yield.
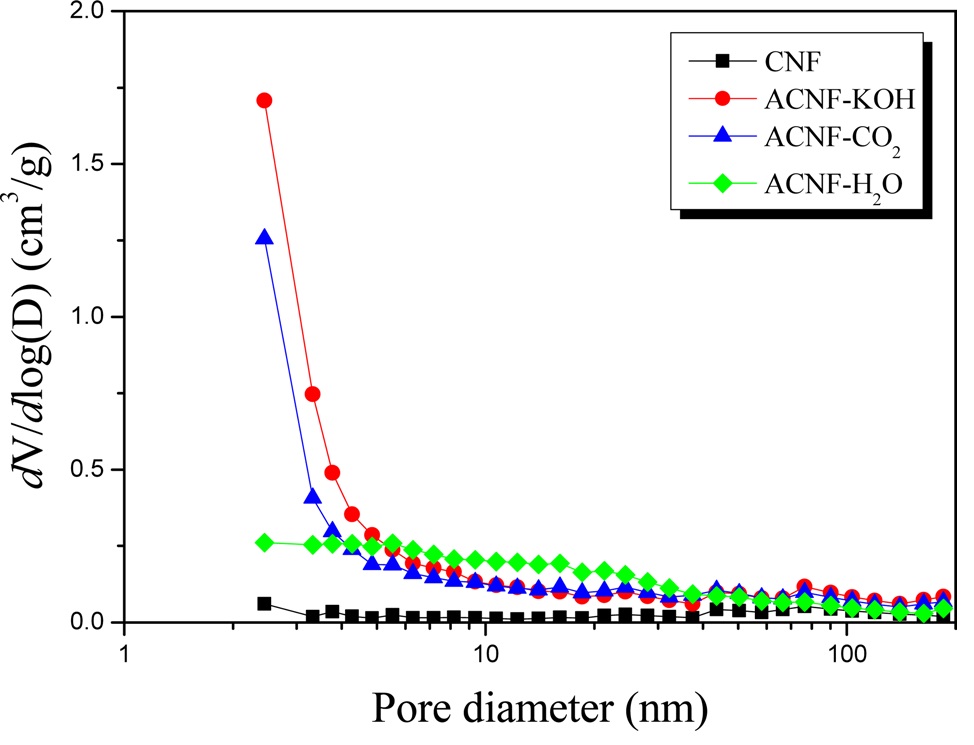
The BJH method was used for determination of pore size distribution.
Integrating the data of the desorption isotherm with the computation of pore size, 1.7-300 nm mesopore pore-sizedistribution of prepared activated carbon was calculated by the BJH theory. Fig. 2 illustrates the variation of BJH accumulation pore volume and differential pore volume of prepared ACNFs followed by transitional pore diameters. It can be seen, from from ACNF-KOH and ACNF-CO2, that BJH accumulation pore volume and differential pore volume decreased gradually with an increase in pore diameter, and whereafter the curve tended to be a level when the pore diameter exceeded 10 nm. ACNF-KOH and ACNF-CO2 exhibited complex pore systems consisting of not only the particular pores around 1.8 nm, but also a large number of other-sized pores in a wide range from 1-10 nm.
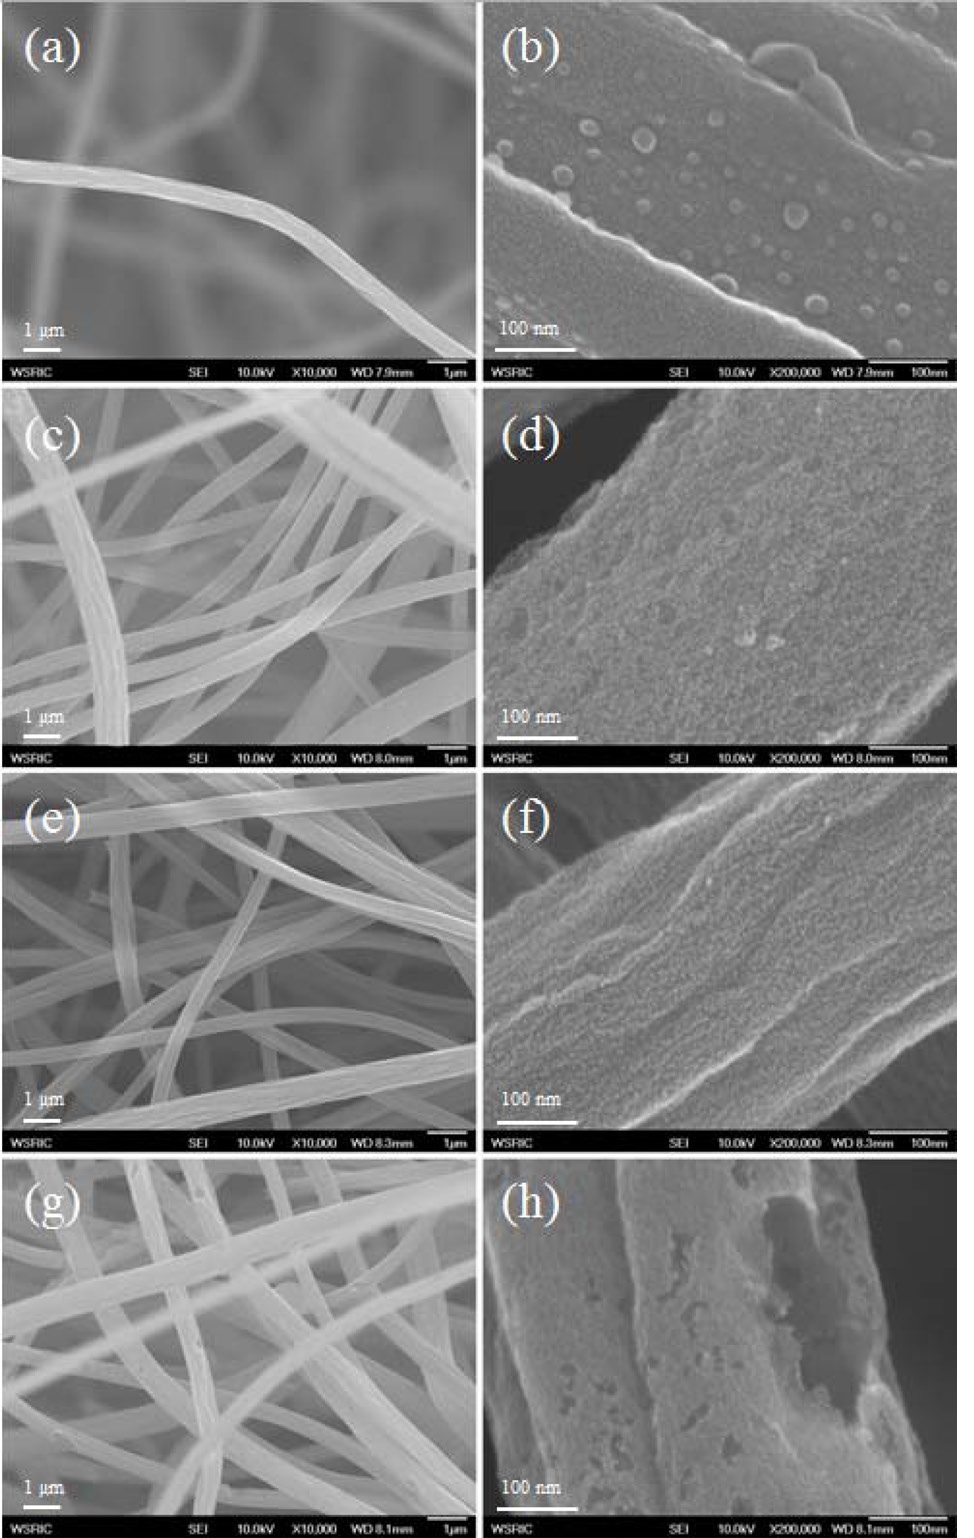
The microstructures of the prepared CNFs and ACNFs are shown in Fig. 3. For the CNFs, the surface was typically very smooth, without any pores, but with some uneven surfaces. After KOH impregnation and activation at 850℃ under N2 atmosphere, the surface of ACNF-KOH became rough and many pores appeared on it. Small pores, transitional pores, and large pores of different shapes are shown in this micrograph. It was reported that KOH impregnation had important effect by increasing the specific surface area and by generation of micropores. In Fig. 3, the KOHactivated fibers display a lot of holes, seen even in the SEM image, but these were not visible on the physically activated fibers.
SEM images of all types of ACNFs are shown in Fig. 3, which shows the pores and cracks on the surface developed due to activation. The average pore size of ACNF-CO2, ACNF-KOH, and ACNF-H2O increased in this order.
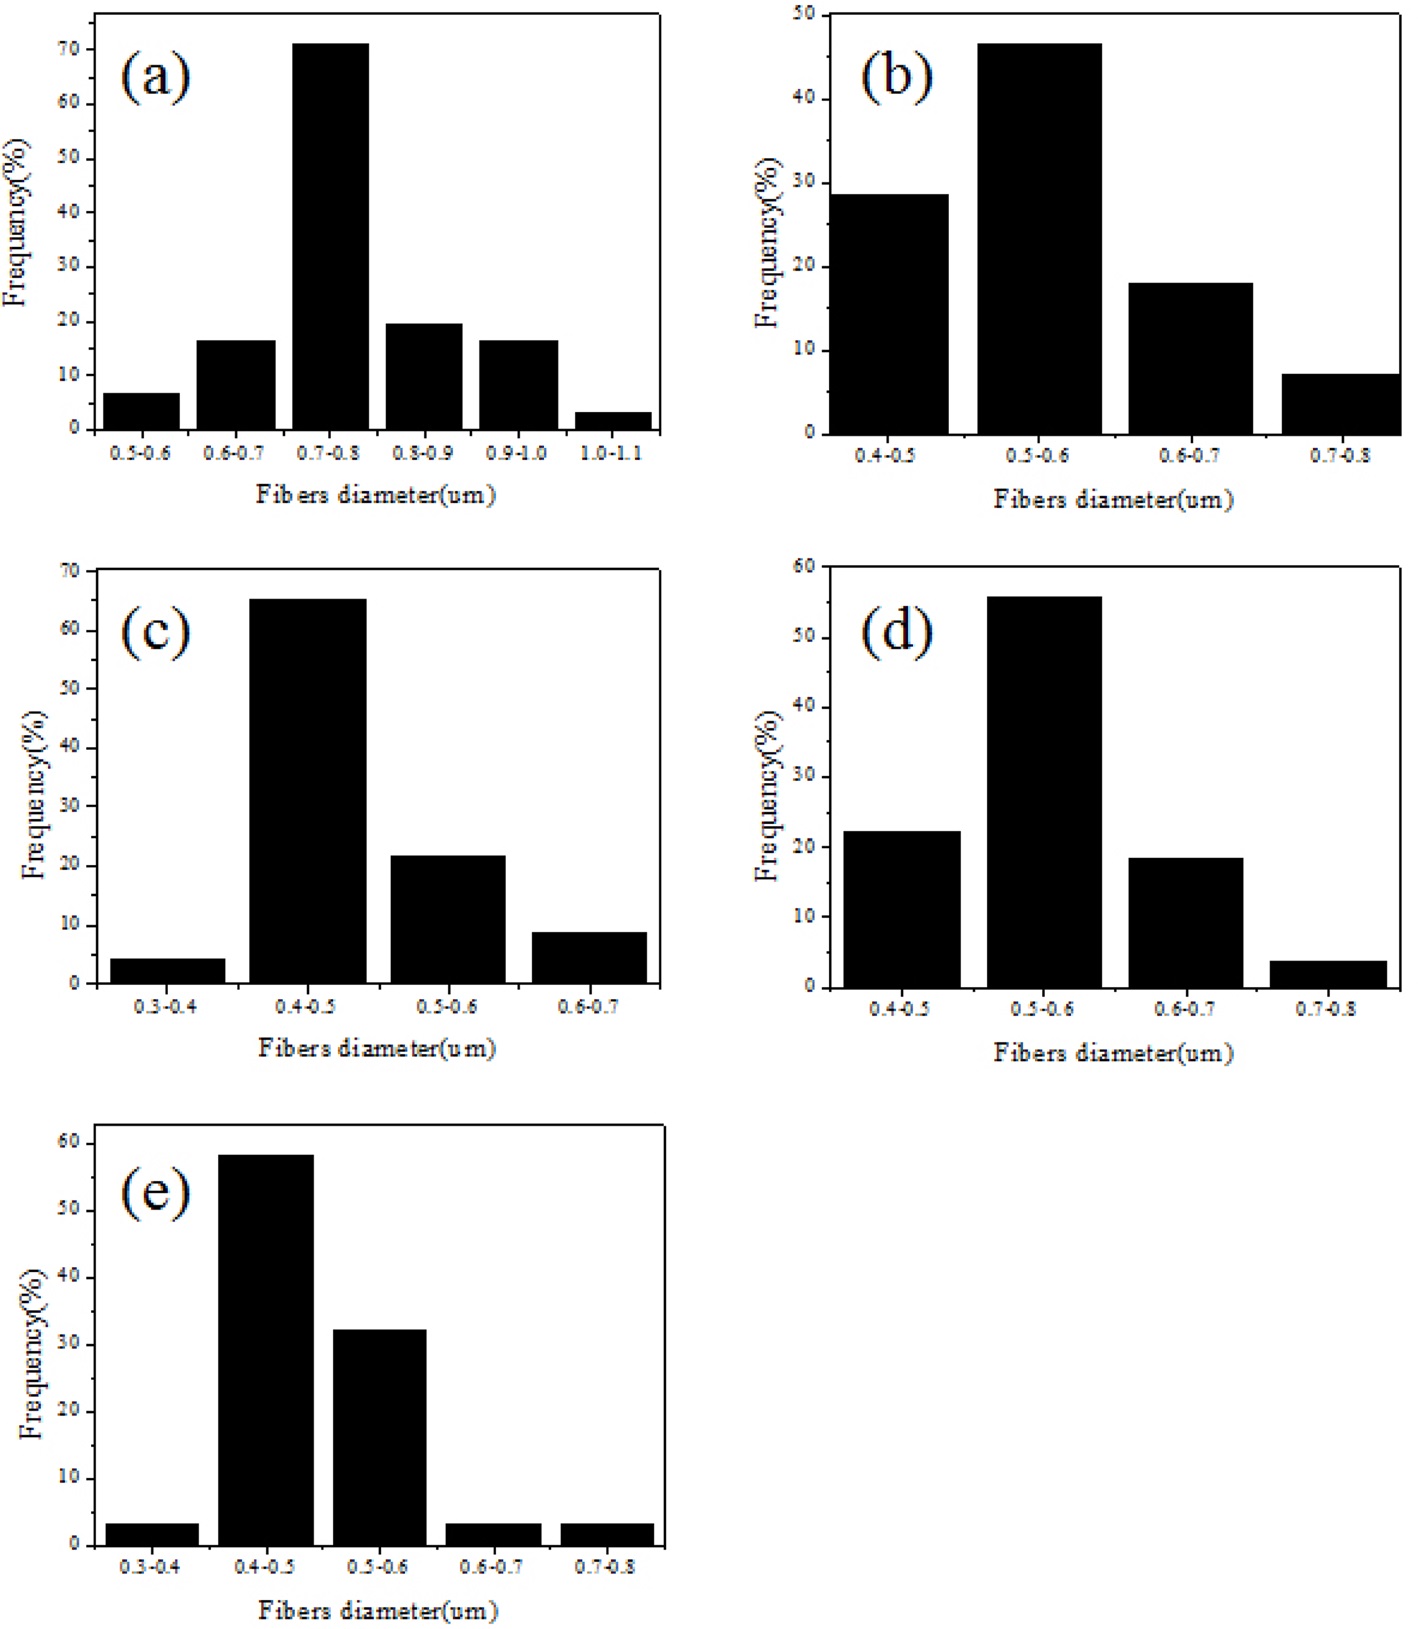
The average diameters of the ACNFs obtained from this experiment were estimated by ImageJ software (JEOL, Japan); installed in the SEM apparatus. As can be seen in Fig. 4, the PAN-nanofiber diameter is relatively uniform (700-800 nm). The diameters of the PAN nanofibers decreased slightly during carbonization and activation. The average diameter of the CNF samples was about 800 nm. After activation, the average diameter of ACNFs considerably decreased. In the case of KOH and H2O activation, the average diameter of the ACNFs had a range from 300 to 400 nm, and for CO2 activation, the diameters showed the size from 400 to 500 nm.
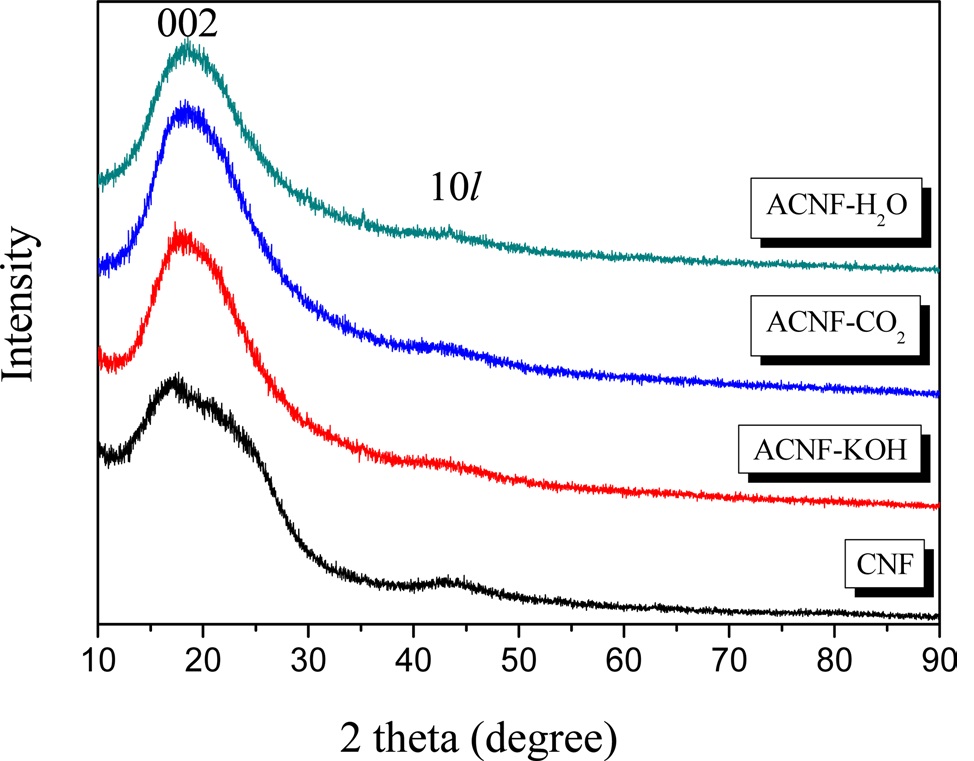
The XRD patterns of the ACNFs prepared by different activation methods using Cu Kα radiation are shown in Fig. 5. ACNFs are usually amorphous carbon composed of random microcrystalline carbon fragments. Generally, they are composed of three kinds: graphite-like microcrystals, single-reticular-plane carbon and non-organized carbon. These ACNFs exhibit very broad diffraction peaks and the absence of a sharp peak reveals a predominantly amorphous structure. Thus, the ACNF obtained can be identified as carbon with an amorphous structure. There are massive microcrystals with turbostratic graphite structure in the prepared ACNFs. The two obvious diffraction peaks represent, respectively, the diffraction-characteristic peaks of the microcrystalline (002) and (10l) crystal face of the turbostratic graphite structure of the ACNF. It can also be seen from Fig. 5, in the diffraction spectrum of the ACNF prepared during this work, its microcrystalline (002) crystal face appears at 2θ = 19.5°, 19.7°, while for commercial ACNF, the microcrystalline (002) crystal face appears at 2θ = 20.2°. That is to say, the diffraction angle of (002) the crystal face of ACNF is smaller than that of CNF. From the Bragg equation (2dsin θ = nλ), we can see that plane
spacing d (002) of the diffraction crystal face (002) for ACNF is relatively larger, indicating that the turbostratic degree of the experimental ACNF is relatively apparent.
ACNFs with surface area around 1000-2500 m2/g have been produced from PAN by activation with CO2, H2O and KOH. Carbonization was conducted at 1000℃ for 2 h in nitrogen gas. ACNFs were prepared by electrospinning to get high specific surface area and pore volume during various kinds of activation. The average diameter of as-spun PAN nanofibers was observed to be in the range of 700 to 800 nm, and it changed to the size in the range of 500-600 nm after carbonization. After activation, the average diameters of all ACNFs are considerably decreased. In the case of activation by KOH and H2O, the average diameter of ACNFs had a range from 300 to 400 nm; with 400 to 500 nm for those from CO2 activation. Textural properties containing specific surface area and pore volume of the ACNFs showed different features. In the cases of KOH and CO2 activation, specific surface area was over 2400 m2/g and micropore volume was greater than 0.7 cc/g. However, ACNF activated by H2O showed 1000 m2/g of specific surface area with the highest mesopore volume fraction.