Much research has been conducted for the unsteady flow around an oscillating airfoil. The main flow characteristics are vortex shedding of the wake, dynamic stall phenomenon, thrust generation of the insect and the whales, lift and thrust generation of MAV. The early stages, theoretical and experimental studies have shown that a certain combination of oscillation frequency and amplitude generates the thrust on the airfoil. Major motion characteristics of the oscillating airfoil are divided into pitch oscillation due to the changes of pitch angle, plunging oscillation due to vertical movement, and flapping oscillation which is the motion combining pitch angle and plunging motion. Each of these oscillations has been analyzed separately due to the complex characteristics of flow. Major factors that affect the flow characteristics are the Reynolds number, frequency, and trailing edge oscillation amplitude [1,2].
The Knoller & Benz effect was discovered in the early 1990s, in which the flapping airfoil generates aerodynamic thrust force [1,2]. Birnbaum[3] introduced the reduced frequency k that can characterize the flight efficiency using the linear potential theory, and identified that the vortex shedding in the trailing edge is an important factor. Garrick [4] conducted research to obtain the thrust and propulsive efficiency through a certain combination of oscillation frequency and amplitude, using the potential flow analysis. Jone, et al. [5] and Lai & Platzer [6] numerically studied that the wake may appear either as Karman vortex street or as reversed Karman vortex street depending on the frequency and the amplitude of plunging airfoil, and drag or thrust is generated respectively. Taylor et al. [7] discovered the range of Strouhal number by analyzing the flapping cycle and the amplitude through various experiments on insects. Young & Lai [8] showed that, depending on the reduced frequency at low Reynolds number, the aerodynamic characteristics appear differently according to the leading and the trailing edge separation. Rival & Tropea [9] demonstrated that the reduced frequency is a major variable in the pure pitching and the pure plunging flow through a dynamic stall process at low Reynolds numbers. Moryossef & Levy [10] performed a study of the ground effect of the oscillating airfoil, and showed that it has more impact at a low reduced frequency and the phase angle of lift is quite different from the case in free stream. Lai et al. [1] summed up all the studies conducted so far, which range from pure plunging to complex flapping flow.
Most studies focused on the analysis of basic wake characteristics by frequency and amplitude at a low angle of attack. However, this study aims to the pressure and acoustic wave propagation characteristics around the pure plunging airfoil at high angle of attack. The Navier-Stokes equation was used with the LES turbulence model for the governing equation [11,12]. A high-resolution numerical method of Optimized High-Order Compact (OHOC) scheme was used for the numerical method [13] and the 4th-order Runge-Kutta technique was used for the time derivatives. Using the OHOC, it was possible to simulate the acoustic wave propagation characteristics, as well as the wake vortex shedding and the pressure wave propagation process.
The flow around oscillating NACA0012 airfoil was analyzed for the angle of attack of 10°~50° at the Mach number of 0.3 and Re=105. The plunging frequency is from 0.05 to 0.15 and the amplitude is from 0.1 to 0.2. According to the frequency analysis of lift coefficients, the flow characteristics are determined by the principal oscillation frequencies due to the forced plunging oscillation and the large separated flow on the airfoil surface.
2. The Governing Equations and the Numerical Methods
The two-dimensional unsteady compressible Navier- Stokes equation non-dimensionalized in the generalized coordinates was used, as in equation (1).
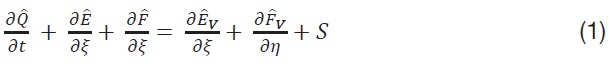
where

Non-dimensional parameters are chord length (L), freestream velocity(U) and freestream density(ρ). The characters of t, ξ and η represent time and generalized coordinates.

is a non- dimensional flux vector that has transformed in the generalized coordinates,
represent the nonviscous flux vectors and the viscous flux vectors in each direction. The mesh movements were considered in the conversion matrices for the oscillating airfoil. S denotes the terms of geometric conservation law for a high order scheme.
In order to maintain high order and high resolution for the time derivatives, Runge-Kutta’s 4th order scheme was used. For the space derivatives, 4th-order accuracy OHOC (Optimized High-Order Compact) scheme was used [13]. The tri- or penta-diagonal matrix based on 7 points was used to obtain the derivatives of each physical property, as in equation (2). Due to the characteristics of central difference scheme, there occurred truncation and phase errors. In order to minimize such errors,

It is possible to achieve a high resolution for space with the OHOC scheme, but it is impossible to exactly reproduce the characteristics of the wave propagation, as with the upwind scheme. The dissipation and diffusion errors are generated due to the characteristics of central difference scheme. They significantly affect the numerical stability. The adaptive nonlinear artificial dissipation model proposed by Kim and Lee [13] was used to enhance numerical stability.
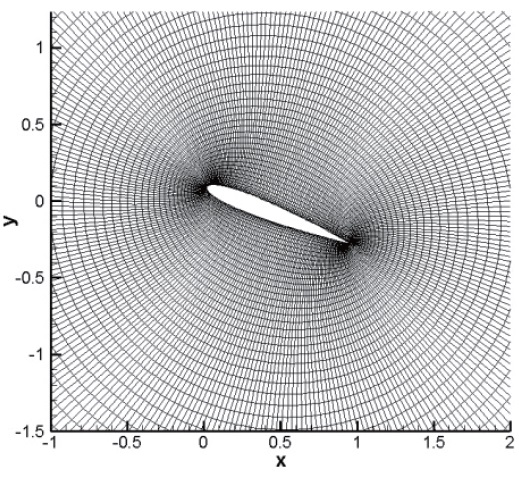
We used O-type meshes concentrated around the airfoil where the changes of flow properties are expected to be large. The number of 280x91meshes shown in Fig.1 was used, based on the computational tests of several mesh
systems. The meshes were moved with the moving airfoil surface within the zone of 20 times the chord length of airfoil by algebraic computation. The fixed meshes were used in other zone of 40 times the chord length.
When acoustic waves reach the boundary surface at subsonic flow, physical and non-physical reflected waves are generated. While passing through the boundary, the physical reflected waves have long wavelength but they do not affect numerical stability. However, the non-physical reflected waves have short wavelength and they generate unnecessary numerical instability due to the numerical derivatives at the boundary. These cause numerical instability in the entire computational domain. Particularly, when the turbulent flow or vortices pass through the boundary, highly nonphysical reflected waves occur. Generally, in order to inhibit
non-physical reflection that occurs at the boundary, inflow and outflow conditions according to the eigenvalues are used. However, the characteristic boundary conditions are not sufficient to inhibit non-physical reflection. In this study, the zonal characteristic boundary conditions proposed by Sandberg
The results have been compared to that of other studies for the flow around a stationary circular cylinder and NACA0012 airfoil to verify the calculations. The results calculated by the same numerical method for the flow around a stationary circular cylinder were compared to other results in Kim and Kim[15]. Its contents briefly are summarized as follows. The flow conditions are Mach number of 0.3 and Re=103. The Strouhal number (
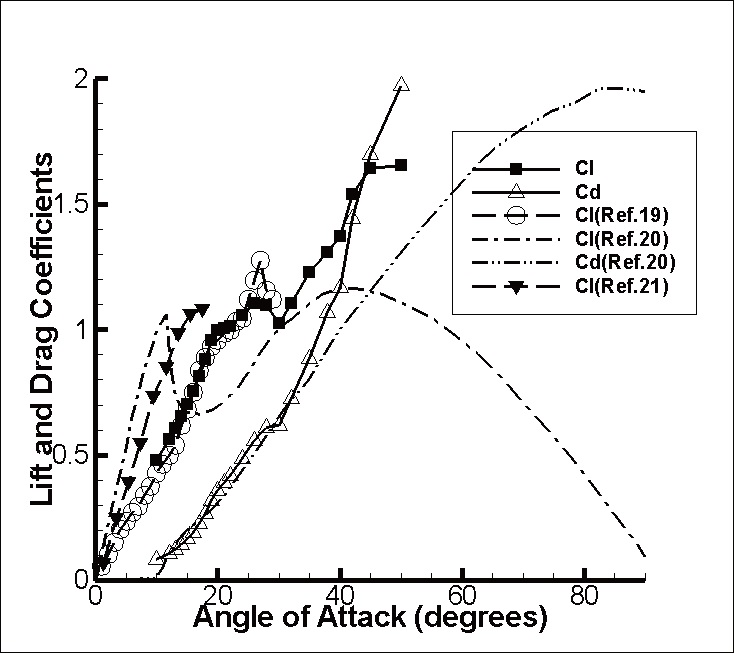
The flow around NACA0012 airfoil was analyzed for the angle of attack of 10°~50° in the flow condition of Mach number of 0.3 and Re=105. For this flow, the results calculated by the present numerical method were compared to other results in Yoo and Kim[18]. The comparison can be summarized as follows. The flow of the steady state free stream develops into a periodic unsteady flow due to the
generation of the vortex on the surface of the airfoil through the initial transient process, depending on the angle of attack. The mean lift and drag coefficients are compared with other calculations and experimental data in Fig. 3 to verify the calculations. The coefficients are very similar to those of other data at an angle of attack less than 25° before dynamic stall occurs. Though the lift coefficients differ from each other, the angle of attack where dynamic stall occurs is very similar. The calculated results were compared to the numerical results by Liu,
to have simulated the flow characteristics well.
The calculation cases to show the flow characteristics by the plunging oscillation are Mach number of 0.3, Reynolds number of 1.0x10⁵, and the mean angle of attack of 20° to 50°. The airfoil position was applied as
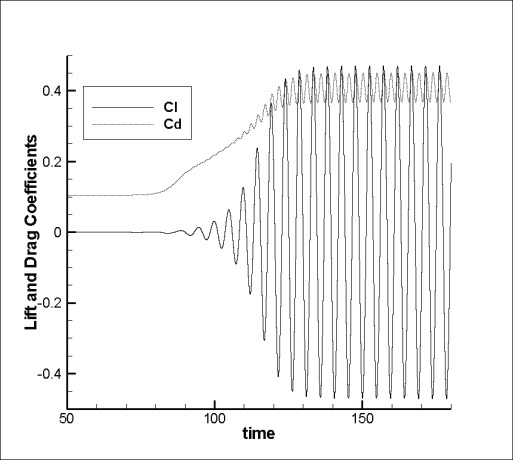
Variations of the lift and drag coefficients over time are shown in Fig. 4, when the amplitude
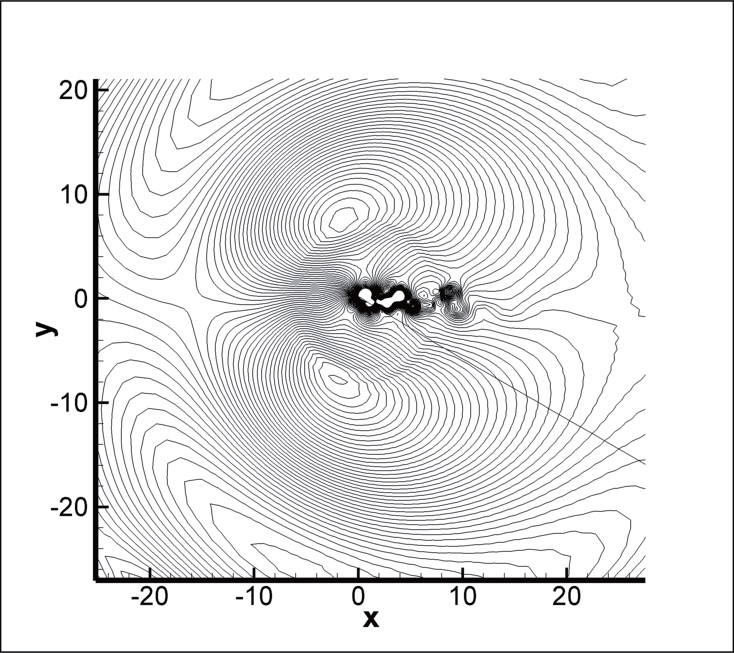
as shown in entropy distribution. The last is pressure waves generated by Karman vortex shedding in the trailing edge.
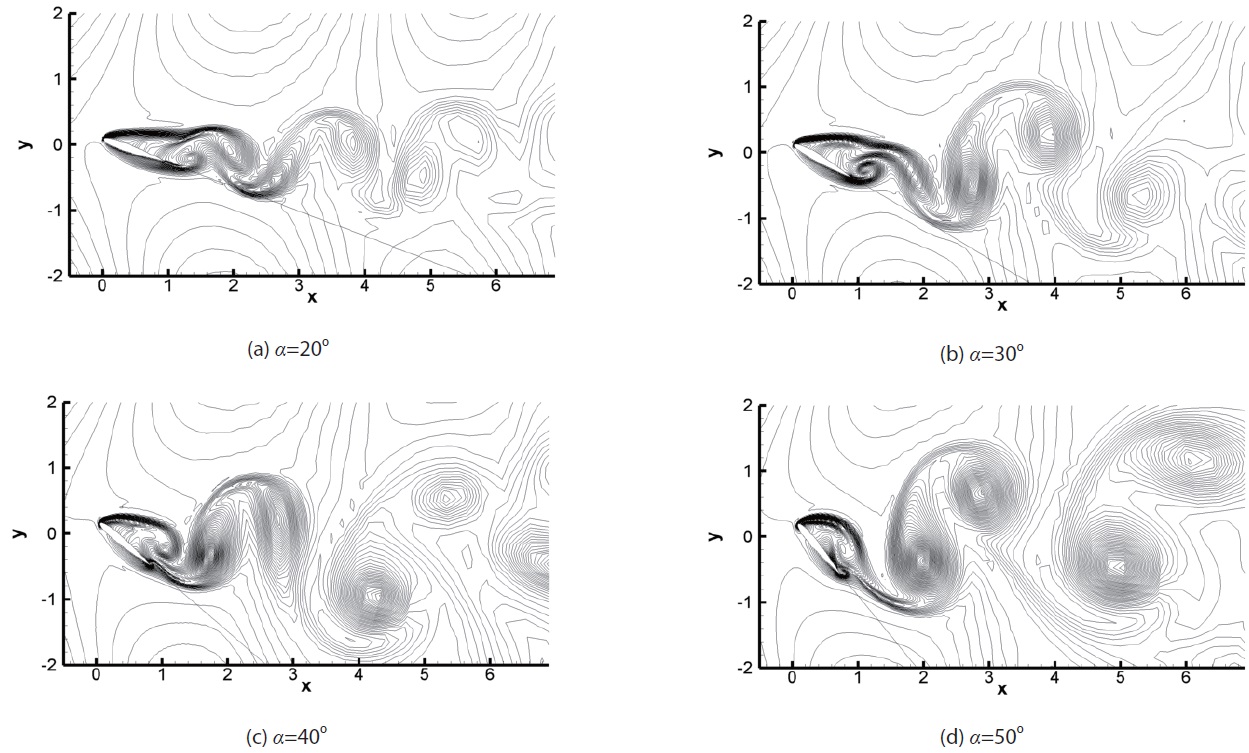
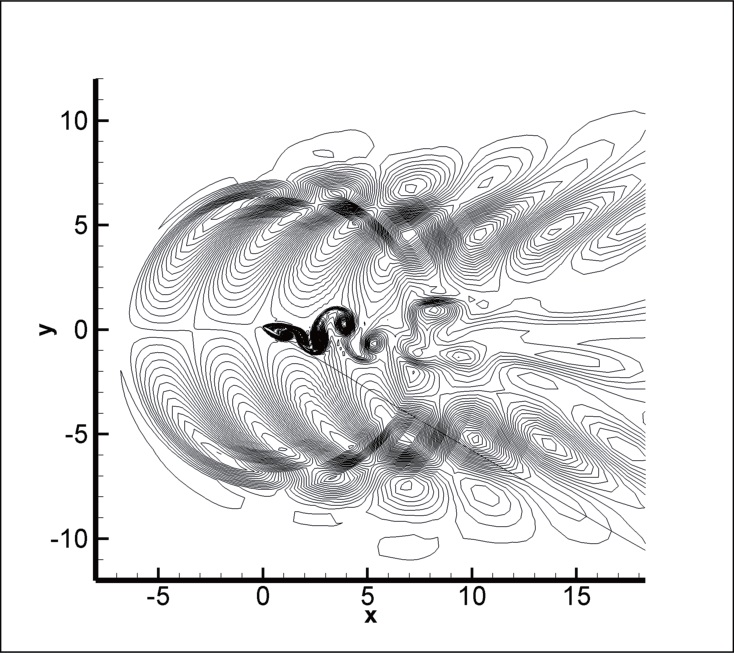
Figs.7 shows an instantaneous distribution of the entropy for the cases of
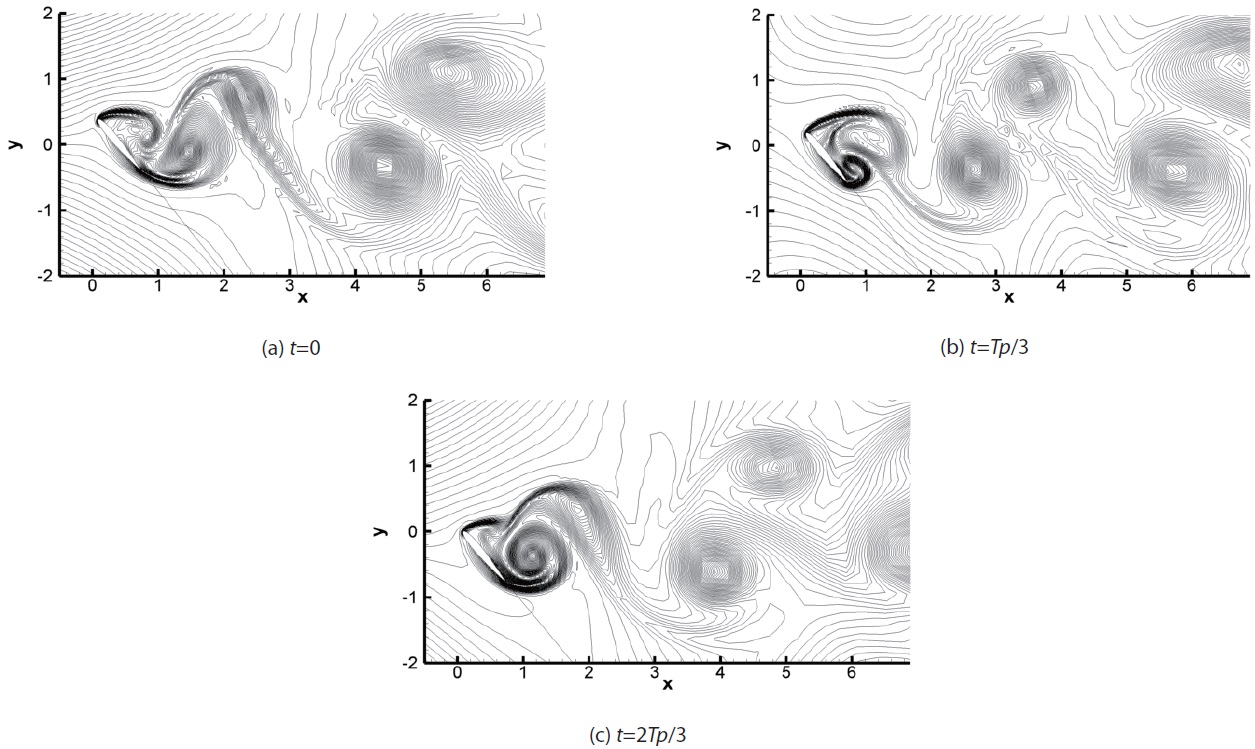
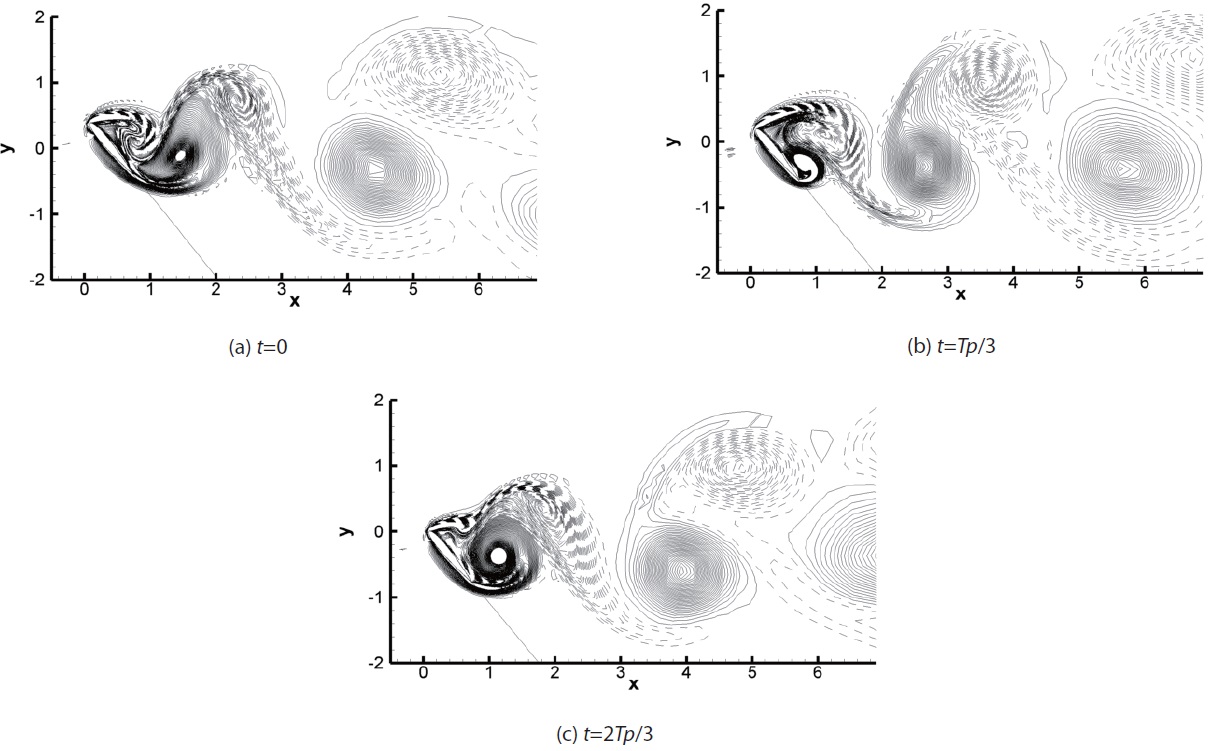
with the increase of angle of attack. Figs.8 and 9 show the entropy and the vorticity distributions during one cycle for the case of
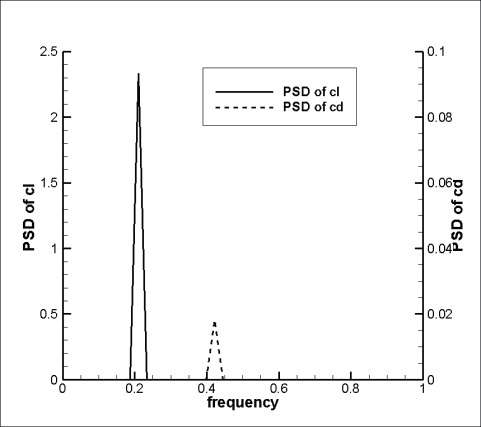
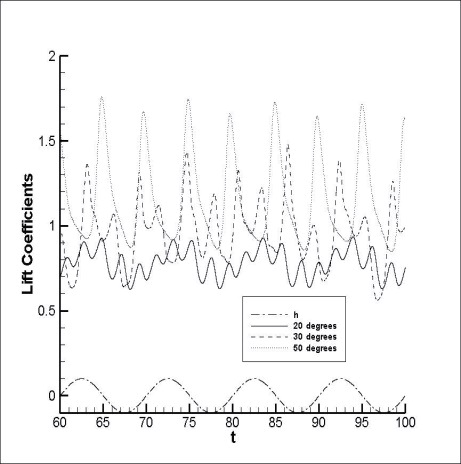
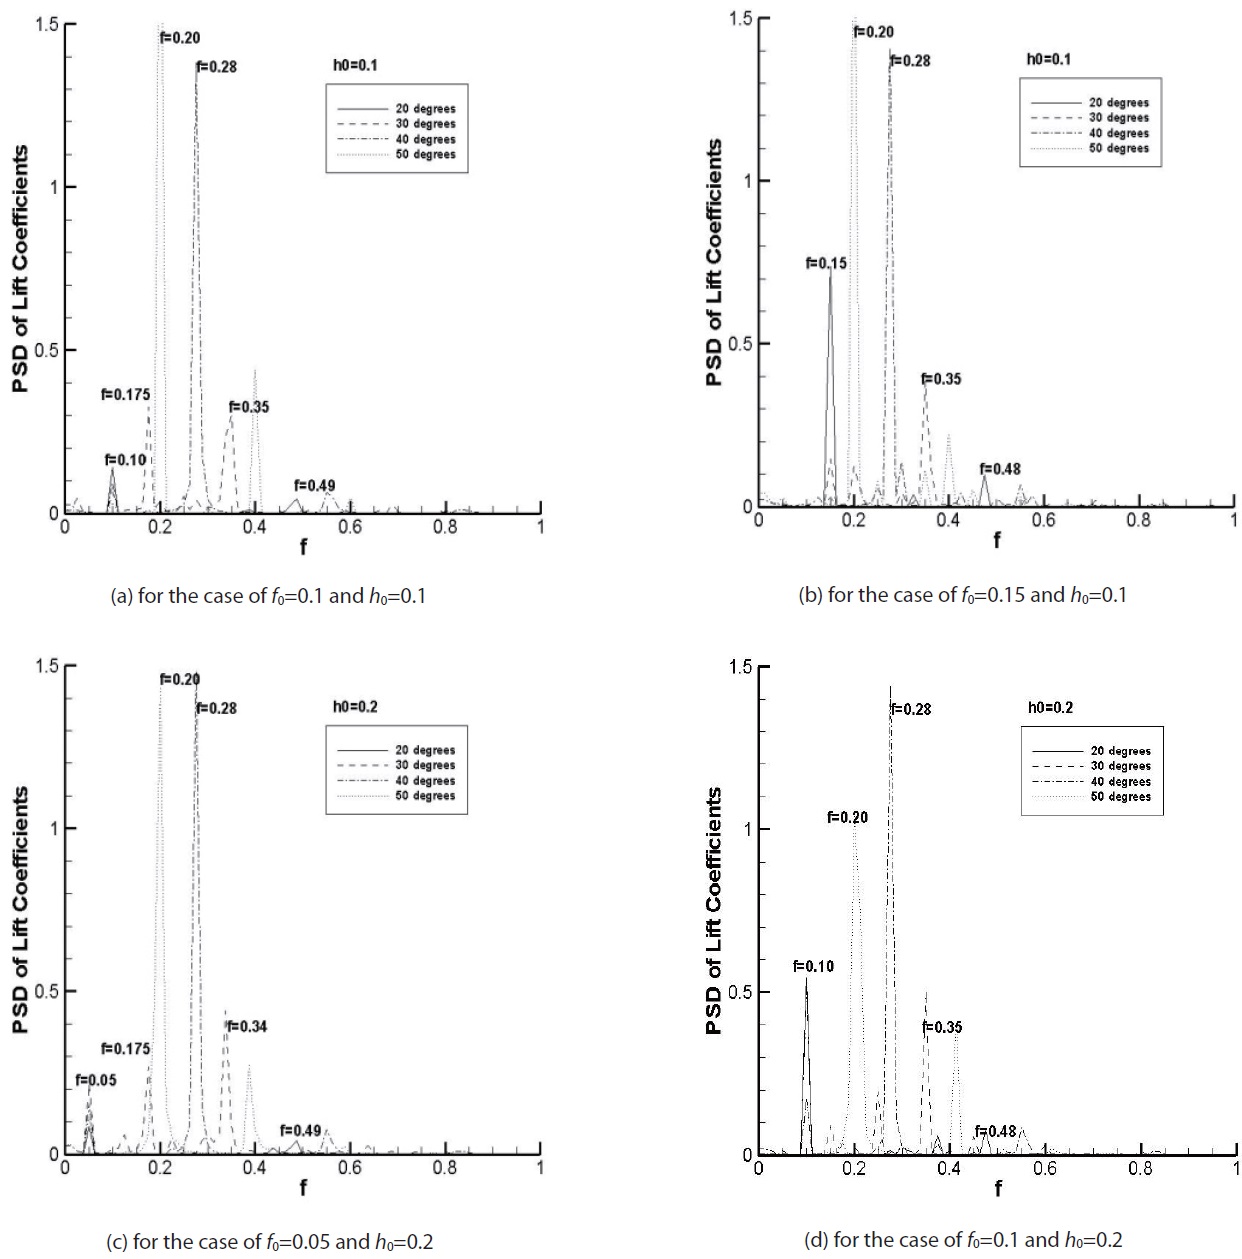
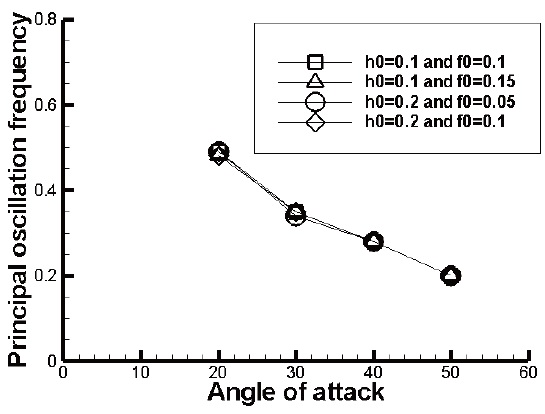
The frequency characteristics were analyzed for the lift coefficient. In Figs.10, the PSD distributions of lift coefficients are plotted for several cases of oscillation frequencies and amplitudes. According to the results shown in Fig.4, the principal oscillation frequency occurs due to the forced vibration and the angle of attack. The high frequency appears at low angle of attack while the low frequency appears at high angle of attack. The figures show the principal oscillation frequencies depending on the angle of attack, irrespective of the forced oscillation frequency and the amplitude. When the angle of attack is 30°, the principal oscillation frequencies appear with similar intensities at the frequencies of
cell flowed to a similar position. The distances between the vortex cells are similar to each other. This means that the principal oscillation frequency is similar to each other, as
Fig. 11 confirms.
Navier-Stokes equations with the LES turbulence model were calculated by the high-order high-resolution numerical scheme, termed the OHOC scheme, to analyze the plunging motion characteristics at a high angle of attack. The vortex shedding characteristics occurring in the wake were also analyzed, along with the characteristics of the wave propagating to the whole area, using a highresolution numerical scheme. The flow due to the plunging oscillation at high angle of attack has the characteristics of the waves generated by the plunging motion and vortex shedding. The periodic characteristics of the large separated flow on the airfoil surface are simple at the higher angle of attack but become complex at the lower angle of attack under dynamic stall. Using the frequency analysis of lift coefficients, the flow characteristics are determined by the principal oscillation frequencies due to the forced plunging oscillation and the separated flow. Irrespective of the forced oscillation frequency and the amplitude, the principal oscillation frequency according to the angle of attack is uniform.