A liquid crystal display (LCD) utilizes the white light emitted uniformly from the backlight unit that consists of the white LEDs, lightguide, and optical sheets [1]. The backlight plays important roles in LCDs that affects the brightness, angular luminance profile, and the image quality [2]. The poor color gamut and the poor brightness uniformity of the backlight result directly in the poor image quality and the poor brightness uniformity of the LCD, respectively [3-5]. Although the white light emitted from the white LEDs is well controlled with sufficient color gamut, the color nonuniformity occurs due to the wavelength-dependent scattering such as the Rayleigh scattering during propagation through the lightguide because there are fine scattering patterns on the bottom surface of the lightguide. As the white light that enters into the lightguide propagates it is scattered from the bottom scattering patterns, the blue light is scattered more than the red light in the near region from the white LEDs and so the chromaticity distribution tends to be bluish in the near region and reddish in the far region from the white LEDs [6]. This causes the nonuniformity of the chromaticity uniformity of the backlight. Typically, the tolerable chromaticity difference is
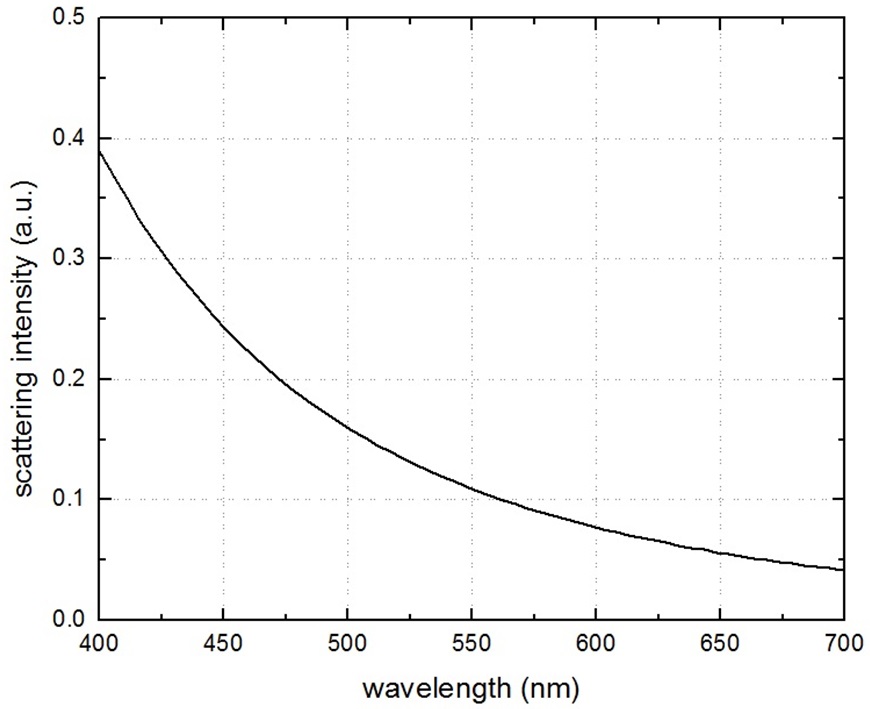
In this study, the chromaticity nonuniformity caused by the wavelength-dependent scattering inside the lightguide is examined in terms of the thickness and the bead size of the lightguide. Mie scattering intensity that is the solution to the Maxwell equations of the light scattering for the spherical particles is generally independent of the wavelength when the particle size is large enough. However, it reduces to the Rayleigh scattering that is strongly dependent on the wavelength when the particle diameter is less than the wavelength, as follows:
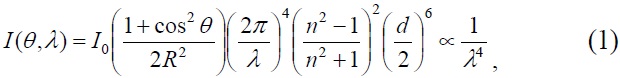
where
[FIG. 1.] The relative scattered intensity spectrum of the Rayleigh scattering in the visible range.

beneath the lightguide include transparent scattering beads of diameter around 10 μm in the transparent resin. This means that the wavelength dependency of the scattering will not be so high as the Rayleigh scattering. Considering the sensitivity of human eye on the chromaticity difference, however, even small dependency of scattering intensity on the wavelength should be measured and removed.
We measured the chromaticity nonuniformity over the edge-lit LCD backlight in terms of the lightguide thickness and the bead diameter of the scattering patterns that are placed beneath the lightguide.
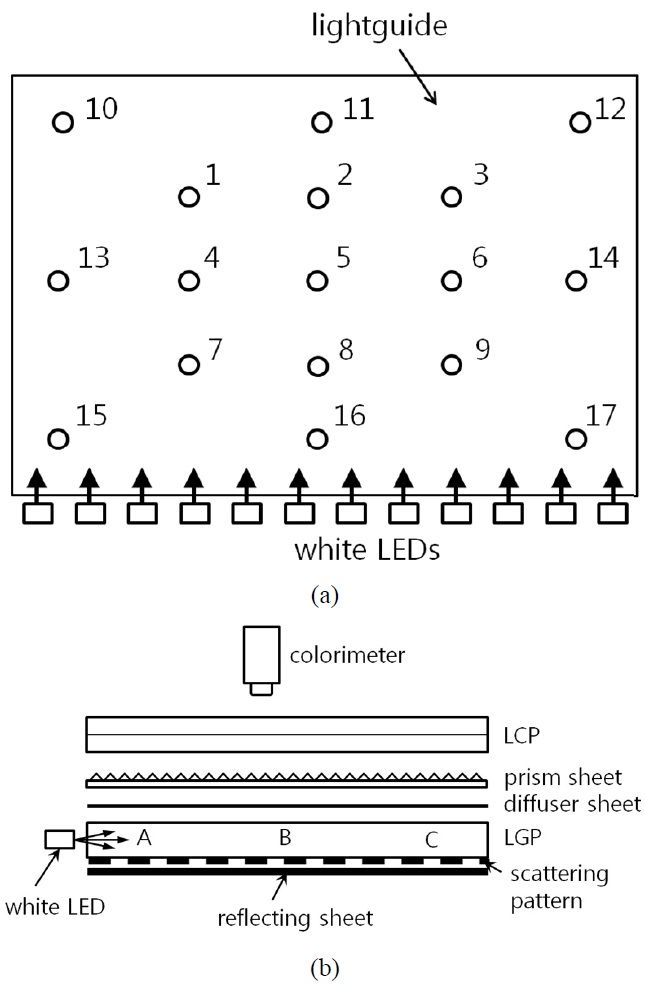
Figure 2(a) and Fig. 2(b) show the top and side views of the edge-lit LCD backlight. The size of the backlight was 50 inch diagonally. The lights from the white LEDs placed at the bottom edge enter into the lightguide and are scattered by the beads included in the scattering patterns that are placed beneath the lightguide. Three different diameters of beads of 3, 7, 12 μm are used to scatter the light. The direction and angular width of the scattered light are controlled by the optical sheets such as the diffuser sheet and the prism sheet placed on top of the lightguide. The liquid crystal panel (LCP) is placed on top of the optical sheets. The typical measurement points are described in Fig. 1(a) and the chromaticity nonuniformity is examined along the vertical line that included the measurement points numbered as 16, 8, 5, 2, and 11 in Fig. 1(a). Fig. 2(b) shows the side view of the backlight. The regions A, B, C correspond to areas that are near, intermediate, and far from the white LEDs. It is expected that the near region A will show more bluish chromaticity and the far region C will show more reddish chromaticity
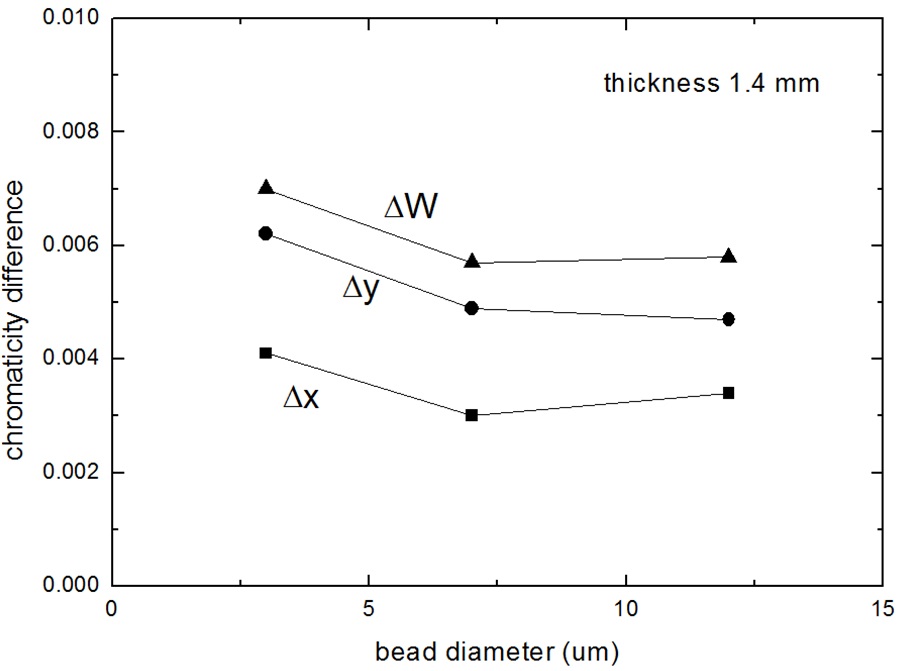
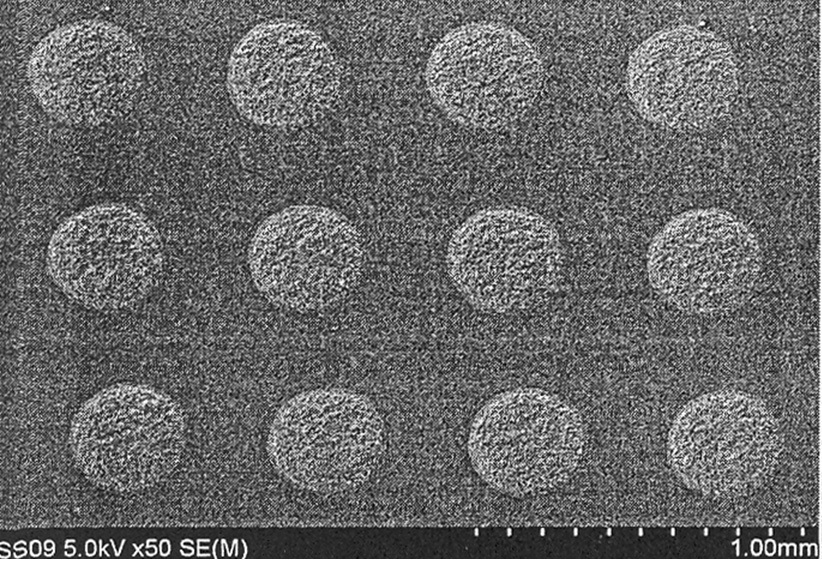
than the intermediate region B due to the wavelength-dependency of light scattering. Fig. 3 shows the magnified scattering patterns that include the scattering beads. The sizes of the scattering beads were 3, 7, and 12 μm in diameter. The scattering beads are transparent SiO2 particles with the refractive index 1.46 at 587.6 nm. The beads were embedded in the transparent resin PMMA (Polymethylmethacrylate) that has the refractive index of 1.49 at 587.6 nm to form the scattering patterns. The scattering pattern size was variable from 121 μm at the entrance region to 268 μm at the far region in order to generate the uniform illumination lights at the LCP. Although all of the used particle sizes are much larger than the wavelength, it is expected that the scattering beads with smaller diameter of 3 μm may generate more chromaticity difference compared to the scattering beads with larger diameter of 12 μm because still small wavelength dependency between the Rayleigh region and the Mie region remains.
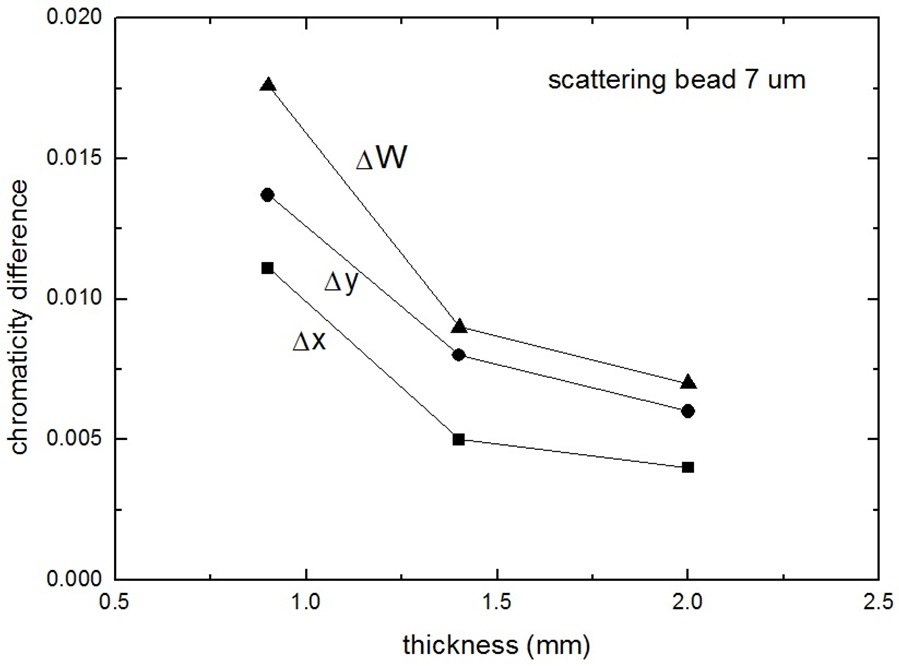
The thicknesses of the used lightguides were 0.9, 1.4, and 2 mm. The smaller thickness create more interactions between the light and the scattering patterns, so larger chromaticity difference is expected compared to the thicker lightguide. The measurement device was the PR650 colorimeter from Photo Research. The chromaticity difference


And

Figure 4 shows the measured chromaticity difference in terms of the thickness of the lightguide with the scattering beads of diameter 7 μm. It is clearly shown that the chromaticity difference of
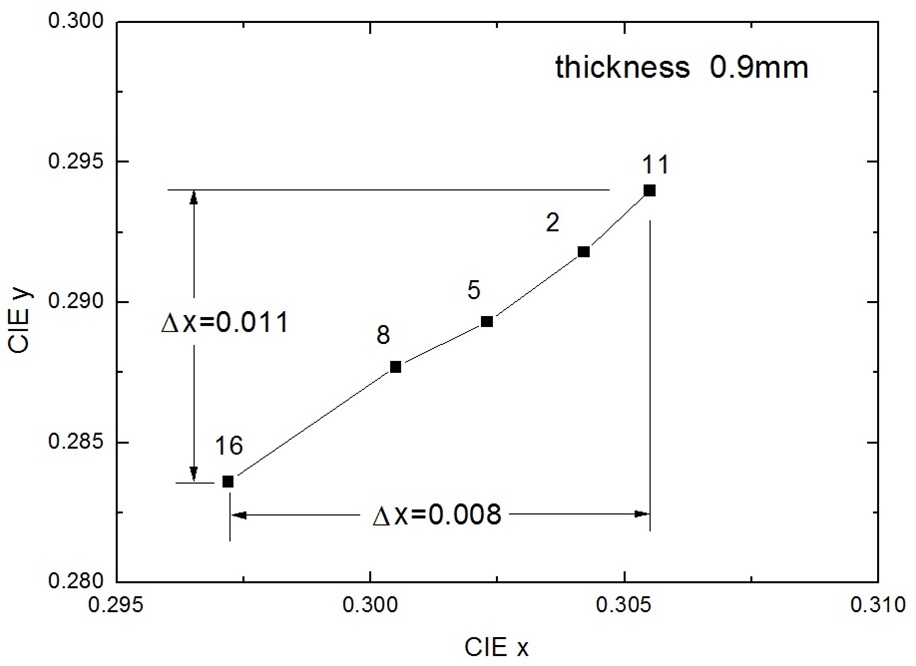
Figure 6 shows the change of chromaticity coordinates in terms of the measurement positions numbered as 16, 8, 5, 2, and 11 for the lightguide thickness 0.9 mm. The measurement point 16 is the closest position from the white LED and so its chromaticity coordinate is toward the blue region and the measurement position 11 is the farthest from the white LED and its chromaticity coordinate is toward the red region. This tendency of chromaticity change shows that the chromaticity difference is induced from the wavelength-dependent scattering in the scattering patterns of the lightguide.
We showed that the chromaticity coordinates of the backlight changes from the bluish color to the reddish color when the light from the white LED propagates through the lightguide. When thinner lightguide is used the chromaticity change is more serious than the thicker lightguide because more interactions between the light and the scattering patterns occur. However, the technical trend is using thinner lightguide in order to reduce the display thickness and the cost. Also, the chromaticity difference when scattering beads larger than 7 μm are used satisfies the tolerance limit. The technical issues are developing thinner backlights using fine beads and so more detailed work is needed to establish the optimum condition of the backlight size, thickness, and the bead size.
Another discussion about the chromaticity nonuniformity will be the effect of absorption in the resin and scattering beads. The used scattering beads (SiO2) and the resin are basically well proven to be transparent enough for use in backlights. It is thought that the major effect of the color nonuniformity comes from the scattering effect because the chromaticity difference is reduced as seen Fig. 5 when the particle size is changed from 3 μm to 12 μm with other conditions not changed. The SiO2 beads have been widely used and proved to be transparent throughout the visible spectrum. If there were some effect from the absorption in the resin the chromaticity difference should be negligible because the thickness of the lightguide and the resin are kept same.
We measured the chromaticity nonuniformity in the 50 inch LCD backlight that is supposed to occur due to the wavelength-dependent scattering. As the backlight thickness becomes thinner than 1 mm, the chromaticity difference became bigger than the tolerance limit. The scattering bead size used were 3, 7, and 12 μm and the light scattering from particles of these sizes belong to the Mie scattering region that is almost independent of the wavelength. However, because the chromaticity tolerance limit of the human eye is very sensitive, even the small change of the chromaticity coordinate belonging to the intermediate region between the Rayleigh scattering and the Mie scattering needs to be measured and corrected. Since the chromaticity nonuniformity is strongly dependent on the backlight size, thickness, and the scattering bead size, development of the backlight need to be based on the wavelength-dependent scattering as shown in this research.