Formaldehyde is a colorless and highly flammable gas that has a pungent odor. It is used in the preparation of urea-formaldehyde and phenol-formaldehyde resins as adhesives in the manufacture of particle board, fiberboard, and plywood. Such resins are major sources of formaldehyde in indoor environments. Formaldehyde is a pollutant whose presence in indoor environments has caused much concern because of the potential harm it causes to human health [1,2].
Formaldehyde concentrations in indoor environments have been measured in workplaces, offices, residential buildings, and public spaces. Reportedly, formaldehyde is present in various indoor environments in mean concentrations ranging from 4 to 70 μg m?3 [3-6]. In addition, formaldehyde concentrations in indoor environments have been usually found to be greater than those in outdoor environments [4,7,8]. For this reason, the measurement of formaldehyde concentrations in indoor environments is of particular interest. The guidelines for residential buildings and public spaces in Korea specify that the concentration of formaldehyde in these places should not exceed 100 μg m?3 [9].
Methods for measuring formaldehyde concentrations in indoor and ambient atmospheres have been developed by using both active and passive sampling techniques, employing the reaction of formaldehyde with 2,4-dinitrophenylhydrazine (DNPH) reagent, 3-methyl-2-benzothiazolinone hydrazone hydrochloride reagent, or chromotropic acid [6,10-13]. Diffusive sampling techniques have often been used to measure the concentrations of air pollutants in indoor and ambient atmospheres because of its convenience with regard to deployment and collection. Because the technique requires no power supply during sampling, it can be employed almost anywhere. Moreover, the long-term effective concentrations obtained by the diffusive sampling technique are very useful in exposure assessments. However, collecting real-time concentration data of pollutants is not possible [14,15].
In practice, the uncertainty may arise in the analytical procedure associated with the use of a diffusive sampler, such as sampling, instrument effects, reference values, blank correction, and operator effects [16]. The estimation of the uncertainty is necessary in order to establish the comparability of the measurement results and to improve the confidence in the validity of the results obtained. The evaluation of the uncertainty associated with the analytical method using a thermally desorbable diffusive sampler for measuring benzene was reported by Plaisance et al. [17]. The principal part of the uncertainty budget was accounted for by the variation of the sampling rate in relation to the environmental factors.
In this study, a diffusive sampling technique, using DNPH for determining the formaldehyde concentration in indoor environments, was evaluated. Furthermore, the uncertainty with regard to the collection and analysis of formaldehyde data in such a manner was estimated.
2.1. Formaldehyde Diffusive Sampler and Chemicals
The badge-type diffusive sampler comprises a sampler end cap (55 mm × 55 mm × 18 mm), sampler body (36-mm i.d.), and a diffusion screen (33-mm i.d.) made of a high-density polyethylene [11]. The sampler body comprises a filter-retaining ring (28-mm i.d.) and a spacer ring (28-mm i.d.), which maintains a diffusion distance of 10 mm, a semi-permeable membrane (Celgard-2500; Celgard LLC, Charlotte, NC, USA), and a collection filter (26-mm, 1 Chr; Whatman, Maidstone, Kent, UK). The filter-retaining ring and spacer ring are made of polyethylene. The semi-permeable membrane has 55% porosity, 0.209 μm × 0.054 μm pore size, and 25-μm thickness. The silicone flat ring (28-mm i.d.), which ensures an airtight connection between the diffusion screen and the sampler body, is mounted on the diffusion screen.
For the experiments, all parts of the diffusive sampler, except the semi-permeable membrane, were thoroughly cleaned with pure water and acetonitrile, using an ultrasonic cleaner (40 kHz; Seong Dong, Seoul, Korea), and were then allowed to dry overnight in a dry oven at 60℃ (OF-22; JeioTech, Daejeon, Korea). After drying and cooling, the components were stored in a clean environment to prevent the accumulation of dust or other contaminants.
The collection filter was soaked in an absorbing solution containing 0.1 g of DNPH-HCl ethanol recrystallized twice from DNPH (97%; Sigma-Aldrich, St. Louis, MO, USA), 4 M HCl (35%? 37%; Wako, Osaka, Japan) and 0.3 mL of phosphoric acid (85%, Wako) in 20 mL of HPLC-grade acetonitrile (Wako). The coated collection filter was dried for 24 hr under vacuum in a desiccator. After drying the absorbing solution, the components were immediately assembled into the diffusive sampler. The samplers were handled very carefully because they are easily contaminated. All the samplers were stored in sealed aluminum bags in the dark at 4℃ before and after use.
In order to analyze the collected formaldehyde, the collection filter of the diffusive sampler was unloaded into a glass bottle with PTFE-lined screw caps for extracting the formed DNPH derivative; the derivative was extracted with 3 mL of acetonitrile in a shaker (BS-21, JeioTech) having a controlled-temperature incubator (±1℃) with orbital shaking for 1 hr. The agitation in the shaker was adjusted to produce a mild swirling of the extraction solution, and the rotational frequency was about 150 rpm. The temperature of the solution in the extraction vials during the extraction was maintained at about 30℃ in order to allow for a stable extraction.
The HCHO-DNPH derivative extracted the diffusive sampler and the DNPH cartridge was analyzed using a high performance liquid chromatograph, equipped with a UV photodetector (UVD-170U; Dionex, Sunnyvale, CA, USA) set at 360 nm, with a C-18 column (4.6 × 250 mm, 5 μm, 120 A; Acclaim 120, Dionex) used for separation of the HCHO-DNPH derivative, with a gradient elution of acetonitrile-pure water from 50:50(v/v) to 100:0, at a flow rate of 1.0 mL min?1. The total time required for the analysis of HCHO was 15 min, with the retention time of the HCHODNPH derivative being 11.4 min.
Quantitation was performed using an aldehyde/ketone-DNPH derivatives standard solution (15 μg aldehyde mL?1; Restek, Bellefonte, PA, USA). Formaldehyde peaks were quantified from a regression line fitted to a set of external standards ranging from 0.15 to 15 μg mL?1. The detector response (peak area) was linear over this range, as determined by the regression coefficients, with values greater than 0.99 for formaldehyde.
Three blank samplers were prepared and analyzed together with the exposed samplers. The analyzed values of the blank samplers were subtracted from those of the exposed sampler values to obtain the net formaldehyde concentration. All experiments were carried out at least in duplicate.
2.3. Optimization of the Diffusive Sampling
The diffusive samplers were tested in a cylindrical exposure chamber (0.07 m3), which employed a mixing fan and sensors (TSI model 8386; TSI Inc., Shoreview, MN, USA) for monitoring the temperature and relative humidity. The formaldehyde was generated from formaldehyde solution (38% in water, Sigma- Aldrich) by introduction of pure air (flow rate, 1 L min?1). The diluted formaldehyde was introduced into the chamber at a flow rate of 5 L min?1 and its concentration was measured using the DNPH cartridge.
To determine the sampling rate of the diffusive sampler, a DNPH cartridge (capacity, 75 μg/cartridge; background, <0.06 μg formaldehyde/cartridge; Supelco, Bellefonte, PA, USA) was employed for active sampling. Diffusive and active sampling methods were carried out simultaneously in the exposure chamber to estimate the sampling rate. The exposure experiment, using four replicate diffusive samplers in the chamber, was performed. The temperature and relative humidity in the chamber throughout the exposure period were held constant at 25 ± 3℃ and 40 ± 10%, respectively. Four samplers were installed in the chamber, and exposed for periods of between 3 and 24 hr. All experiments were carried out at least in duplicate.
The optimum quantity of DNPH as a collection medium should result in the sensitive detection of formaldehyde, while remaining applicable to long exposure times. Furthermore, the material should exhibit low blank levels. The collection filter is completely covered by the absorption solution. To obtain the optimum dipping time for the absorption of DNPH onto the collection filer, the collection filter was dipped in DNPH solution for around 0.5 to 24 hr. The diffusive samplers assembled with these filters were exposed to an average formaldehyde concentration of 250 ± 50 μg m?3 in the chamber. The sampling was performed for 6 to 24 hr. The blank value of the diffusive sampler was also estimated. The collection filter coated with the absorbing solution was immediately extracted in acetonitrile and analyzed by the procedure already described.
The relationship between the collected formaldehyde mass and the dipping time of the collection filter was investigated by carrying out a series of exposure experiments using a formaldehyde concentration of about 250 μg m?3. The collected mass increased with dipping time up to about 4 hr. Subsequently, however, there was no further increase in the collected mass. The mean relative standard deviation for the total data was about 13% (that for 4 hr of dipping time was 8%). The variation of the analyzed peak area of DNPH as a function of the dipping time was the same as that of the collected mass of formaldehyde.
The blank samplers were used to evaluate the contamination of samplers, as well as to estimate the detection limits and errors for the diffusive samplers. The blank values had a mean formaldehyde mass of 0.028 ± 0.003 μg with a relative standard deviation of 10% (n = 31), and they showed a normal distribution. The blank values did not increase after four weeks of storage in a refrigerator at 4℃ in the dark.
In this study, the formaldehyde concentration in the sample, expressed in μg m?3, can be given as follows:
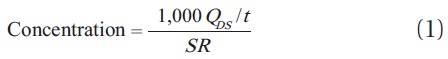
where, QDS is the mass of formaldehyde collected by the diffusive sampler (μg), t is the sampling time (hr), SR is the sampling rate (L hr?1) and the scale factor of 1,000 converts liters into cubic meters.
The estimation of the overall uncertainty of an analytical result should consider all sources of systematic and random errors that are associated with the applied measurement and analytical method [16]. Errors in the determination of formaldehyde concentration using the diffusive sampler are mainly affected by the following sources: 1) standard preparation, calibration, extraction and analysis (
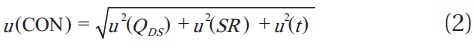
The overall combined uncertainty (
The formaldehyde mass (QDS) collected in the diffusive sampler is calculated as follows:
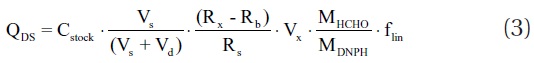
where Cstock is the concentration of the standard solution (μg mL?1), Vs is the volume of the standard solution (mL), Vd is the volume of a dilute solution (mL), Rx is the analytical response value of a sample, Rb is the analytical response value of a blank, Rs is the analytical response value of the standard solution, Vx is the extraction volume for the collection filter in the diffusive sampler (mL), MHCHO is the molar mass of formaldehyde, MDNPH is the molar mass of HCHO-DNPH derivative, and flin is the slope of the calibration curve.
The sampling of formaldehyde in the chamber was simultaneously performed with a DNPH cartridge and pump as an active sampling method to determine the sampling rate (SR) of the diffusive sampler. The exposure experiment in the chamber was performed with concentrations ranging from 15 to 480 μg m?3. Four diffusive samplers were installed in the chamber and exposed for periods of 3 to 24 hr.
The collected mass of formaldehyde was corrected by subtracting the average mass measured for the blanks. The reference formaldehyde concentration was determined from the mass of formaldehyde collected by the DNPH cartridge in relation to the volume of air drawn by the pump. The sampling rate of the diffusive sampler can be calculated as follows:
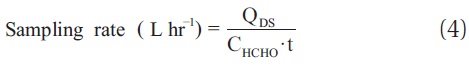
where QDS is the mass of the formaldehyde transported into the diffusive sampler by diffusion (μg), t is the exposure time for the diffusive sampler (hr), and CHCHO is the formaldehyde concentration (μg m?3) measured by the DNPH cartridge with active sampling.
3.1. Estimation of the Standard Uncertainty
The uncertainty associated with the purity of the standard solution (HCHO-DNPH derivative),

[16], because the manufacturer gave no further information concerning the uncertainty value.
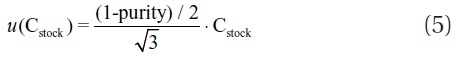
The standard uncertainty for the concentration of the standard solution associated with the purity was 0.0433 μg mL?1.
The uncertainties associated with the volume measurement,

[16]. The manufacturer’s tolerance values for these pipettes were 0.1% (0.2 mL) and 0.13% (1 mL), respectively.
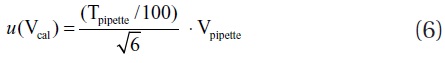
where Tpipette is the manufacturer-reported tolerance value of the pipette and Vpipette is the volume of solution taken with a pipette. The values of
The uncertainty associated with volumetric repeatability,
The standard uncertainties associated with the volume measurement for the dilution of the standard solution,

The calculated standard uncertainties for the volume measurement of the standard and dilution solutions were 0.9463 × 10?3 and 1.5819 × 10?3 mL, respectively.
In order to evaluate the uncertainty associated with the repeatability of the analytical response values (e.g., peak area) obtained in the analytical process at the same concentration level, the standard uncertainties,
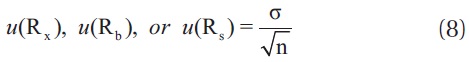
where σ is the standard deviation of response values for the samples, blanks, and standards. n is the number of their replicates analyzed in routine analysis (n = 10). The results obtained for each response value were 0.0827, 0.0107, and 0.2132, respectively.
A multiple-point calibration process is based on the linear regression curves obtained by plotting the peak area of a chromatogram versus the standard concentrations. Seven calibration standards were prepared from the HCHO-DNPH standard solution of 15 μg mL?1 and were measured nine times each. The calibration curve was given by (peak area) = 1.5787 + 5.1199 × (HCHO conc.) with a correlation coefficient of 0.997. The uncertainty associated with the determination of concentration by transforming the chromatographic signals in a calibration curve,
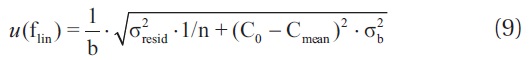
where b is the slope of the calibration curve, σresid is the standard deviation of residuals, n is the number of measurements for the calibration, C0 is the formaldehyde concentration at each calibration level, Cmean is the mean value of the different calibration standards, and σb is the standard deviation of the slope of the calibration curve. The standard deviations of the slope and residuals obtained from the linear regression of each calibration curve were 0.1690 and 0.8084, respectively. When the formaldehyde concentration at each calibration level was 9 μg mL?1, the mean value of the different calibration standards (n, number of measurements) was determined to be 9.2932 ± 0.3225 μg mL?1. The obtained result for the uncertainty in determining the concentration by the calibration curve was 0.0535.
The uncertainty associated with the final volume upon the extraction of the collection filter with acetonitrile,
From the International Union of Pure and Applied Chemistry- recommended atomic-weight values [19,20], the atomic weights and uncertainties for the constituent elements of formaldehyde and HCHO-DNPH were calculated. The calculated molar masses of formaldehyde and HCHO-DNPH were found to be 30.0260 and 210.1469 g mol?1, respectively. The standard uncertainty for each constituent element of formaldehyde and HCHO-DNPH was determined by dividing these values by

assuming a rectangular distribution. By multiplying the standard uncertainty for each element (e.g., C, H, O, and N) by the number of atoms, the standard uncertainties of element contributions to the molar mass were determined. Then, the standard uncertainties associated with the molar mass of formaldehyde
and HCHO-DNPH,
The interim combined standard uncertainty associated with the determination of formaldehyde mass,
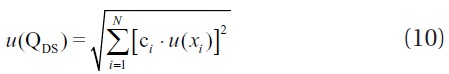
where c
The formaldehyde mass (QDS) calculated from Eq. (3) with the input value for each component was 2.9403 μg. The interim combined standard uncertainty,
Uncertainty associated with the sampling time (t) is based on the accuracy of the digital timer (EW-94460-04; Cole-Parmer, Vernon Hills, IL, USA). According to the manufacturer’s certificate, the accuracy of the digital timer was given as ±0.07 sec hr?1. The standard uncertainty,

The obtained result was 0.00067 hr, based on a 24-hr measurement.
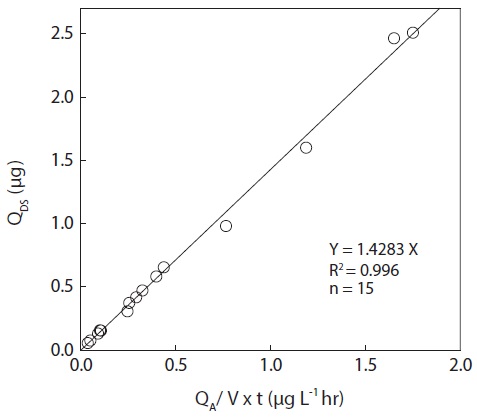
Fig. 1 shows the comparison of the performance of the diffusive samplers and active cartridges. The results of the comparative measurement of the diffusive samplers and active cartridges over the range of tested formaldehyde concentrations in the two dinitrophenylhydrazinemethods are in close agreement. These data were highly correlated with a coefficient of correlation of 0.996 (n = 15). As shown in the relationship described Eq. (4), the sampling rate for the diffusive sampler was calculated to be 1.428 L hr?1 with a standard deviation of 0.084 L hr?1. The obtained standard deviation can be used directly as a standard uncertainty associated with the determination of sampling rate.
3.2. Estimation of the Combined Standard and Expanded Uncertainty
The combined standard uncertainty,
The expanded uncertainty,

The final result for formaldehyde analysis using the diffusive sampler could be expressed as 85.8 ± 10.48 μg m?3 with a relative expanded uncertainty of 12.2%.
The results presented here show that the diffusive sampler, using a DNPH as a substrate, is a satisfactory method for determining atmospheric formaldehyde, within ranges which are commonly encountered in indoor air. Furthermore, the diffusive

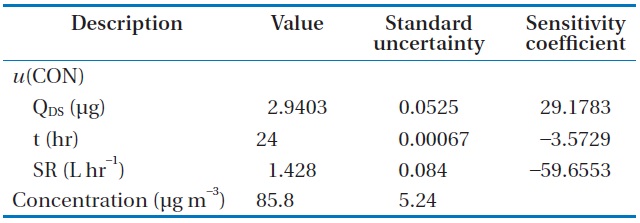
Input value, standard uncertainty, and sensitivity coefficient for each component for calculating the combined standard uncertainty associated with determination of HCHO concentration, u(CON)
sampler could easily be used for the evaluation of indoor pollution by the formaldehyde generated from the major sources, such as furniture or building materials.
The uncertainty related to the collection and analysis of formaldehyde was estimated. The uncertainty associated with the determination of the sampling rate and the mass of the formaldehyde transported into the diffusive sampler by diffusion is likely the dominating factor affecting uncertainty of measurement. The quality of analytical measurement results could be assured quantitatively by estimating uncertainty associated with measurement.
To evaluate the contribution of the sampling rate on the uncertainty related to diffusive sampling, the sampling rate should be evaluated under various environmental conditions, such as wind speed, humidity, and temperature. This is a further research subject of this laboratory