The performance of a sailing yacht depends on the balance between the hydro- and the aerodynamic forces acting on the hull and the sail. Numerous previous studies have focused on sail optimization, because the sail directly affects the propulsion performance. Most of these studies mainly focused on the basic geometry of the sail, including the camber shape and sail arrangement, in order to improve the lift, lift-to-drag ratio, effective angle of attack, and interactions between sails.
Most of yacht sails are made of thin fabric, so it can be easily deformed by wind pressure in various forms such as camber changing, wrinkling, stretching, shivering and fluttering. The deformation of the sail shape causes changes in the forces and moments acting on the sail, which in turn causes thrust reductions and unintended turning forces called as weather helm. In this light, it is necessary to focus on sail deformation. Recently, Trimarchi et al. (2009) applied the finite element method (FEM) to calculate the sail deformation and the boundary element method (BEM) to measure the surrounding flow. Lee et al. (2011) implemented a fluid-structure interaction (FSI) analysis using a grid deformation technique to determine the deformation of the two-dimensional cross-section of a 30-
As mentioned above, the fabrics used to make sails are very thin and flexible; therefore, even though their initial shape is quickly restored by an elastic effect, they can deform considerably compared to the initial shape. In this light, it is reasonable to clarify their deformation behavior using nonlinear analysis. Bak et al. (2013) investigated the nonlinear behavior of a sail by applying FSI analysis to the deformation of a simple-shaped sail made of thin fabric. Specifically, the interaction between aerodynamics and finite element analysis was studied by one-way FSI for a fabric sail, with the supporting forces generated by the mast, boom, and rigs applied as the boundary conditions for structural analysis.
In the present study, FSI analysis of the main sail of a 30-
FSI analysis methods can be classified as direct-coupled FSI, one-way FSI, and two-way FSI. Direct-coupled FSI is an analytical method in which the flow and structural analyses are simultaneously coupled. In one-way FSI, the result of flow analysis is applied to the loading condition of the structural analysis in which the interaction at the boundary is performed only once and interactive loading calculations are not carried out. The two-way FSI method requires a repetitive calculation as the deformation of the shape largely depends on the fluid force and the structural deformation affects the flow again.
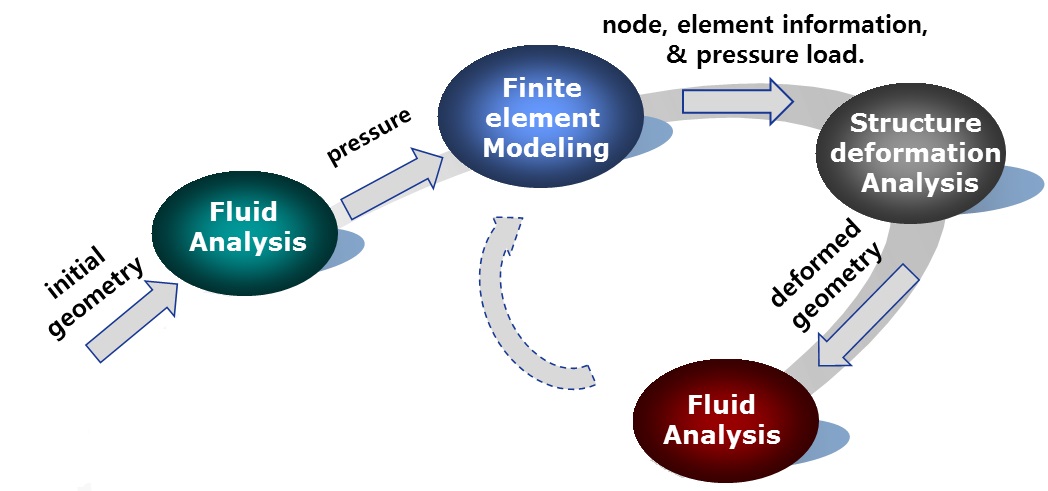
This study uses a partial two-way FSI method, as shown in Fig. 1.The deformation of the shape by the fluid force is identified only for the initial geometry but is not calculated iteratively. The fluid force is calculated by CFX, a commercial CFD code, and the grid system for CFD calculation is generated using ICEM-CFD code (ANSYS Inc., 2009). In FSI analysis, the structural deformation is calculated by applying the fluid forces as the distributed loads for structural analysis.
CFX calculates the fluid forces at each nodal point, and FEM-based LS-DYNA requires the loading force at center of each elements. Generally, the integral method is used to convert the values on nodes to an element; however, this approach is not efficient for a model with a large number of elements. Therefore, the Workbench program of ANSYS, which can be used to perform FSI analysis by integrating CFX and LS-DYNA, is used in this study.
The static structure module in Workbench can be used for finite element modeling as well as structural analysis. This module is used to calculate the structural deformation by applying the pressure value, which is calculated using CFX at a node, as the distributed load for the static structure module. However, the static structural module can only be applied to linear analysis for a small deformation. For nonlinear analysis of the large deformation of a thin fabric based on finite element theory, a nonlinear FEM code such as LS-DYNA is required. In this study, the pressure loads for structural analysis are generated using Workbench, wherein both finite element modeling and fluid force conversion are carried out. The FSI analysis of sail deformation is performed using LS-DYNA.
>
Governing equations for flow analysis
In this study, turbulent flows around the sail are simulated using CFX by solving the three-dimensional Navier?Stokes Eq. (2) using the continuity Eq. (1).

where
Eq. (3) expresses the temporal change in the velocity of turbulence

and fluctuation component of the velocity

To simplify these complicated expressions, the Navier?Stokes equation is integrated with time to obtain the time-averaged Reynolds-averaged Navier?Stokes (RANS) equation:

CFX is based on FVM, which has been adopted for the numerical simulation. The governing equations for viscous flow include the continuity equation, three momentum equations, volume fraction, and turbulence equations. In addition, the k-ω shear-stress-transport (SST) model is adopted, because it is designed to give highly accurate predictions of the onset and the amount of flow separation under adverse pressure gradients by the inclusion of transport effects into the formulation of the eddy-viscosity. For the inclusion of the current effect later on, the
>
Nonlinear structural analysis for sail
Sail cloth can be classified as a shell or a membrane with a laminated composite structure that shows some distinctive characteristics such as anisotropy of multiple laminations. The sail deformation can become geometrically large owing to the thin thickness, elasticity, and external forces. Analysis of the large deformation of an anisotropic membrane requires a nonlinear FEM. Furthermore, a sail shows a distinctive structural behavior, namely, wrinkling, that affects the distribution of tension force on the sail surface; this may lead to a change in the deformation characteristics of the sail (Heppel, 2002). To more realistically describe the sail deformation behavior, Hughes and Carnoy (1983), which explains the finite strain and the thinning behavior, is applied. The formulation for a degenerate shell element is as follows:


where

denotes a position vector to a point on the reference surface of the shell and
on the reference surface that defines the fiber direction through that point. In the context of kinematics, the same parametric representations used to describe the geometry of the shell element, reference surface, and fiber vector interpolation are used to interpolate the shell element displacement, an iso-parametric representation. Again, the displacements are separated into the reference surface displacements and rotations associated with the fiber direction.


where
In this study, numerical analysis is carried out on the main sail of a 30-
>
Analysis conditions and assumptions
CFD analyses for the main sail are carried out under the following assumptions and conditions:
(1) Both the mast and the boom are considered as rigid structures that are not deformed.
(2) The incident angle of apparent wind is 20° with a speed of 20 knots, and the corresponding Reynolds number is 2.663× 10⁶.
(3) The governing equations for viscous flow are RANS, and the solutions are obtained using FVM.
(4) For turbulent flow analysis, an SST turbulent model based on k-ω and the wall function method is employed.
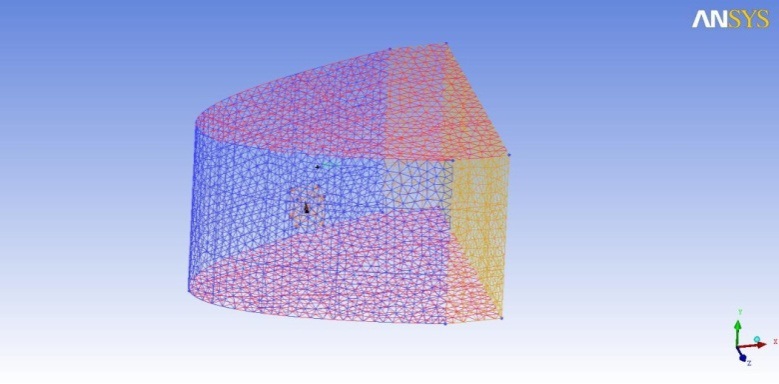
(5) 2,140,815 unstructured grids are used for CFD analysis. Both the windward and the leeward sides of the sail surface use 32,457 grids.
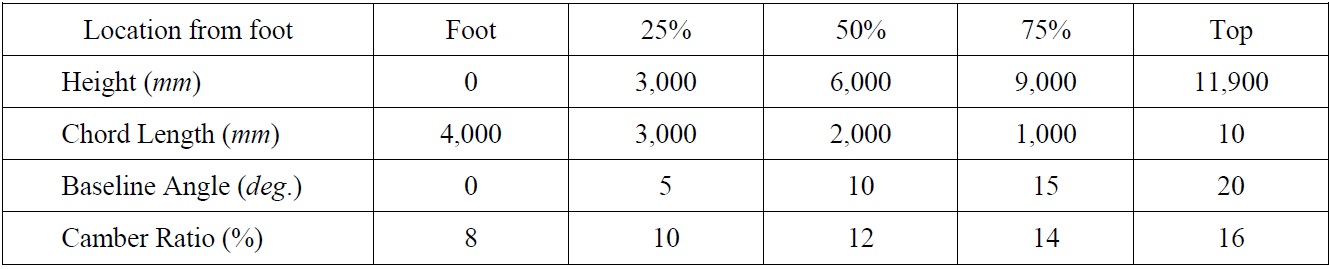
[Table 1] Geometrical parameters of the main sail.

Geometrical parameters of the main sail.
Grid generation
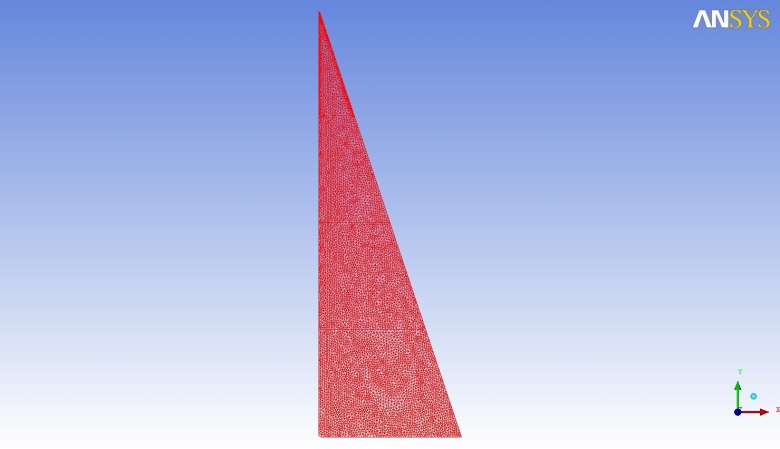
The grid system for the CFD calculation is generated by using the ICEM-CFD code, and the C-type grid topology is used, which is that apparent wind flow with angle of attack at sail fixed. Fig. 3 shows the grid system used for this calculation; it consists of 2,140,815 unstructured grids and 32,457 grids on both the windward and the leeward sides of the sail surface. The size of the grid around the sail is kept small to realize accurate calculations, as shown in Fig. 4. All forces and flow simulations are computed at a Reynolds number of 2.663 × 10⁶; this corresponds to a wind speed of 20
Numerical calculation method
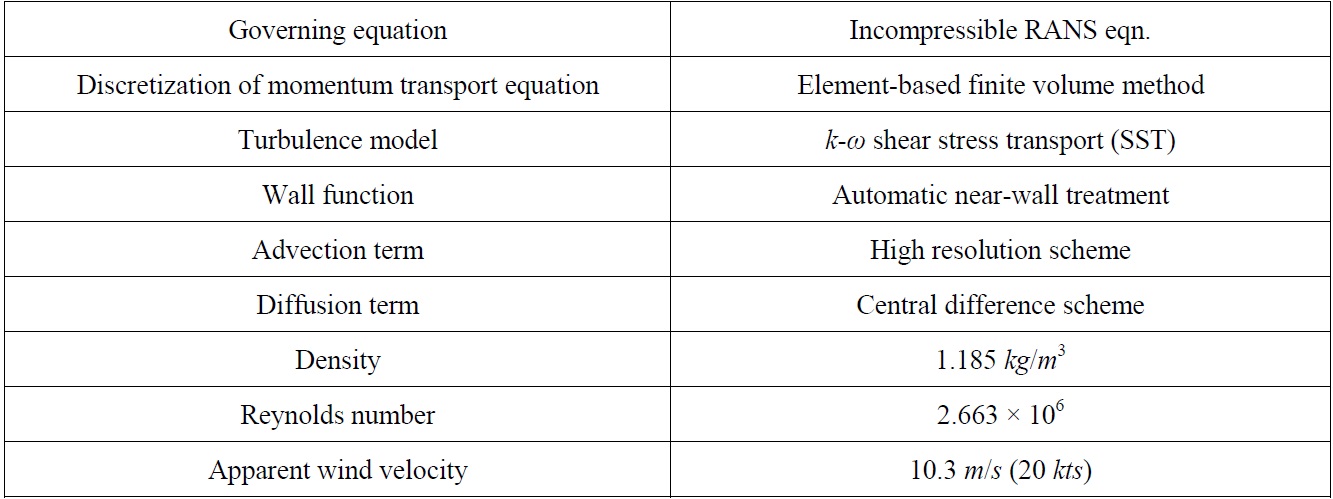
In this study, the commercial software ANSYS-CFX, which is based on FVM, is adopted for the numerical simulation. The governing equations for viscous flow include the continuity equation and RANS equation. The computational conditions are an apparent wind speed of 20
The
[Table 2] Computational conditions & method.

Computational conditions & method.
>
Results of CFD calculations on initial sail shape
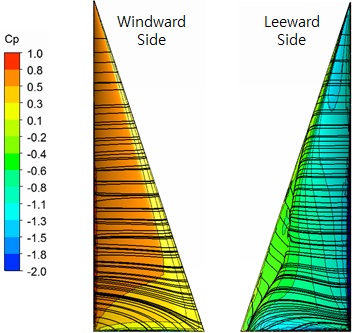
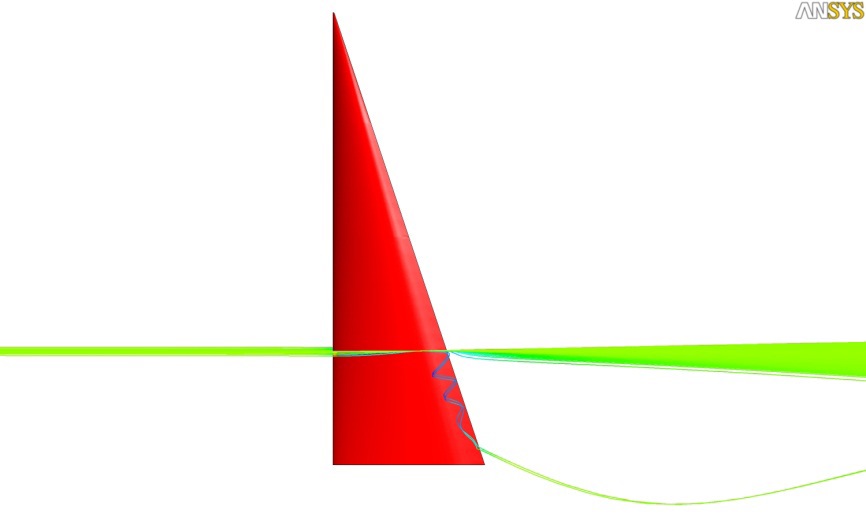
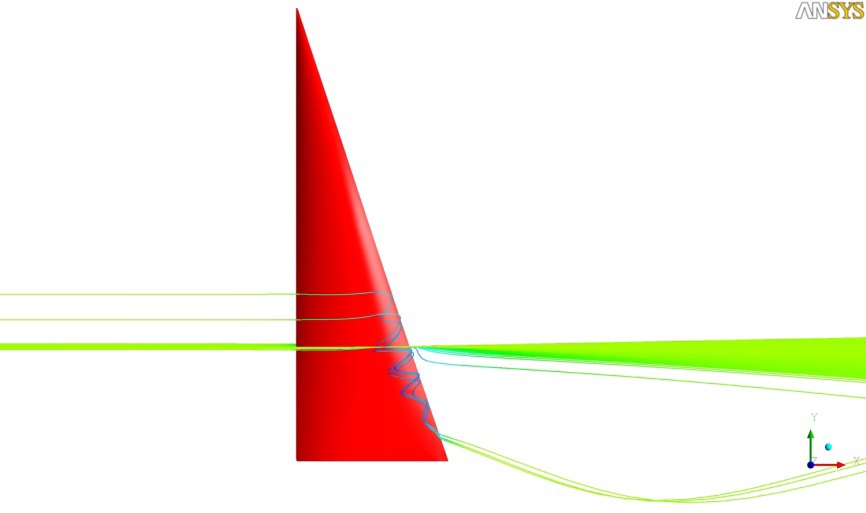
The flow characteristics are reviewed via the pressure distribution and limiting streamlines on the main sail surface. Fig. 5 shows the limiting streamlines and the distribution of the dynamic pressure coefficient on the sail surface, wherein flow separation is found around the sail leech in the leeward side. The flow separation can also be detected by representing the field streamlines around the sail on the section of 25% sail height. The pressure values obtained on the initial sail surface are applied to the loading conditions for structural analysis.
>
Analysis conditions and assumptions
The structural analyses of a sail are carried out based on the following assumptions:
(1) Kevlar® 49 fabric (E. I. DuPont de Nemours and Co., Inc.) is used to approximate the material properties of actual sail fabric, and their values are shown in Table 3.
(2) 7,824 finite elements are used for the structural analysis, and the pressure of the sail as calculated in the flow analysis is considered as the loading condition.
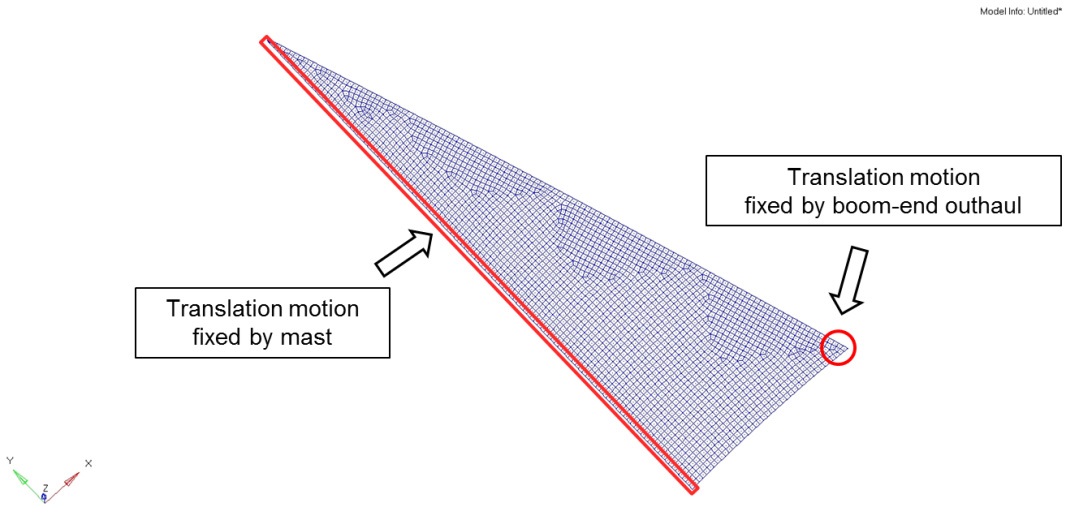
(3) All translational motions are constrained to describe the boundary conditions on the fixed support by the mast and boomend outhaul, as shown in Fig. 8.
(4) The actual sail is fixed by the mast on the sail luff edges, and the sail foot, which is the end of the edge (sail clew) is supported by the tension force owing to the boom-end outhaul.
[Table 3] Material properties of Kevlar® 49 fabric.

Material properties of Kevlar® 49 fabric.
>
Results of structural analysis
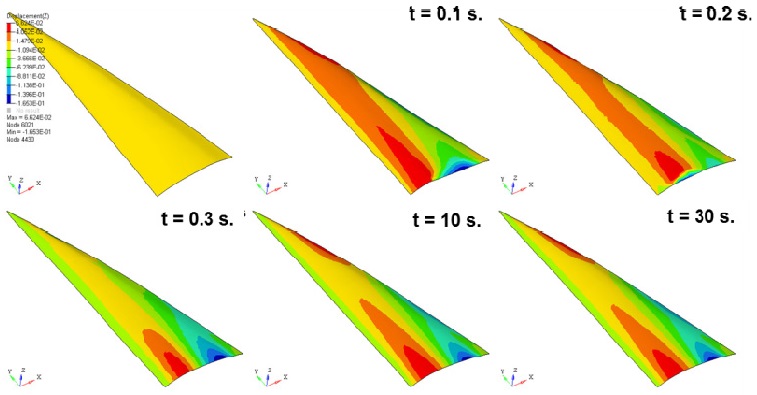
LS-DYNA is a general-purpose nonlinear explicit finite element code for analyzing the large deformation static and dynamic response of structures. The main solution methodology is based on explicit time integration, namely, constant loading along the deformed sail surface. Therefore, a large structural deformation is required to verify the tidal convergent process, as shown in Fig. 10.
Fig. 9 shows the deformation of a sail subjected to dynamic loads, namely, dynamic pressures caused by a flow. The maximum sail deformation is 0.16
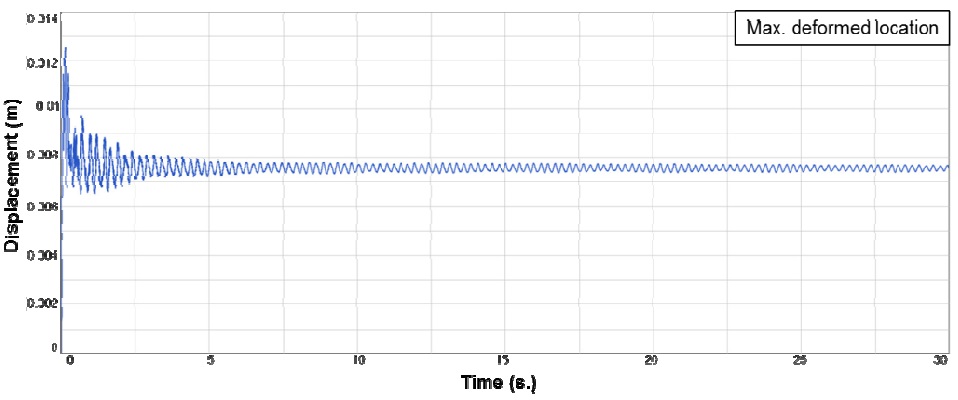
The deformation of a node located on the 25% section of the height of the sail is selected to review the convergence of this deformation. Fig. 10 shows the time history of the displacement at a node with maximum deformation; it is found that the difference in displacement is below 0.0001
The area of the deformed sail is compared with the area of the initial sail to verify that the shape of the camber varies with the stretching of the sail fabric itself. Table 4 shows that the area of the deformed sail increased by 0.001%. It is found that the variation of the sail area is negligibly small and the stretching of the fabric under wind pressure is not the main reason for camber change.
[Table 4] Comparison of surface areas of the initial and the deformed sails.

Comparison of surface areas of the initial and the deformed sails.
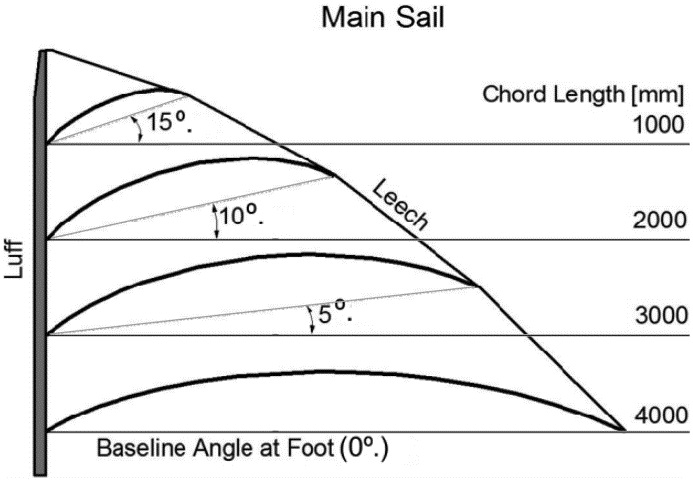
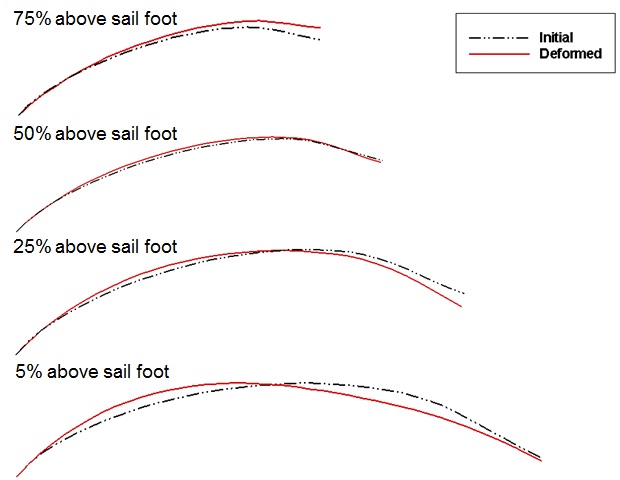
Fig. 11 shows the sectional cambers at each height of the sail. Cambers near the sail luff are found to be deformed deeper at lower sections, and the maximum draft moves to the leech at higher sections, which is also called sail twisting. At 25% of the height, the sail camber near the leech is closed to the windward side, which may be expected owing to the pressure change on the leeward side of the sail.
FLOW ANALYSIS FOR DEFORMED SAIL
To identify the variation of the aerodynamic performance of the deformed sail, the CFD calculation is performed under the same analysis conditions as those for the initial sail. The flow characteristics, surface pressure distribution, lift-drag forces, and the change in CE are reviewed for the initial and the deformed sails.
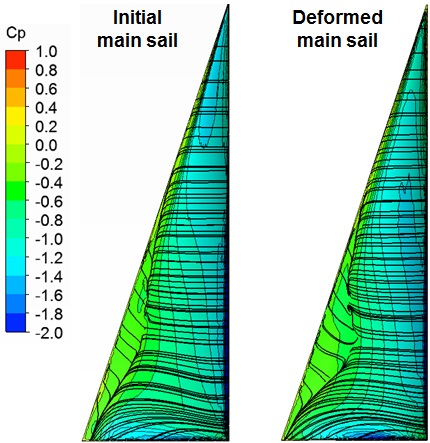
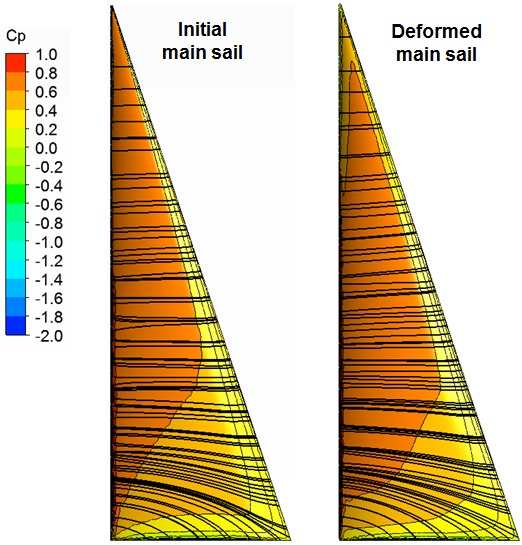
The distribution of the dynamic pressure and the limiting streamlines on the sail surface are reviewed for the initial and the deformed sails. Fig. 12 shows that the range of positive pressure near the luff is expanded on the windward side, which is why the cambers near the sail luff are deformed deeper at lower sections, as shown in Fig. 11.
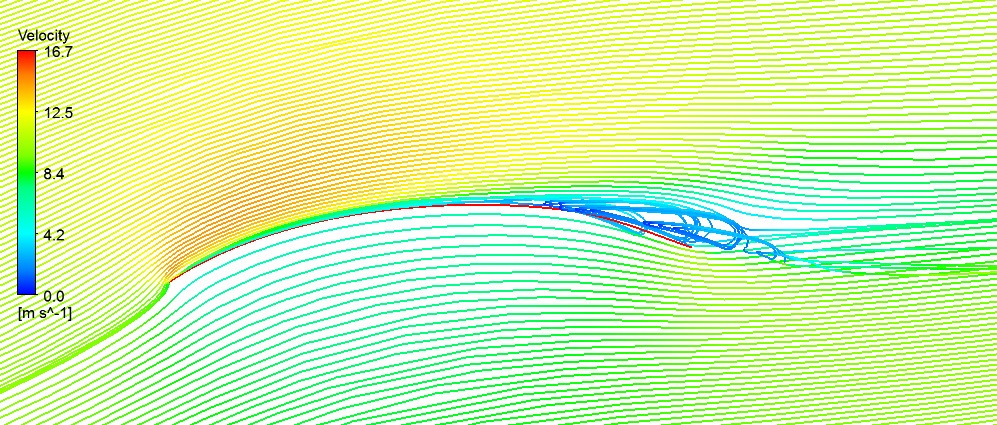
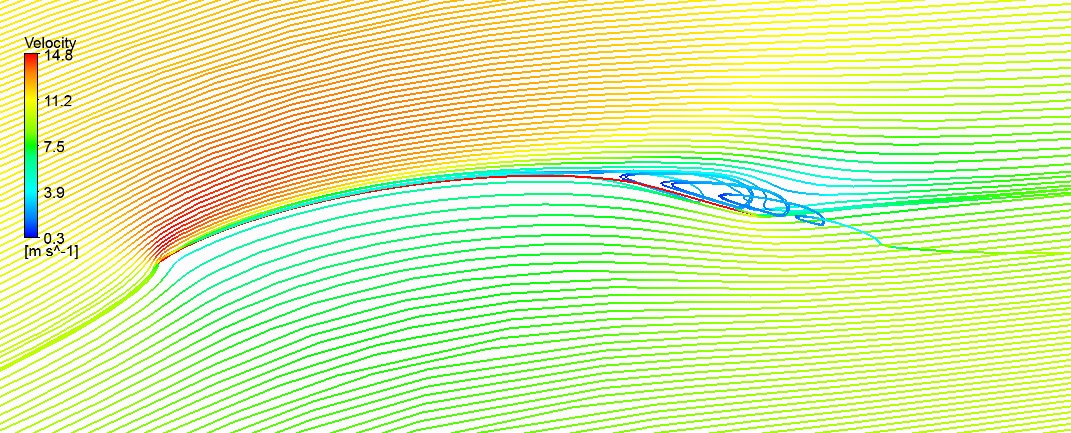
Fig. 14 shows that the eddy section resulting from the flow separation generated around the leeward side of the sail leech is increased compared to that in the initial sail, which can also be observed from the field streamlines in Figs. 6 and 14. Considering the flow separation on the leeward side recovers the surface suction pressure, which is why the camber line near the leech moves to the windward side, as shown in the 25% section in Fig. 11.
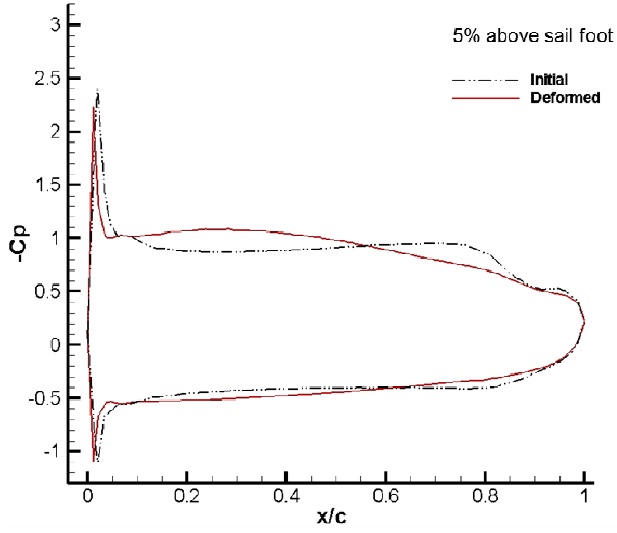
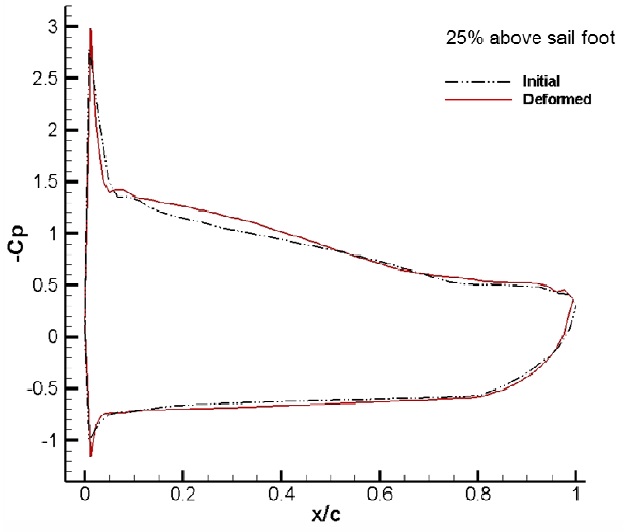
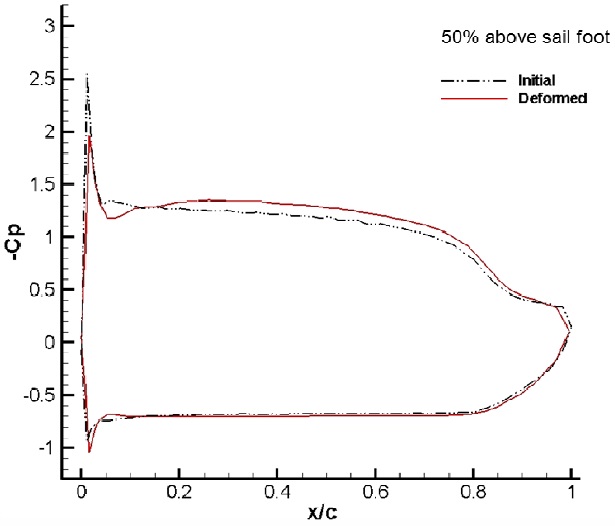
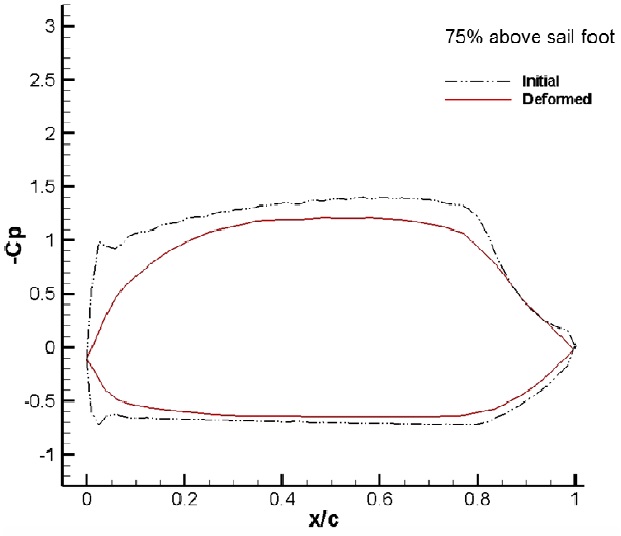
Figs. 16-19 show the dynamic pressure distributions on the sail surface for sections of 5%, 25%, 50%, and 75% sail heights. Fig. 16, for a section of 5% sail height, shows that the negative pressure on the suction side of the deformed sail near its foot is increased compared to the initial pressure in the range of
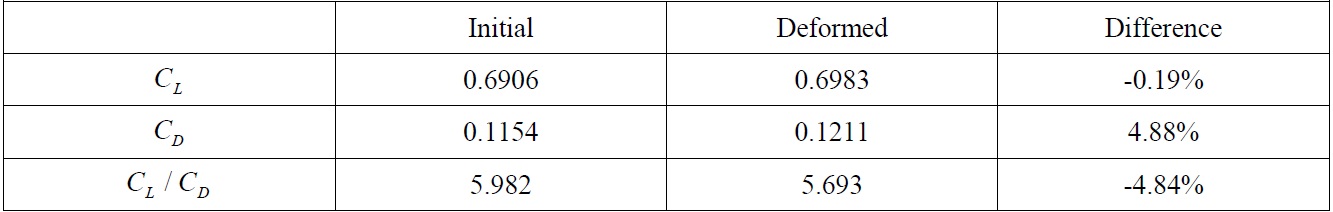
The coefficients of the lift and drag forces are compared to study the changes in the aerodynamic performance of the sail before and after deformation. In the deformed sail, it is assumed that the lift force will increase because the camber of the lower sail, which has a relatively large area, deepens. However, the calculated results show that the drag force increase by ~4.9% and the lift force decreases by ~0.2%, and therefore, the lift-drag ratio indicating the sail performance decreases by ~4.9%. The results in this study conflict with those of Lee et al. (2011), who studied a two-dimensional sail by FSI analysis and showed that the lift force increases with the change in camber. This is because unlike the two-dimensional sail section, the three-dimensional sail generates a partial stall by the separation flow on the leeward side of the lower sail, and the effective angle of attack is reduced by leech sagging on the upper sail. Therefore, the increase in the lift force decreases overall when compared with the increase in the lift force by the deepening camber.
[Table 5] Lift and drag coefficients of the initial and the deformed sails.

Lift and drag coefficients of the initial and the deformed sails.
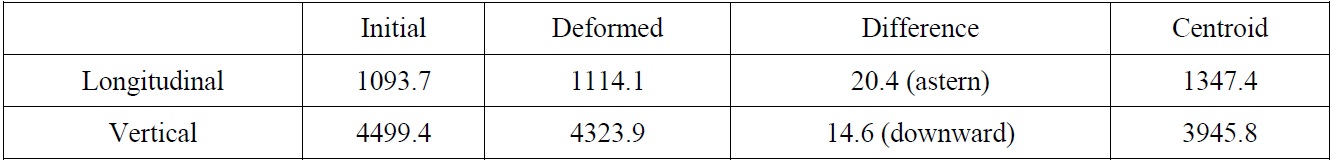
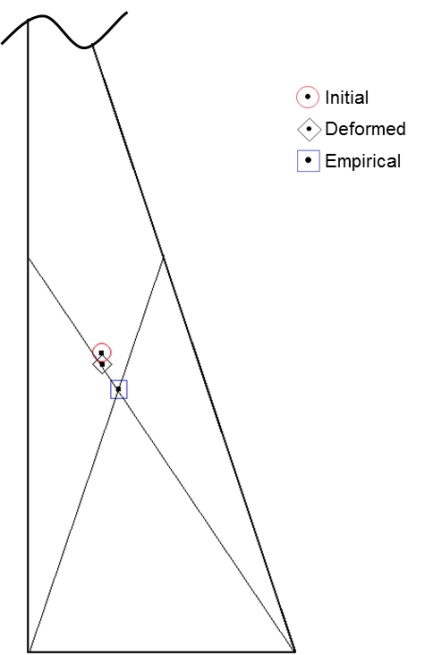
When the sail is deformed, the CE location moves and the yacht loses balance with the center of the lateral resistance, the underwater hydrodynamic force, which results in some forces acting on the yacht. In particular, these forces cause an unintended turning force called as weather helm or thrust deduction. This study examined the change in CE location due to sail deformation. As shown in Fig. 20 and Table 6, the CE locations of the initial and the deformed sails are compared based on the results of an empirical method (Larsson and Eliasson, 2000) in which the centroid of the lateral projected surface is considered as the CE. The CE moves slightly astern and downward, whereas the CEs vary slightly for the initial shape and the deformed sail. The results of CE movement can be interpreted by both a larger lift force on the lower part of the sail and the retreat of the camber center.
[Table 6] Comparison of the CE locations.

Comparison of the CE locations.
In this study, sail deformation under wind pressure is identified by applying the fluid force calculated by CFD to nonlinear finite element analysis. CFD analysis is carried out iteratively on the deformed sail shape, and the shapes of the initial and the deformed sails are reviewed to determine the aerodynamic characteristics. In structural deformation analysis by FEM, fixed boundary conditions are applied to define the supported force by the mast and outhaul, and nonlinear structural analyses are iteratively carried out for the deformed sail shape, which is compared to the shape one in terms of the characteristics of the sail shape.
First, the area of the deformed sail is compared with that of the initial sail to identify the variation cause in the camber shape by the stretching of the sail fabric itself. The variation of the sail area is found to be negligibly small, and the stretching of the fabric under wind pressure is not the main reason for camber change because the area of the deformed sail is increased by 0.001% compared to the initial sail.
Second, the sectional camber shape of the deformed sail for each height of the sail is compared with the initial shape. The cambers near the sail luff are deformed deeper at lower sections, and the maximum draft moves to the leech at higher sections, which is called as sail twisting.
Owing to these changes in the sail camber, the range of positive pressure near the luff and the eddy section resulting from the flow separation is expanded compared to the initial range, the drag coefficient increases by ~4.9%, and the lift coefficient decreases by ~0.2%. These results conflict with those obtained for a two-dimensional sail by FSI analysis. This is because the three-dimensional sail generates a partial stall by the separation flow on the leeward side of the lower sail, unlike the two-dimensional sail section, and the effective angle of attack is reduced by leech sagging on the upper sail; therefore, the increase in lift force decreases overall. Furthermore, the CE location moves slightly astern and downward because of both a larger lift force on the lower part of the sail and the retreat of the camber center.
As a result, the deformation analysis of the three-dimensional sail geometry using FSI indicates that the sail shows complicated flow phenomena such as a change in the effective angle of attack and stalling caused by flow separation owing to the deformation of the camber shape and sail twisting. A comparison of the flow characteristics and the lift and drag forces of the deformed sail shape with those of the initial one shows that a considerable difference exists between the two and that FSI analysis is suitable for application to sail design.