AIS Automatic Identification System
ARPA Automatic Radar Plotting Aids
B Breadth (m)
DCPA Distance to the Closest Point of Approach
IMO International Maritime Organization
Lpp Length between Perpendiculars (m)
NB Negative and Big membership function
NM Negative and Medium membership function
NS Negative and Small membership function
PB Positive and Big membership function
PM Positive and Medium membership function
PMB Positive and Medium Big membership function
PMS Positive and Medium Small membership function
PS Positive and Small membership function
T Draught (m)
TCPA Time to the Closest Point of Approach
V Velocity (knots)
m Mass of ship
Izz Inertia of ship about z axis
U Linear velocity of origin of body axes relative to fluid
δ Rudder angle
η Ratio of u /U
u Component U in direction of the x-axis

Time rate of change of u
v Component U in direction of the y-axis
? Time rate of change of v
r Angular velocity component of the z-axis
? Angular acceleration component of the z-axis
xG Distance of center of gravity from origin of body axes
X Force component along x-axis (longitudinal force)
Y Force component along y-axis (lateral force)
N Yawing moment
The number of elements which should be considered by a navigator to avoid ship collisions is increasing, due to the increasing diversity of vessel types, sailing of high speed vessels, and increasing number of ships. As a result, the incidence of collision accidents due to wrong decisions by navigators has steadily increased. When collision accidents of a ship occur, the loss of human life and property and the damage due to environmental pollution are potentially large. Because there is a high risk of collision accidents between ships, it is necessary to develop a collision avoidance system, in order to assist navigators in ensuring sailing safety.
Many kinds of collision avoidance algorithms which are based on the ship domain concept proposed by Fujii and Tanaka (1971), fuzzy reasoning model proposed by Iwasaki and Hara (1986) and differential game method proposed by Miloh (1974) have been developed. Briefly, they can be divided into four categories. Firstly, the indices to determine the time for starting the collision avoidance maneuver are defined, and methods to infer the indices are proposed. Collision risk, which is based on DCPA and TCPA information, was proposed by Iwasaki and Hara (1986). Collision risk refers to the subjective judgment on the degree of risk by the watch officer in the encounter situation. Secondly, simulations to obtain collision avoidance trajectories have been performed by considering ship dynamics, where the inferred indices are used to judge the time for starting the collision avoidance maneuver. Fuzzy control, which is based on human control characteristics, has been proposed by Hasegawa (1987). Thirdly, optimizations of the avoidance paths have been performed. Lee and Rhee (2001) applied an A* search algorithm for finding an optimal path. Fourthly, an intrinsic problem in the existing collision avoidance algorithms is recognized by some researchers when the own ship encounters the burdened target ship which is faster than own ship and uncontrollable. Miloh and Sharma (1975) defined this problem as the slower ship’s dilemma. At sea, to ensure safety of own ship, her course needs to be changed, if burdened target ship cannot change her course. These emergency cases are known as critical collision conditions. The slower ship’s dilemma occurs under the critical collision conditions when the target ship is faster than own ship. To solve the dilemma, Miloh and Sharma (1975) proposed the longer barrier, which is used for determining the time to start the collision avoidance maneuver, in these critical collision conditions. Since then, the slower ship’s dilemma is also perceived by Perera et al. (2011).
Simulations have been performed at different encounter situations with various speed conditions, to improve the reliability of the collision avoidance algorithm proposed by Lee and Rhee (2001). The results show that the collision risk according to Lee and Rhee’s (2001) inference method is not able to consider the slower ship’s dilemma under critical collision conditions, because it is not possible to consider an uncontrollable target ship by using a combination of DCPA and TCPA. It is necessary to fix the fault in the collision avoidance algorithm.
In this paper, the concept of a new index, based on numerical simulation by considering own ship’s maneuverability, is proposed to fix the intrinsic fault of the collision avoidance algorithm (2001). The new index is objectively obtained to avoid using the empirical method. The time at which the collision avoidance maneuver should be started is inferred and determined by considering the various encounter situations, maneuverability and speed loss. The new index is called the collision ratio, which refers to the expected ratio of unavoidable paths to total paths under suitably characterized operational conditions. Total paths are determined by considering action categories, such as action space and methodology of avoidance. The International Regulations for Preventing Collisions at Sea (1972) and Cockcroft and Lameijer (2001) are considered to determine the action categories. When own ship follows each avoidance path, we ascertain whether or not a collision accident actually occurred, by calculating the relative positions of the own ship and the target ship. A constant speed model denotes that the position of the own ship is determined by multiplying the initial speed of own ship and time interval △t without considering the own ship’s dynamics. In a simulated speed model, however, the position of the own ship is determined by solving maneuvering equations of motion, and fuzzy control is applied to determine the command rudder angle to follow the avoidance path. The speed loss of the own ship can be considered in the simulated speed model. Time histories of the collision ratio based on the simulated speed model are compared with those based on the constant speed model at different encounter situations. Time histories of the collision ratio according to the methodology of avoidance are analyzed. Finally, the time histories of the collision ratio are compared at different encounter situations for different speed conditions. From these results, the concept of a new index, which can overcome the slower ship’s dilemma and different encounter situations, is proposed.
COLLISION RISK BASED ON FUZZY INFERENCE METHOD
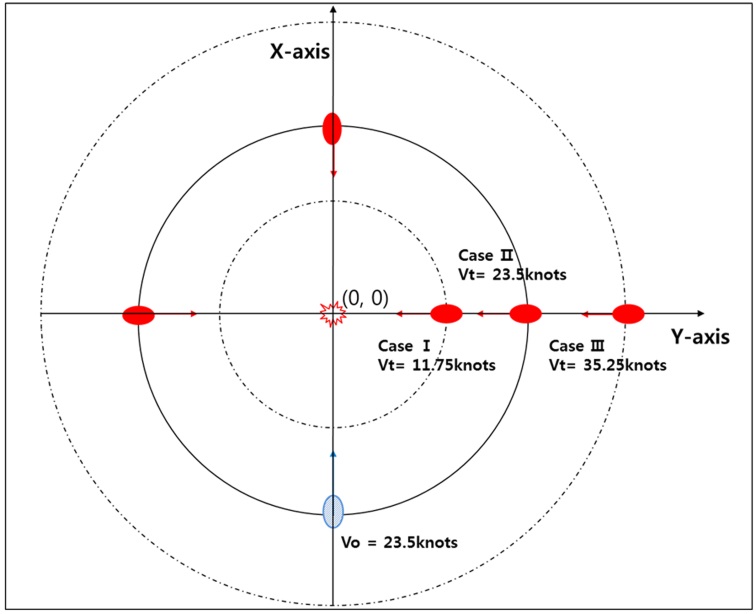
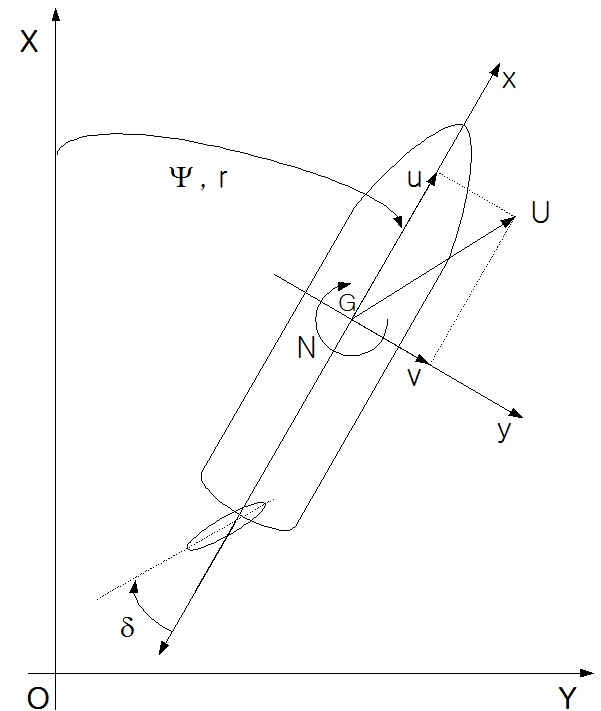
Fig. 1 shows coordinate systems used in this study. Simulations are performed to identify the limitations of the inferred collision risk based on the fuzzy inference method of Lee and Rhee (2001). This is calculated at different encounter situations such as head-on, crossing (own ship is the give-way vessel) and crossing (own ship is the stand-on vessel) situation. The target ship is assumed to be a cruise ship similar to the own ship, and has the same length (
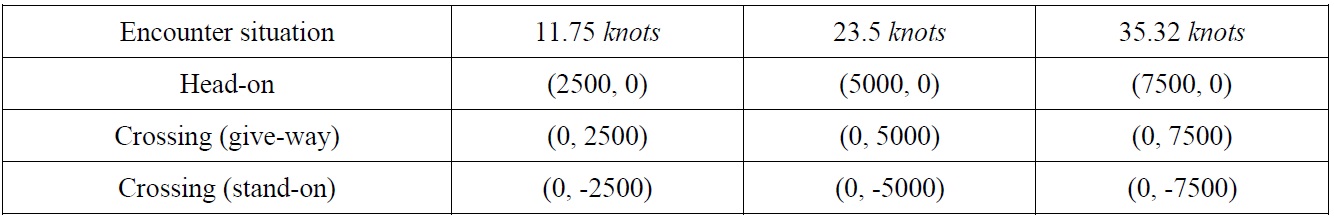
[Table 1] Initial positions of the target ship.

Initial positions of the target ship.
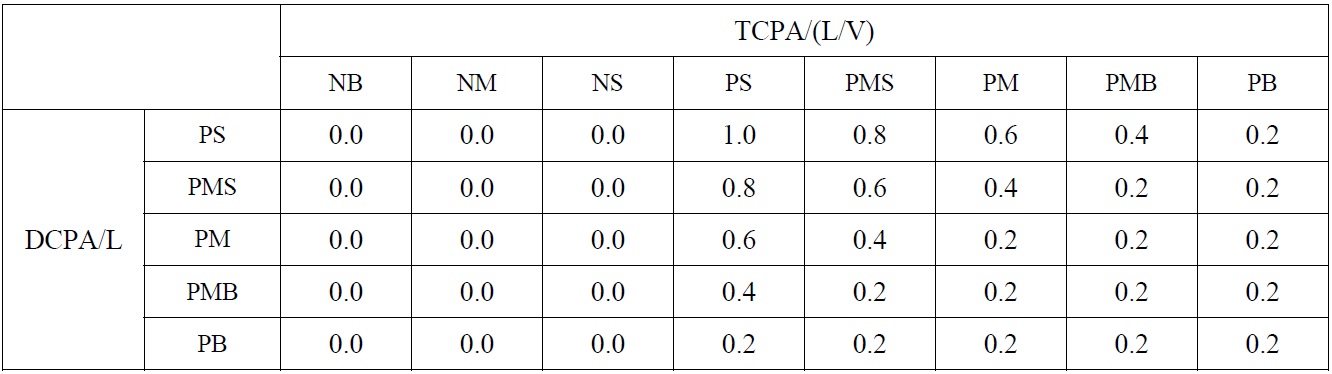
[Table 2] Reasoning rules for the collision risk.

Reasoning rules for the collision risk.
Non-dimensional DCPA and TCPA membership functions proposed by Lee and Rhee (2001) are used to infer the collision risk. However, all negative values in the reasoning rules are set to zero, as shown in Table 2. If TCPA is less than zero, it is judged that own ship never collides with the target ship using the fuzzy inference method. According to Table 2, the collision risk is inferred from 0.0 to 1.0.
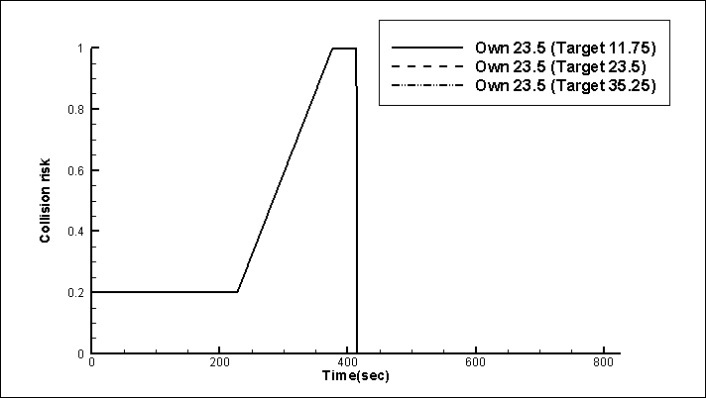
Fig. 3 shows the time histories of the collision risk at head-on situations with different target ship speeds. It can be seen that all of the time histories of the collision risk at head-on situations are the same. Fig. 4 shows the time histories of the collision risk at crossing situations with different target ship speeds. “Give-way” is the status of the own ship. In this encounter situation, according to the collision avoidance rules (2001) own ship should avoid the target ship. It can be seen that all of the time histories of the collision risk at crossing (give-way) situations are the same. Fig. 5 shows the time histories of the collision risk at crossing situations with different target ship speeds. “Stand-on” is the status of the own ship. In this encounter situation, according
to the collision avoidance rules, the target ship should avoid own ship. It can be known that all the time histories of the collision risk at crossing (stand-on) situations are the same.
And Figs. 3,4 and 5 show identical time histories of the collision risk because the collision risk is inferred from the combination of DCPA and TCPA. Consequently, it can be concluded that collision risk based on the fuzzy inference method is not able to consider critical collision conditions. So, it is impossible to overcome the slower ship’s dilemma.
DEFINITION OF THE COLLISION RATIO AND INFERENCE PROCEDURE
>
Definition of the collision ratio
The collision ratio is defined as the expected ratio of unavoidable paths to total paths under suitably characterized operational conditions. The action space is regulated according to the collision avoidance rules (2001). The number of total paths is 90. And each path is from current heading angle to ±90
>
Inference procedure of the collision ratio
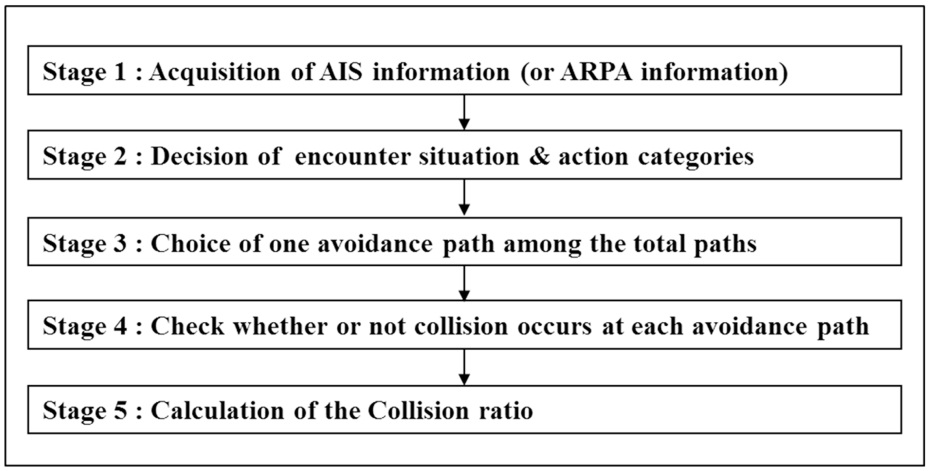
Five stages are involved in inferring the collision ratio as shown in Fig. 6. In Stage 1, the information of the target ship is acquired from an Automatic Identification System (AIS) or Automatic Radar Plotting Aids (ARPA) device. It is assumed that the position, speed and heading angle of the target ship are deterministic values.
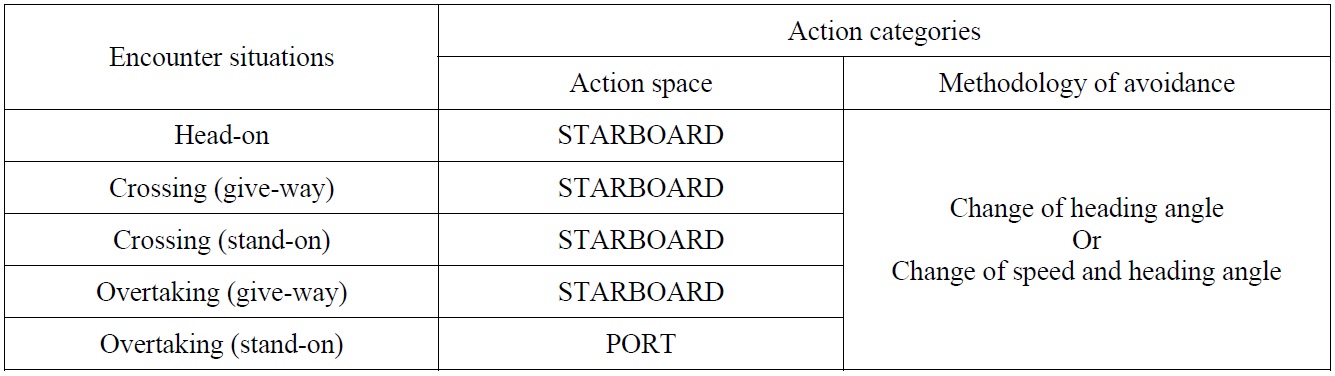
In Stage 2, action categories such as action space and methodology of avoidance are determined, according to the encounter situation. Firstly, encounter situations are classified based on the expert system used in the research of Lee and Rhee (2001). This classification is developed from the categories of encounter situation proposed by Koyama and Yan (1987). Table 3 shows the action categories according to encounter situations. The action space in Table 3 means avoidable direction of own ship according to the International Regulations for Preventing Collisions at Sea (1972) and the collision avoidance rules (2001). At head-on and crossing (give-way) situations, own ship is burdened. Accordingly, her course should be changed to the starboard side. On the other hand, own ship is not burdened at crossing (stand-on) and overtaking situations. Nevertheless, the course of own ship needs to change to ensure its safety, if the course of the burdened target ship cannot be changed. According to the collision avoidance rules (2001), at a crossing (stand-on) situation, the course of the own ship should not be changed to her port side. The own ship should change her course to the starboard side. However, the course of the own ship can be allowed to change to the port side, in an overtaking situation under critical collision condition. The paths range from current heading angle to ±90
[Table 3] Action categories according to encounter situations.

Action categories according to encounter situations.
The methodology of avoidance refers to how to avoid the target ship, of which there are two methods. The first method involves only changing the heading angle. The second method involves changing both the speed and heading angle of the own ship. At sea however, many navigators would prefer to avoid target ships by only changing their heading angle. The effect of the methodology of avoidance on the collision ratio will be shown in this paper, and the reason why navigators try to avoid target ships by only changing the heading angle will be explained as shown in Figs.12 to 14.
The number of total paths is 90. And each path is from current heading angle to ±90
MODEL SHIP AND MANEUVERING EQUATIONS OF MOTION
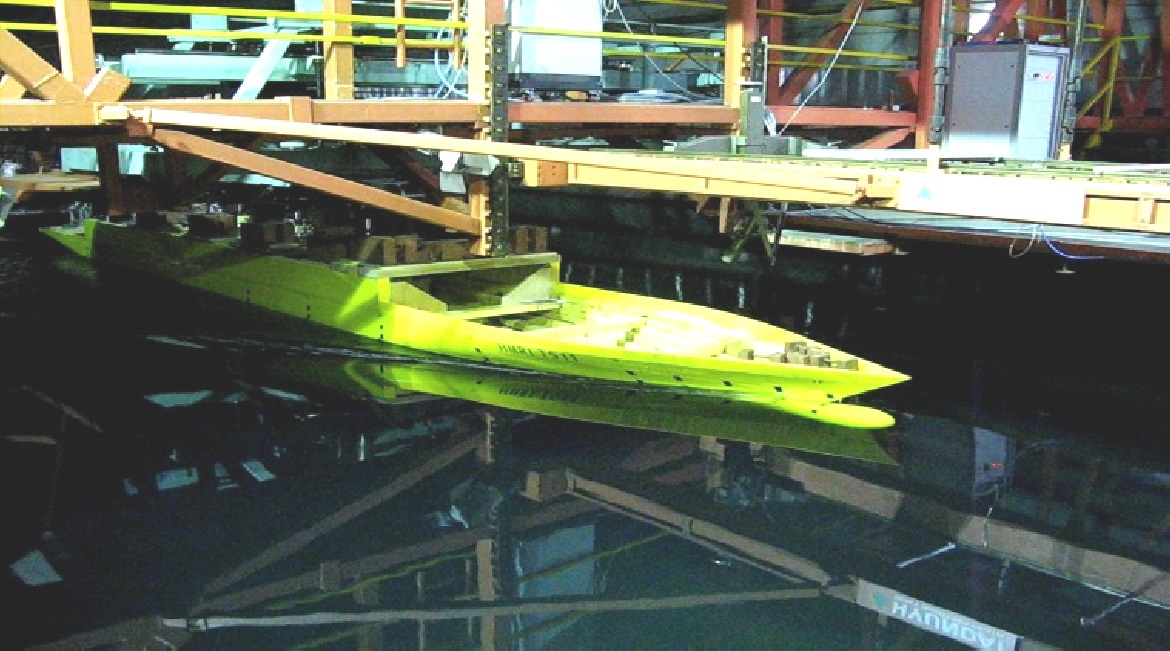
A model cruise ship is used to estimate the maneuverability of the own ship, as shown in Fig. 7. The principal properties and design speed of the cruise ship are shown in Table 4. The scale ratio of the model ship is 1/28. The maneuvering equations of motion for the model cruise ship are shown in Eq. (1).
[Table 4] Principal properties of cruise ship.

Principal properties of cruise ship.
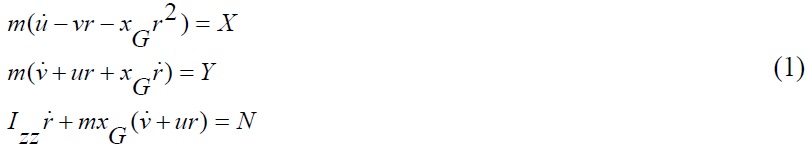
3-Degree of Freedom (D.O.F.) maneuvering equations for surge, sway and yaw are used. Each hydrodynamic derivative at 23.5 and 11.0
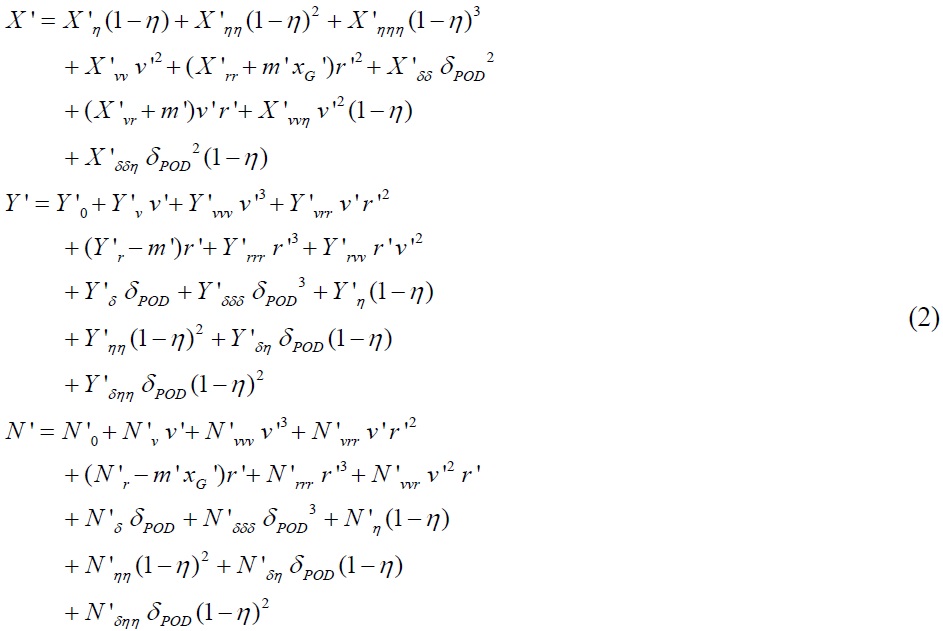
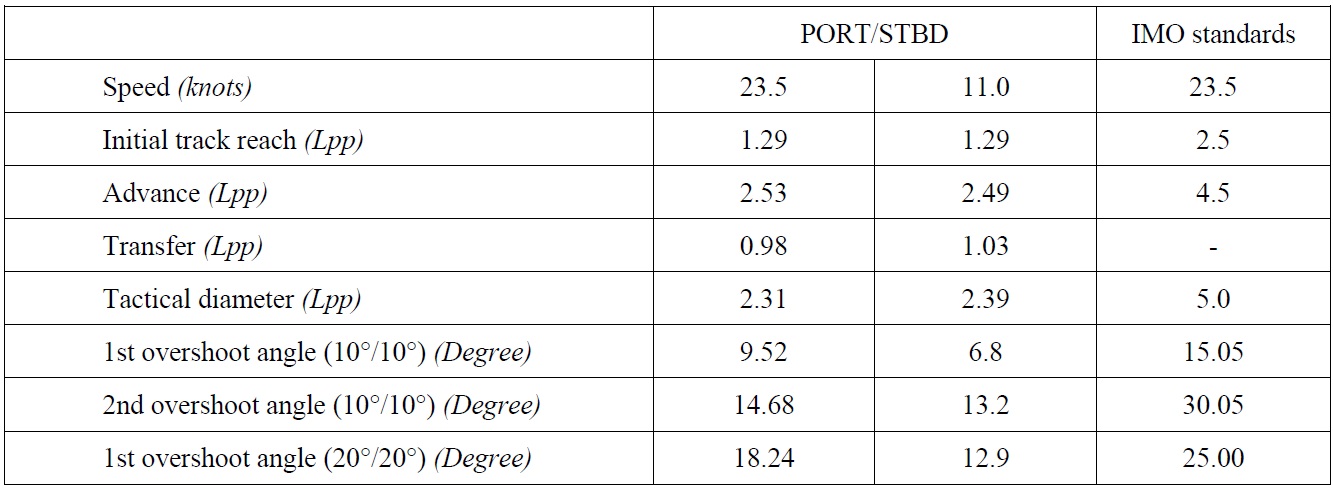
Maneuvering simulation results at different speeds by using Eqs. (1) and (2) are shown in Table 5. In addition, maneuvering simulation results at the design speed are compared with International Maritime Organization (IMO) maneuvering standards. The maneuverability of the own ship meets all the IMO maneuvering standards at the design speed, and the model cruise ship has very high maneuverability. Table 5 shows that small differences exist according to speeds. In this study, it is assumed that the maneuverability of the own ship is the same as that at the design speed, even if there is a speed loss when the course of the own ship is changed.
[Table 5] Maneuvering simulation results of the model ship and IMO maneuvering standards.

Maneuvering simulation results of the model ship and IMO maneuvering standards.
>
Effect of constant speed model and simulated speed model on the collision ratio
Simulations are performed to calculate the effect of the constant speed model and simulated speed model on the collision ratio at different encounter situations such as head-on, crossing (give-way) and crossing (stand-on) situations. The own ship always moves from (-5000,0) to (5000,0) at 23.5
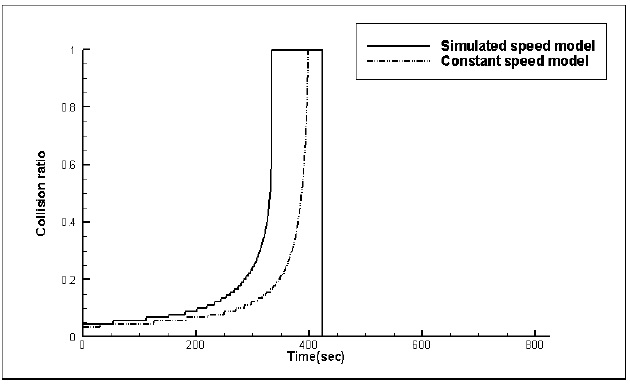
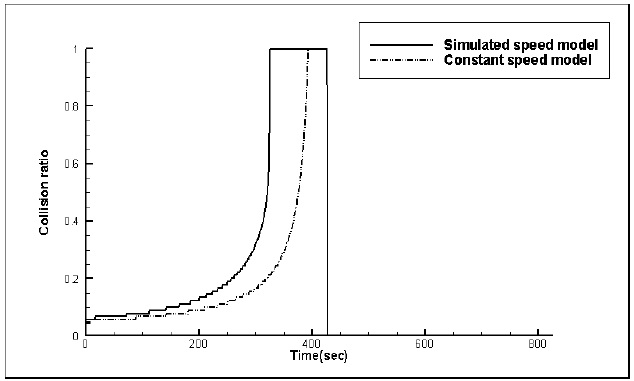
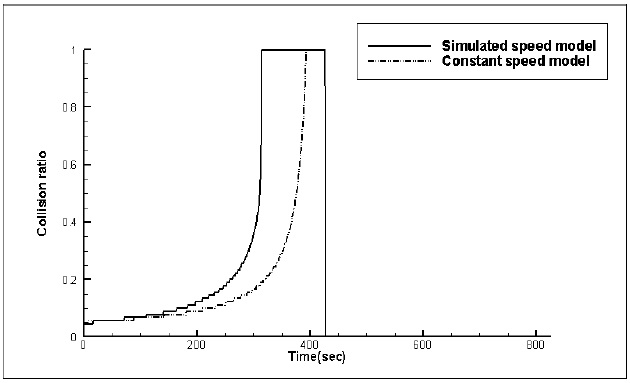
Figs. 8,9 and 10 show the time histories of the collision ratio at head-on, crossing (give-way) and crossing (stand-on) situations respectively, when both the constant speed model and simulated speed model are used. A collision ratio of 1.0 means that the own ship cannot avoid the target ship, even if own ship follows any path from 0
By analyzing Figs. 8,9 and 10, two common characteristics can be described. Firstly, the collision ratio rapidly increases as the own ship closely approaches the target ship. This means that the number of safe avoidance paths is rapidly reduced when the own ship closely approaches the target ship. This has a relation with the slow dynamic characteristics of the ships. In other words, when the rudder angle of own ship is changed, its heading angle cannot be changed simultaneously. Secondly, the collision ratio based on the simulated speed model becomes 1.0 earlier than when the collision ratio is based on the constant speed model. For the head-on situation, the collision ratio of 1.0 is reached at 334
These are derived from the assumption of the constant speed model: because the own ship is assumed as a vector without considering its dynamics, it can immediately follow the avoidance path in the constant speed model with constant speed. In reality, it takes more time to follow the path, and own ship’s speed is dropped when own ship changes her course. Consequently, it should be necessary to consider the own ship’s dynamics to consider the maneuvering characteristics such as speed loss.
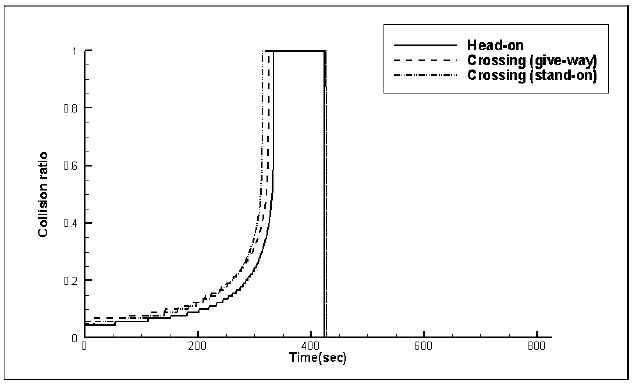
Fig. 11 shows the time histories of collision ratio at head-on, crossing (give-way) and crossing (stand-on) situations, based on the simulated speed model. The collision ratios based on the constant speed model only are slightly different according to encounter situations. On the other hand, the collision ratios based on simulated speed model are 1.0 at 334
>
Effect of methodology of avoidance on the collision ratio
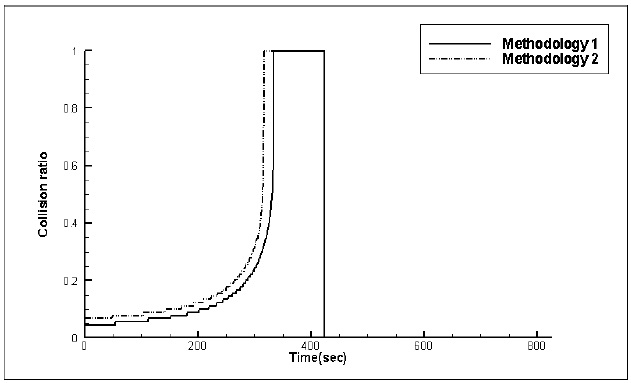
Simulations are performed to calculate the collision ratio according to the methodology of avoidance at different encounter situations. In methodology 1, only the heading angle of the own ship is only changed. In methodology 2, both the heading angle and speed are changed. The own ship always moves from (-5000,0) to (5000,0) at 23.5
Figs. 12,13 and 14 show the time histories of the collision ratio at head-on, crossing (give-way) and crossing (stand-on) situations respectively according to the methodology of avoidance. For head-on situations, the own ship becomes slightly dangerous because more time is needed to escape from the target ship’s path since own ship’s speed has slowed. For two crossing situations, the collision ratios are significantly different to that for a head-on situation. When the own ship is remote from the target ship, reducing own ship’s speed is a more convenient way to keep a safe distance, so the collision ratio is zero at an early stage. In reality however, it can cause a wrong decision, rendering a late collision avoidance maneuver. When the own ship closely approaches the target ship, the collision ratio rapidly increases. This reduces the ability for the own ship to avoid the target ship, because the own ship cannot easily escape from the target ship’s path. Consequently, because of these problems, speed reduction is not considered in determining the time to start the collision avoidance maneuver.
>
Effect of the encounter situations on the collision ratio
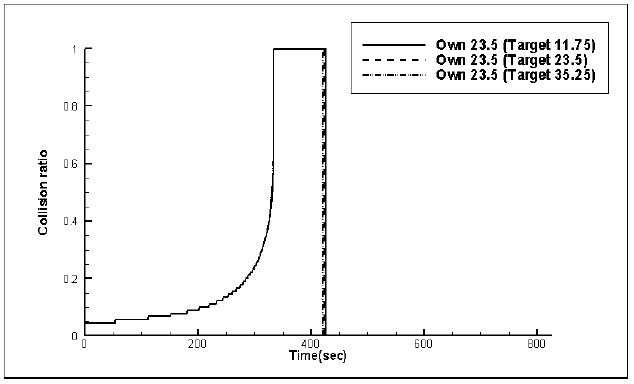
Simulations are performed to calculate the collision ratio at different encounter situations such as head-on, crossing (giveway) and crossing (stand-on) situations, for different speed conditions. The own ship always moves from (-5000,0) to (5000,0) at 23.5
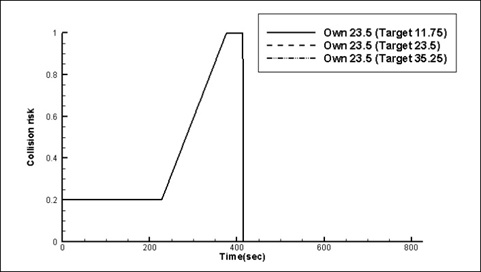
Figs. 15,16 and 17 show the time histories of the collision ratio at head-on, crossing (give-way) and crossing (stand-on) situations respectively, for different speed conditions. For head-on and crossing (give-way) situations, the collision ratio is almost the same, where these results show that the collision ratio is not advantageous if the own ship is burdened. No significant differences are shown. For crossing (stand-on) situations, the collision ratio is different significantly as the target ship’s speed is increased. Ratios of 11.75, 23.5 and 35.25
A new index, termed as the collision ratio, is proposed based on the consideration of ship dynamics, while results which are based on both the constant speed model and the simulated speed model are analyzed. The collision ratio according to the methodology of avoidance is also analyzed. The collision ratio at various encounter situations for different speed conditions is also obtained and analyzed. In this study, three conclusions are found.
Firstly, it is necessary to use the simulated speed model to consider the maneuvering characteristics such as maneuverability and speed loss. The constant speed model is advantageous to decrease calculation time, but it cannot consider the speed loss of the own ship when the course of own ship is changed. In real sailing, this can result in a late decision to avoid the target ship because the ability of the own ship to avoid the target ship can be overestimated.
Secondly, the collision avoidance by reducing own ship’s speed is disadvantageous. When the own ship closely approaches the target ship, the collision ratio rapidly increases. It also causes the late collision avoidance maneuver. The consideration of speed reduction is not considered in determining the time to start collision avoidance maneuver.
Thirdly, the collision ratio can overcome the slower ship’s dilemma and the different encounter situations. In addition, empirical functions are not necessary to consider the slower ship’s dilemma.