Cyclones occur for a period of about three months in Australia’s Northwest region. However, they approach once or twice in a year in the area. Otherwise, the marine environment is rather mild. Hence, a disconnectable turret mooring (DTM) system is desirable and useful in this environment. The objective of this study is to provide a methodology for numerical modeling of the floating structure, spider buoy, and various components with a focus on disconnect and reconnect operations. The important parameters related to extending mooring-lined tidal current power (TCP) technology to deep water are also discussed.
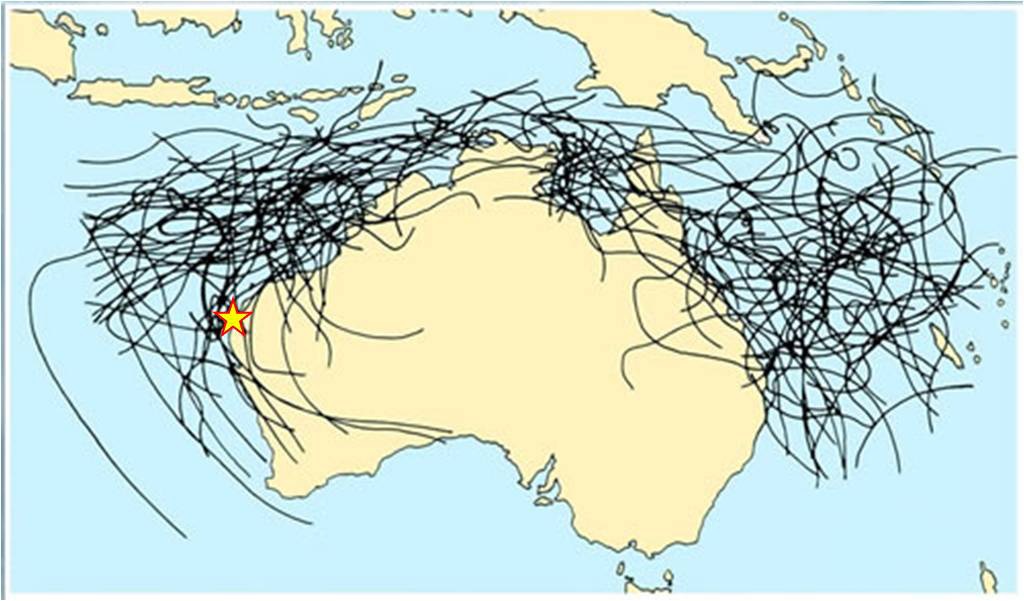
Fig. 1 shows a Stybarrow field located in Northwestern Australia. This area has extensive gas reserves and, except for the cyclone environment in the early summer, has a mild marine environment. The directions of cyclones are shown in Fig. 1. The cyclones are unpredictable and can last from a few days to two or three weeks.
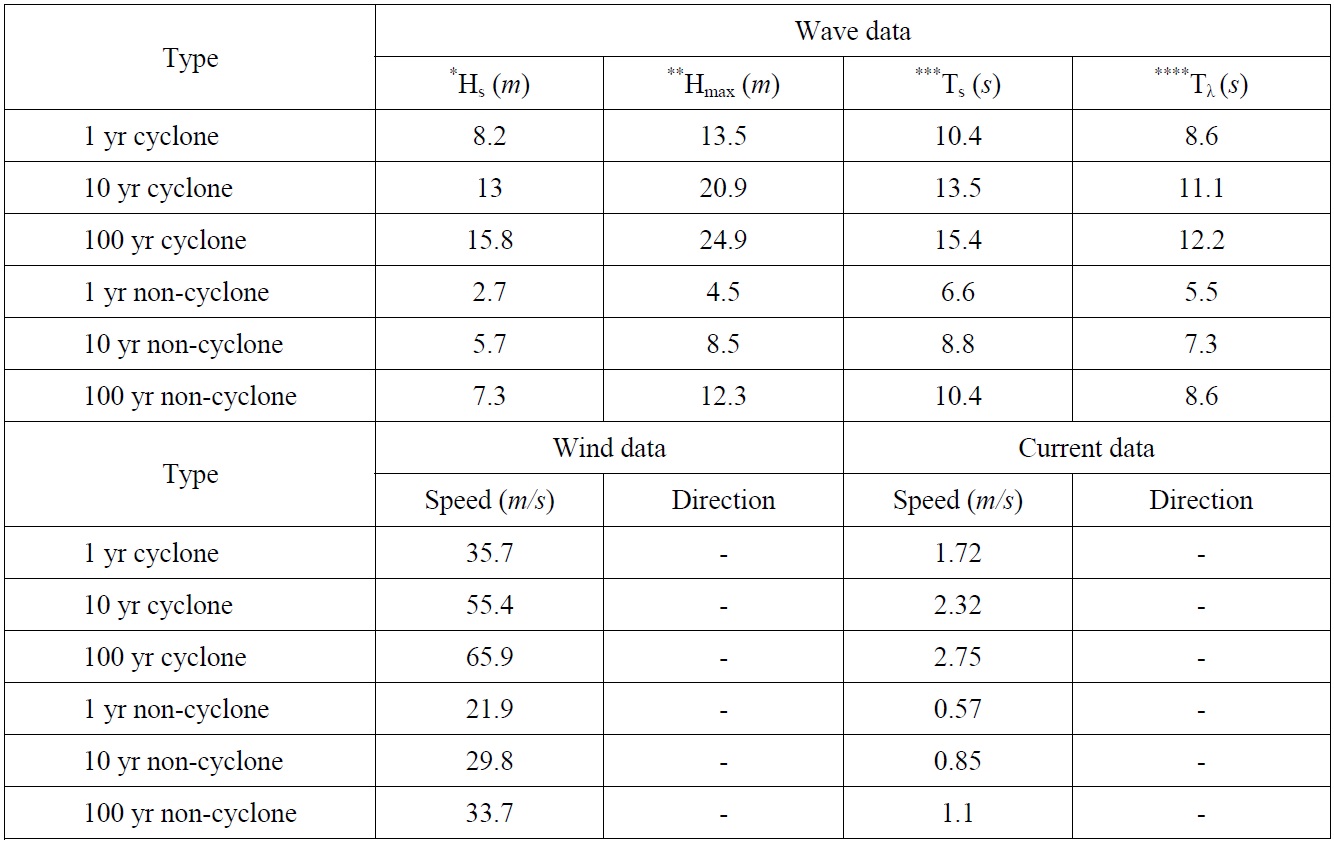
In the analysis, the marine environments were separated into cyclone and non-cyclone categories. Cyclone data were selected from 100 years of marine environment surveys (Duggal et al., 2007). The cyclone and non-cyclone data for the Stybarrow field are shown in Table 1 (Yang et al., 2010).
[Table 1] Stybarrow field environmental conditions.

Stybarrow field environmental conditions.
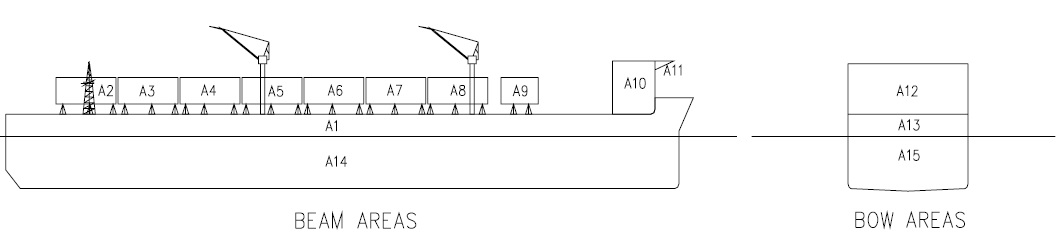
In the modeling process, the floating structure (except for the superstructure) was modeled. Therefore, the wind coefficients of the superstructure were calculated to indicate wind force, depending on the direction of wind. Fig. 2 shows the superstructure conception of the floating structure, and Table 2 gives the projected area of the superstructure.
[Table 2] Projected area of superstructure.
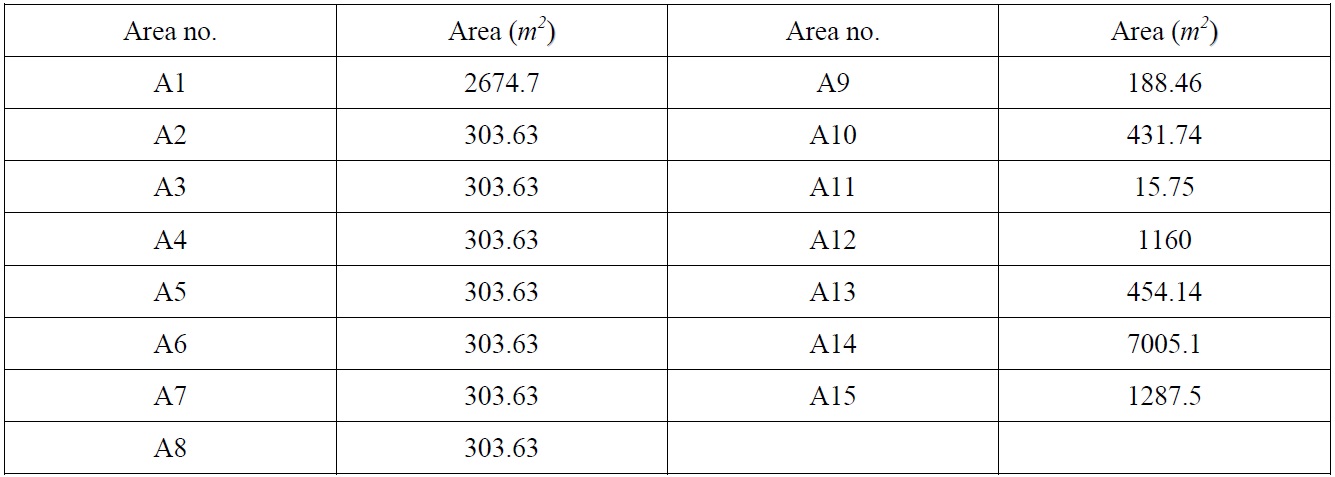
Projected area of superstructure.
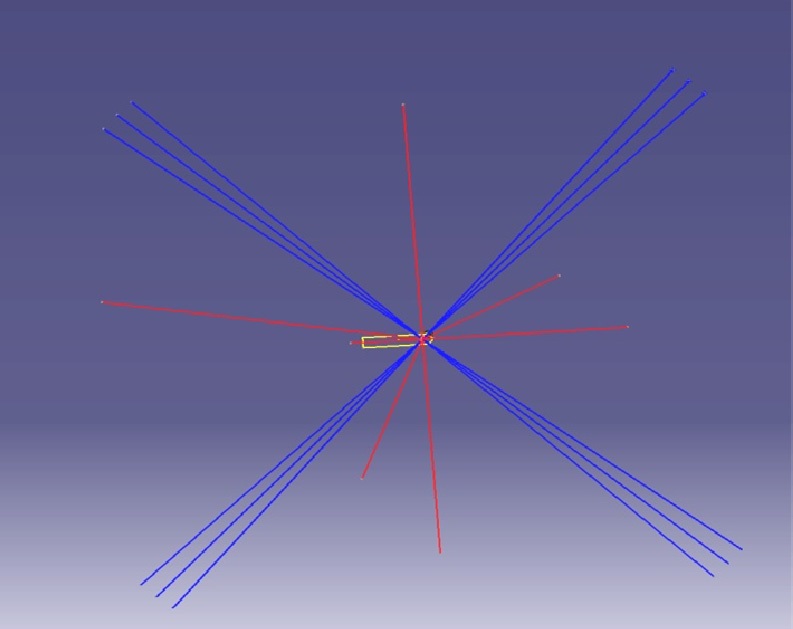
A four-point mooring concept consists of a combination of four lines of chain and wire. The models of Santos Mutineer- Exeter for a disconnectable FPSO, introduced by Duggal et al. (2007), were used in this study. The chain was modeled as R4- RQ4 studless chain. A mooring line safety factor of 2.0 and a dynamic factor of 1.67 (API, 1998) were used in the numerical analysis. Production riser filled with water and crude oil, and water injection risers filled with sea water were modeled. Fig. 3 shows a layout of the mooring line and riser (the blue line is mooring line and the red line is the riser).
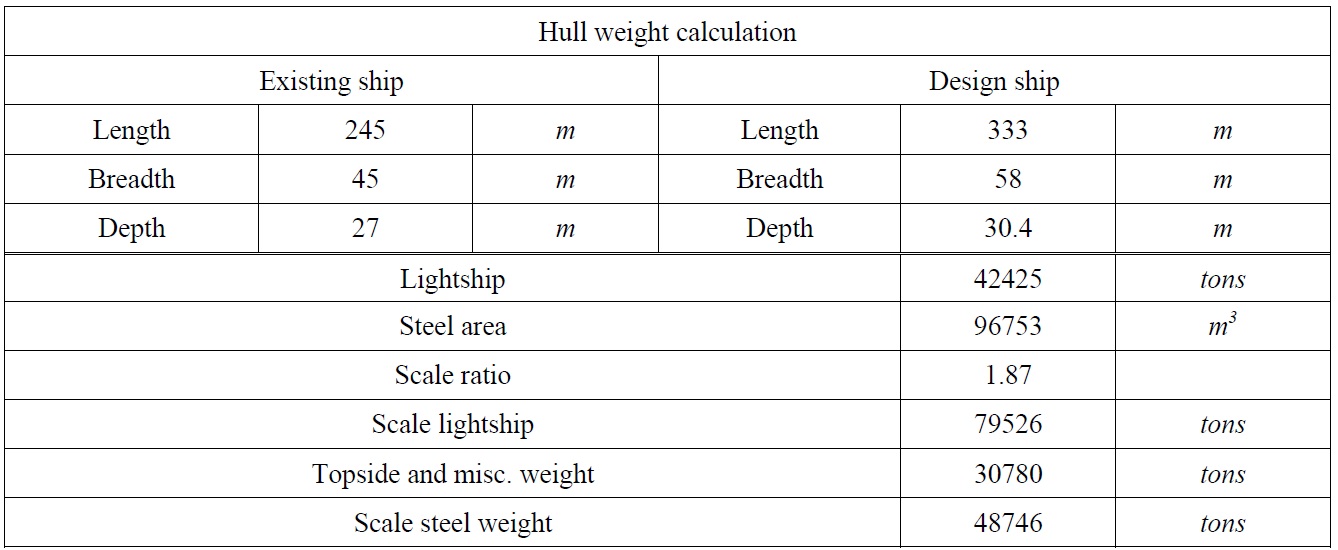
The floating structure and spider buoy were designed based on the Nanhai Endeavour FPSO that is currently being applied in the South China Sea. Fig. 4 shows a redesigned model based on the standard model, and Table 3 shows standard model data and redesign model data.
[Table 3] Hull weight calculation.

Hull weight calculation.
>
Response amplitude operator (RAO)
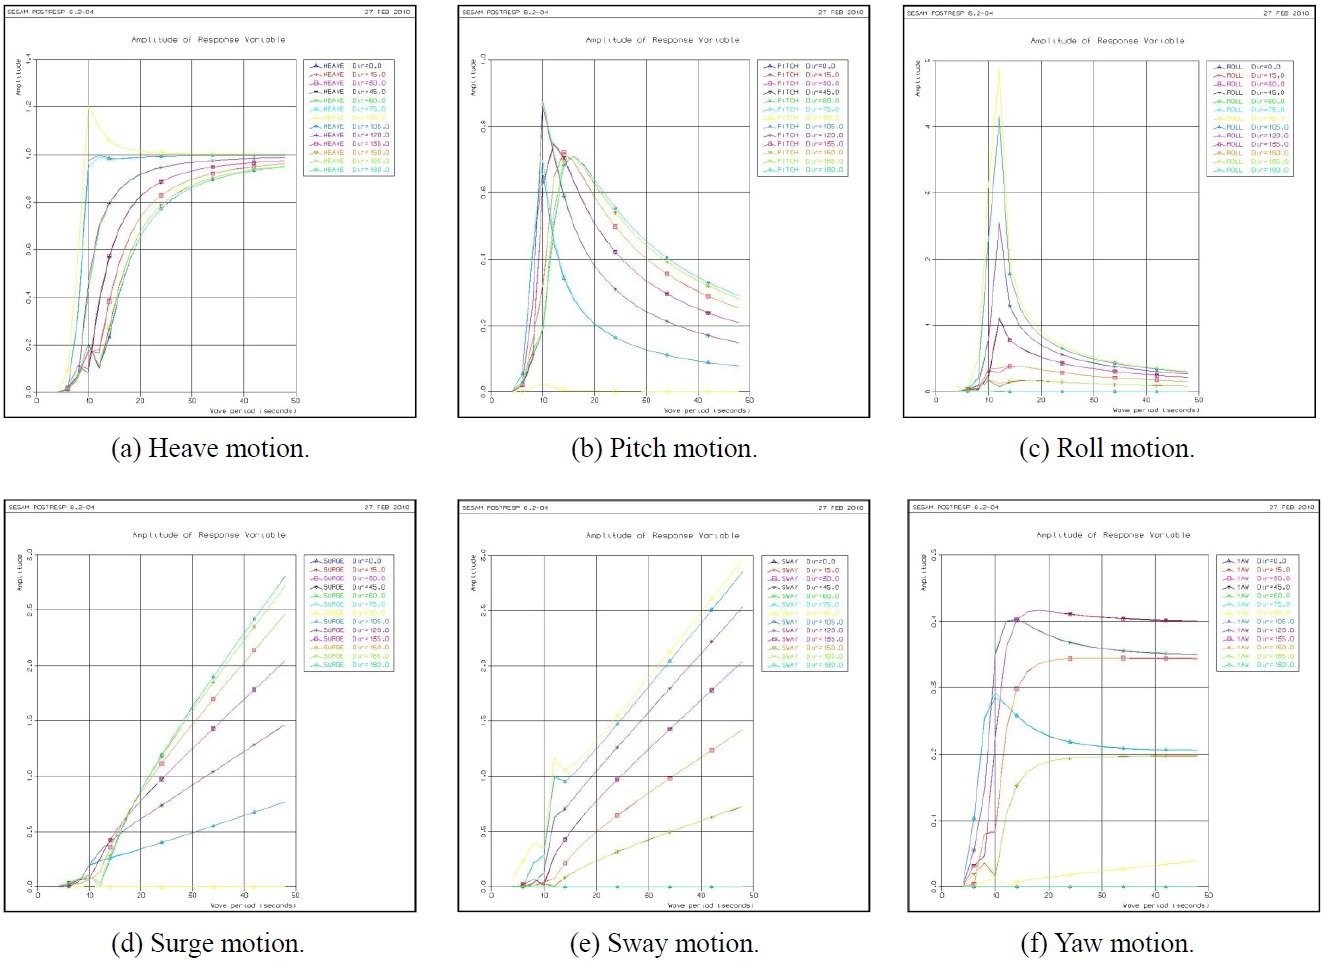
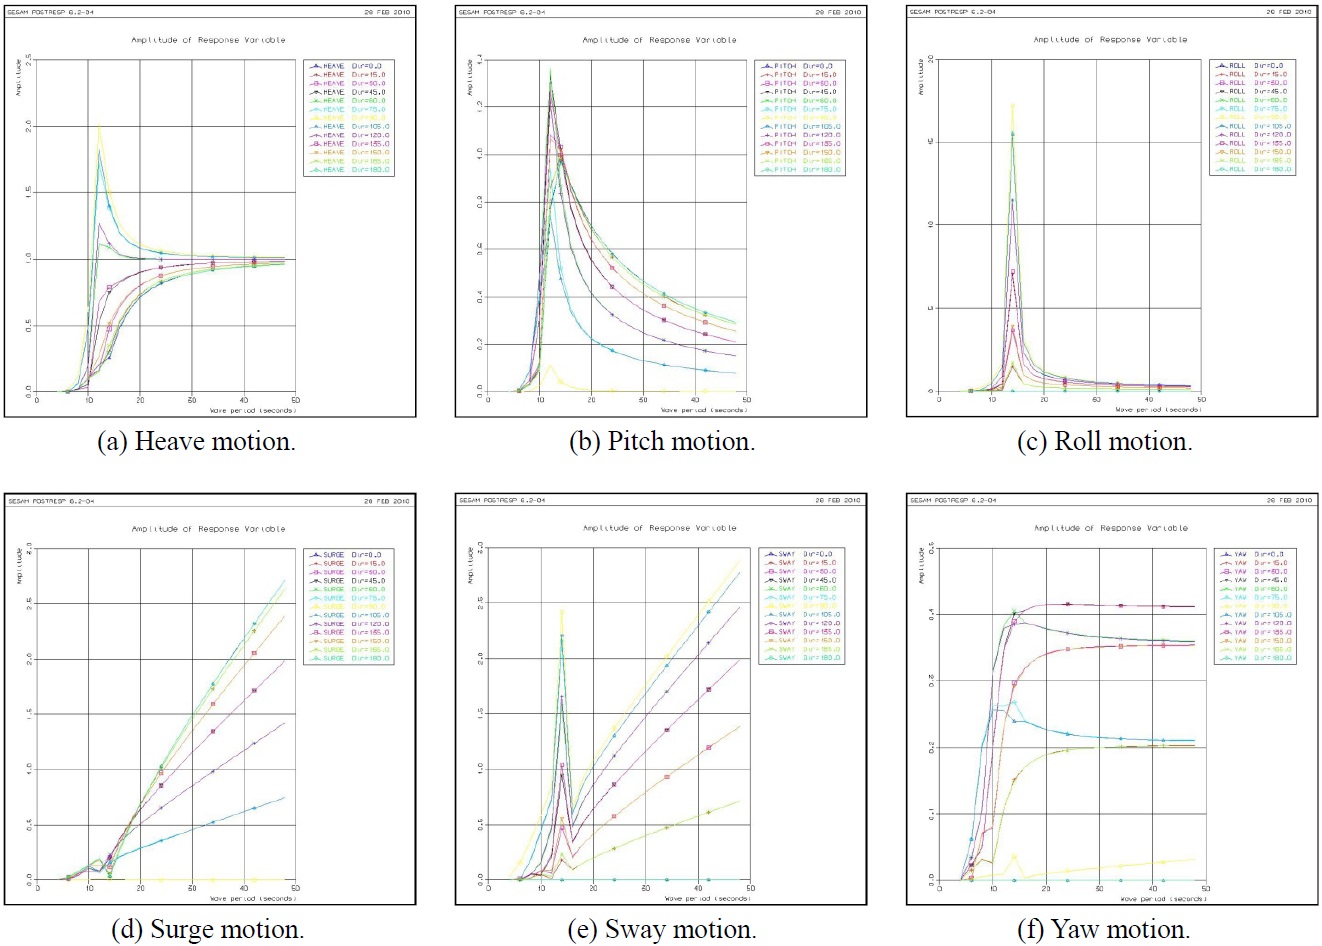
Hydrodynamic analysis was carried out using HydroD wadam from the model, generated using GeniE, HydroD and DeepC commercial software named Sesam™ from Det Norske Veritas (DNVs, 2008). The analysis cases used a 20% loading condition and a full loading condition. Fig. 5 and Fig. 6 indicate the results for heave, pitch, roll, surge, sway, and yaw for the 20% load and full load cases, respectively.
Previous studies have been focused on analysis of the anchored mooring motion of ships (Jung, 2002) or an FPSO moored at a pier (Na et al., 2004). In this study, the DTM system was applied to determine the safety conditions of the risers and mooring lines, as per the design loading conditions, considering the wave and wind directions.
Static analyses were performed based on the following vessel offset position cases: mean, near, far, and transverse (DNVs, 2001). In addition, full loading and ballast loading vessel conditions were investigated together with empty and filled riser conditions. To calculate the wave load, the JONSWAP 3 spectrum was used with NPD profile for wind load (Journee, 2001). Table 4 shows the static and dynamic conditions.
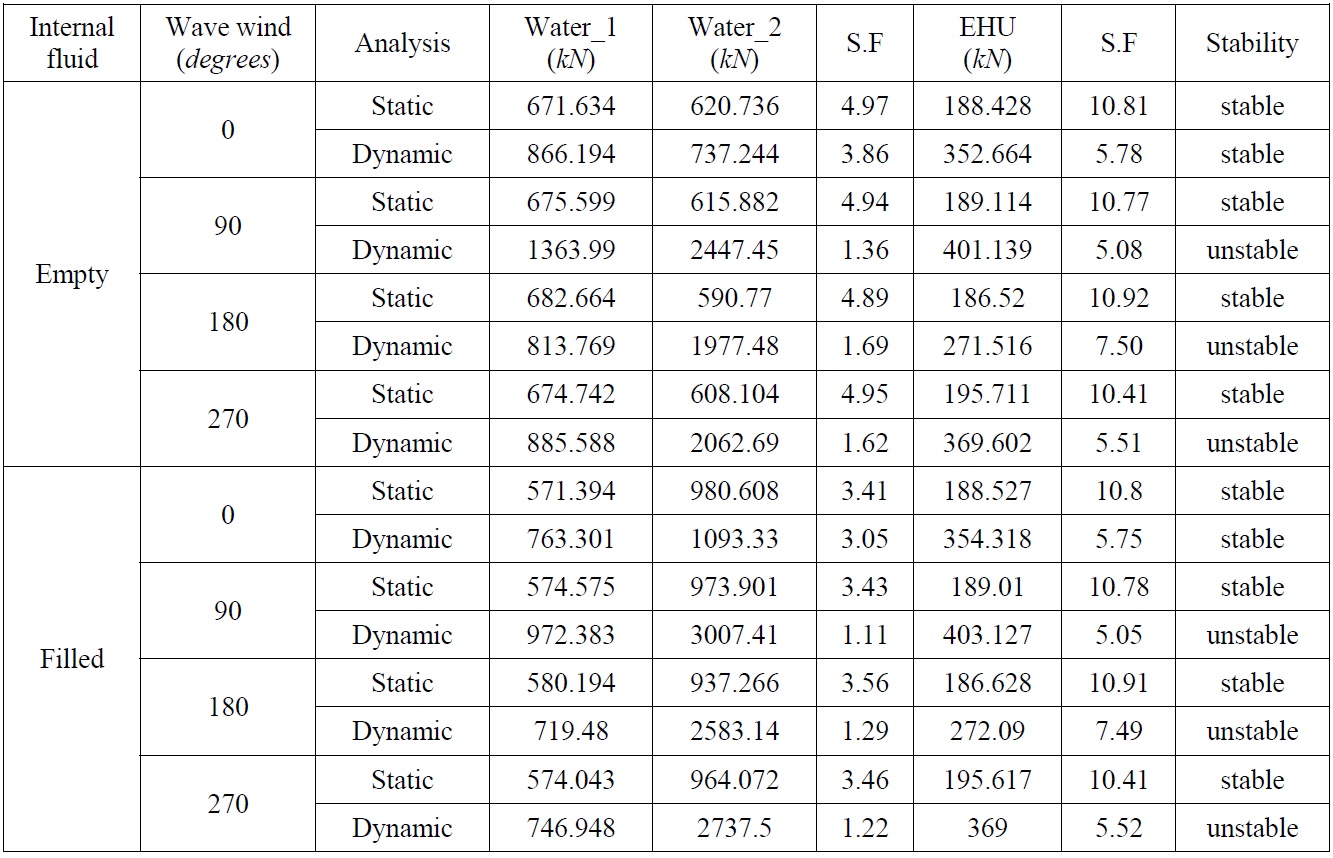
A mooring line assessment was performed based on an ABS reference factor of safety for anchoring line safety (ABS, 1993). The riser safety factor for the breaking load stability was assessed by applying 2. Tables 5-8 show the static and dynamic analysis results and safety factors for a cyclone environment. Table 5 shows that the mooring line and riser results depend on the presence of a floating structure. For a safety factor greater than 2.0, the results were considered to be safe for the static case. The dynamic safety factor was found to be 1.67. Table 6 shows the static and dynamic results for a cyclone environment. Mooring lines 1, 4, 7, and 10 were all safe regardless of the existence of the internal fluid. However, production risers exhibited a relatively large tension value for the same analysis case. Also, for angles of incidence of 90° and 270°, very large tension values occurred that produced an unsafe condition compared with other cases. Table 6 shows static and dynamic analysis results for the water riser and electro-hydraulic umbilical (EHU). In this result, except for a 0° angle of incidence, greater tension in all directions was determined to be an unsafe condition for static and dynamic results. Table 7 and Table 8 show results for a buoy disconnected from the floating structure in a cyclone situation. After the buoy separated from the floating structure, buoy sunk to 25
[Table 4] Analysis load cases.
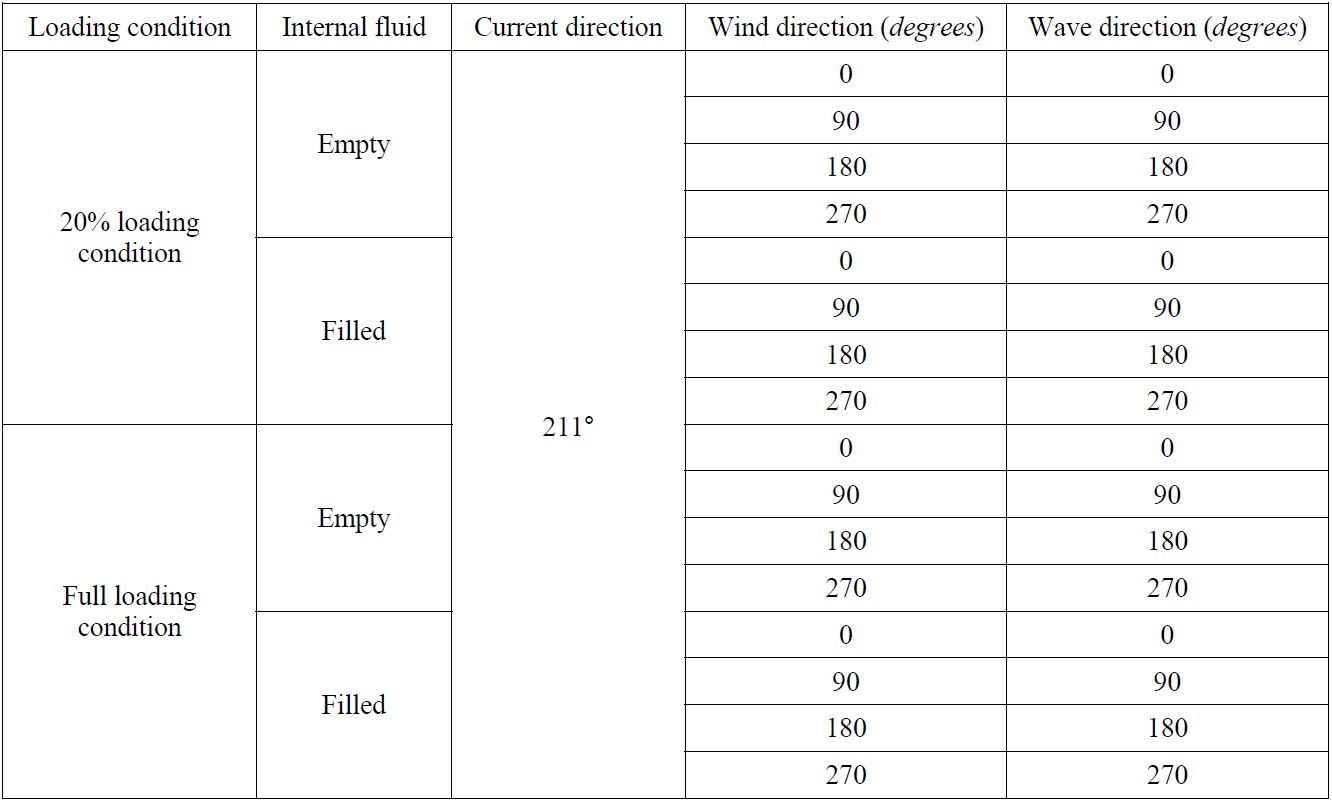
Analysis load cases.
[Table 5] Results for risers connected with FPSO.

Results for risers connected with FPSO.
[Table 6] Results for mooring line and riser connected with FPSO.
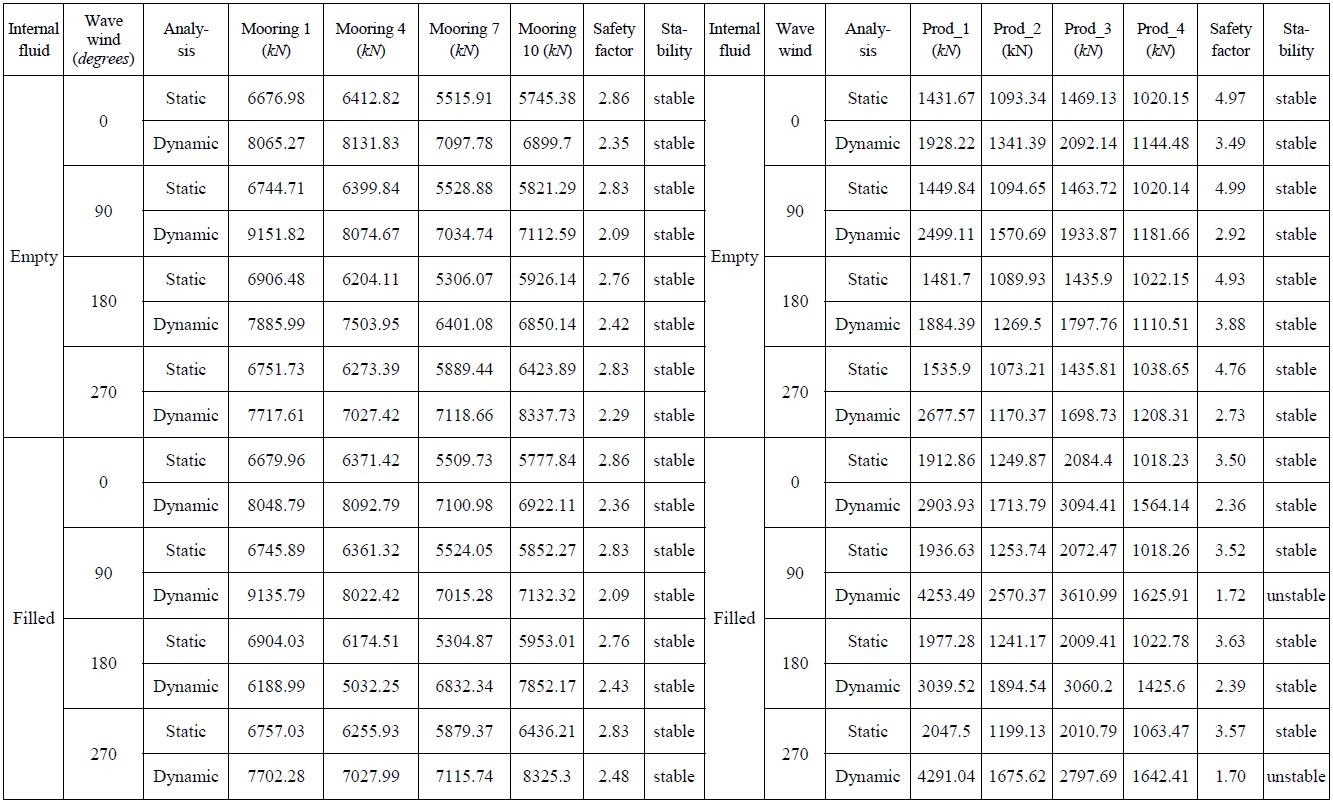
Results for mooring line and riser connected with FPSO.
[Table 7] Results for mooring line and riser connected to spider buoy.
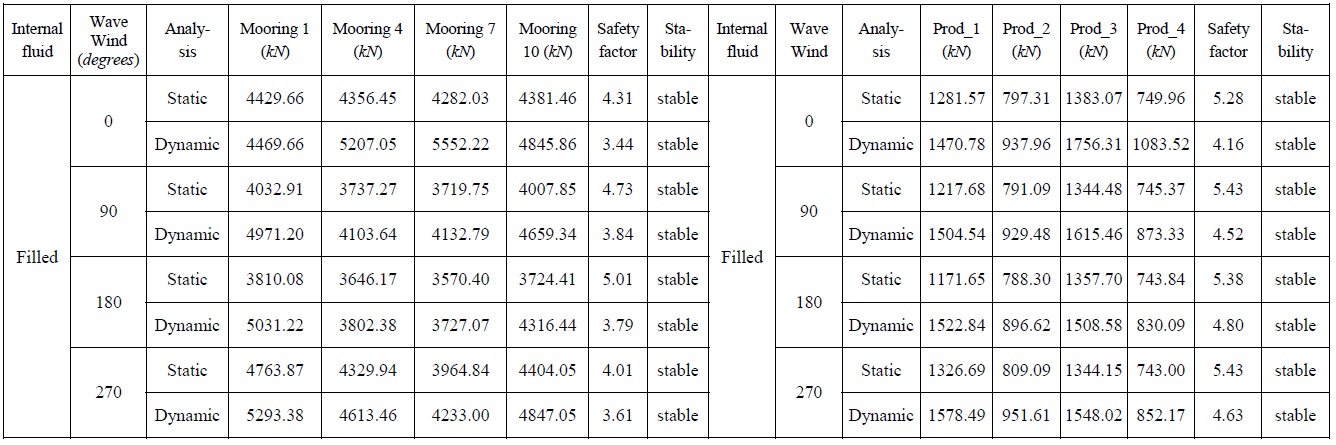
Results for mooring line and riser connected to spider buoy.
[Table 8] Results for mooring line and riser connected to spider buoy.

Results for mooring line and riser connected to spider buoy.
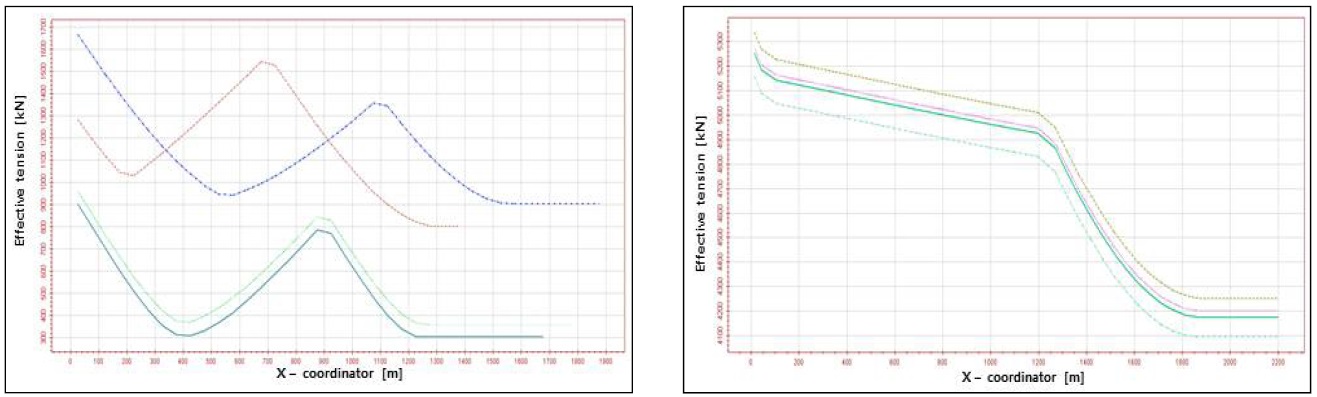
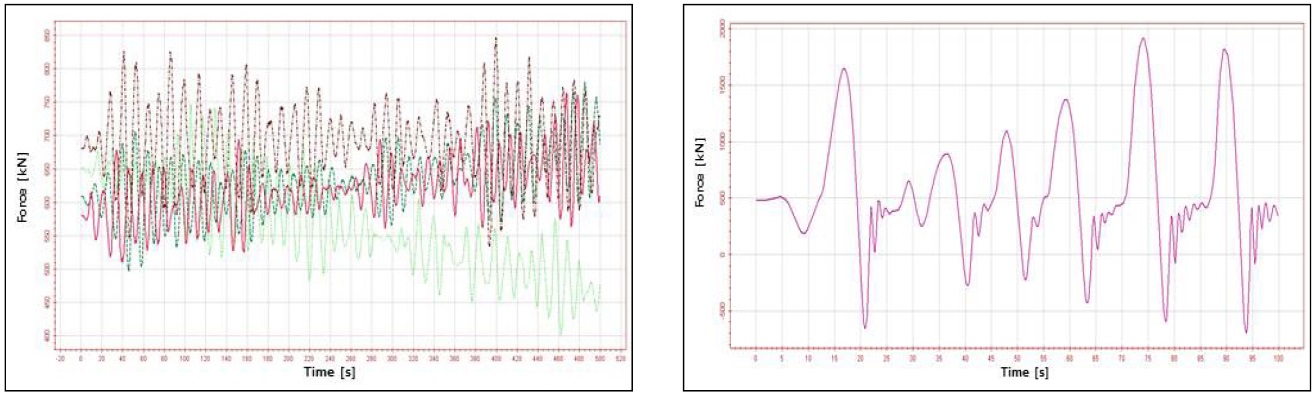
Fig. 7 shows the results of the distribution of tension along the length based on static analysis. Position 0 represents a riser or mooring lines connected to the floating structure, and the end of the x-component represents parts of the riser connection to the well. Fig. 8 confirms the results of the dynamic analysis and shows the change in tension with time. The left side of Fig. 8 shows tension value results for production riser no. 1 for angles of 0, 90, 180, and 270°. The tension value for an angle of incidence of 0° was lower than for any other angles. The right side of Fig. 8 shows the results for production riser no. 1 and water risers for an angle of incidence of 0°.
The paper suggested a general process of the safety analysis of mooring lines and risers connected to a floating structure using the Sesam program. The direction and combination of external loadings have a significant effect on the tension and stability of risers, especially when there are a number of risers connected to the structure. It is important to consider the most conservative environmental condition and configuration. The riser type, size, and length can directly affect the tension and bending moments. The most important factors in mooring line design are the distance to the touch down point, and the diameter of the line that can allow the excursion of a floating structure or buoy within a specified tolerance. A mooring design should satisfy the stability of the riser for various environmental and loading conditions.
Based on the results, a variety of floating marine energy structures mooring lines design and analysis are possible. In addition, having similar essential properties of EHU riser, the present research approaches can be effectively applied to the static and dynamic studies on the power and monitoring cables in the future. Tidal current power, offshore wind, wave energy and etc. that are installed in deep water, so should be performed for the motion analysis of the riser and mooring for ensuring the safety of the floating structure.