ROK Navy has been building many kinds of combat ship together with a newly developed combat system for the last three decades. A combat system enables a commanding officer to make the right decision by providing the integrated capability. However, as system integration is an exceptionally complicated and complex process, a data analysis tool is required to confirm the integrated performance of the combat system, which should be verified and validated whether or not it fulfills the requirements of the end user. Kumaraswamy (2002) used Failure Reporting, Analysis and Corrective Action System (FRACAS) for the data analysis. However FRACAS was an effective analysis tool to keep track and eliminate failures identified during the prototype flight testing of the Advanced Light Helicopter, it seems to be restricted to prototype flight test. Thus, this paper suggests the DERAT which is developed to analyze the data for the combat system integration, and verify and validate its integrated performance at the system level of newly developed combat system. Furthermore, this paper attempts to confirm the effectiveness of the DERAT by presenting some test results.
COMBAT SYSTEM DEVELOPMENT PROCESS
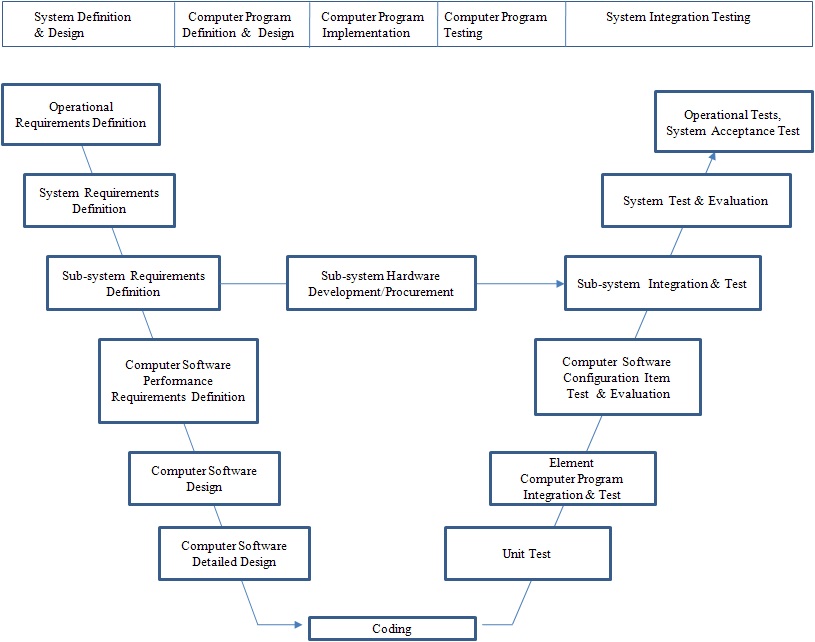
The development of a combat system includes not only the combat system itself, but also its full integration with the sensors and weapons to create an integrated performance. Fig. 1 shows the typical Vee model (INCOSE, 2007) which was used to develop the Korean Destroyer Combat System (KDCOM). The stakeholders defined the system requirement based upon those of the Korea Navy. They then developed hardware and software reflecting the definition of the system requirement and the integrated performance was verified and validated through a hierarchical integration process. In general, an enormous amount of data analysis is required to integrate a combat system with various sensors and weapons. Thus, a specialized analysis tool is required to test and evaluate the integrated performance at the system level. This paper suggests the DERAT, which is a suitable solution for a developer who needs to develop a combat system and specialized analysis tool simultaneously.
Capability of data extraction, recording and analysis
The data extraction needs to capture not only the individual equipment data, but also the interface data based upon the interface control document. During data extraction, care must be taken to avoid impedance mismatches to ensure that the original signal waveform is not disturbed, because when the DERAT connects to the original cable, the impedance might be changed and the original performance could be influenced. Besides, the DERAT should be compatible with the various interface requirements of the many sensors and weapons. The extracted data should be recorded in a computer for data analysis. In order to analyze the data, the programming of the message description language which identifies and describes the recorded data is essential. Furthermore, the DERAT should be able to convert the data types from one unit to another to allow an alignment of the data from the different subsystems.
Data display
The DERAT should provide the analyzed data to be output in different display formats, so that the test results can be easily understood by the stakeholders. The analyzed data should be easily translated to other formats for export to other tools.
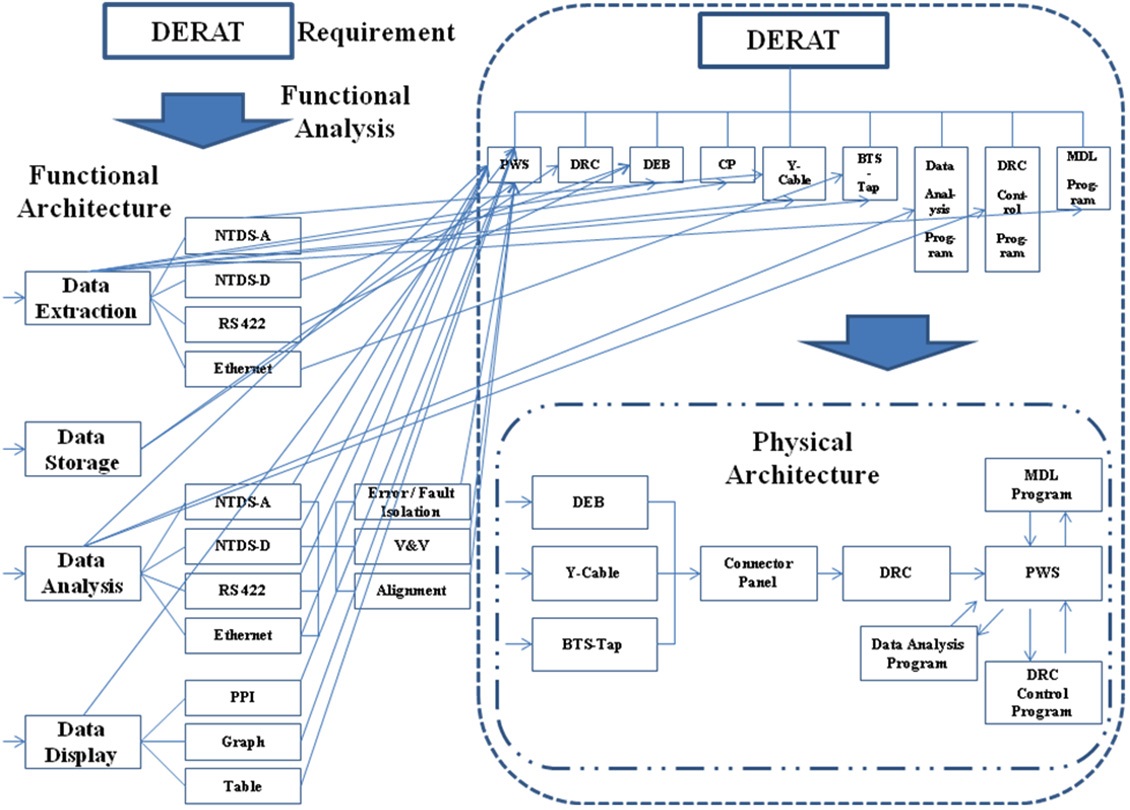
The architecture of the DERAT is defined reflecting the design synthesis process (Min and Kwon, 2004). Fig. 2 shows the architecture of the DERAT.
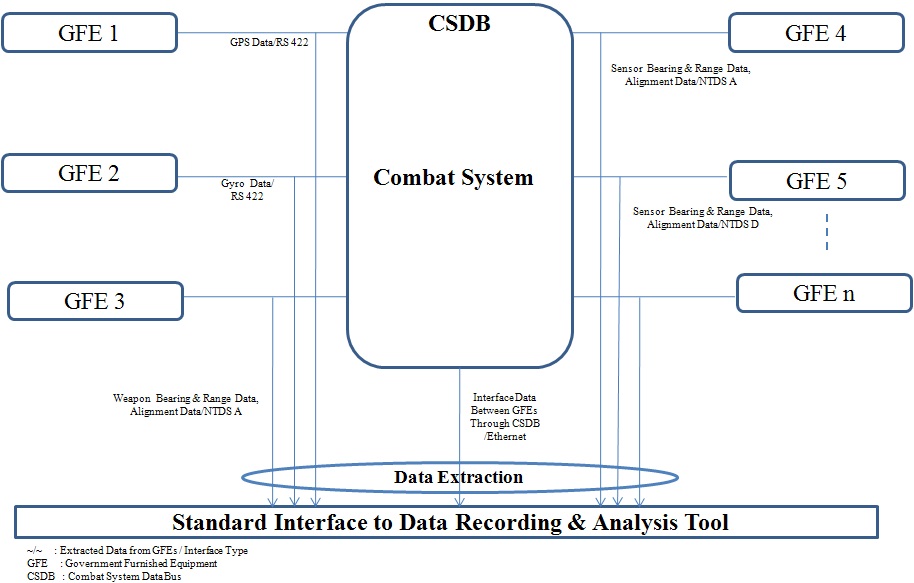
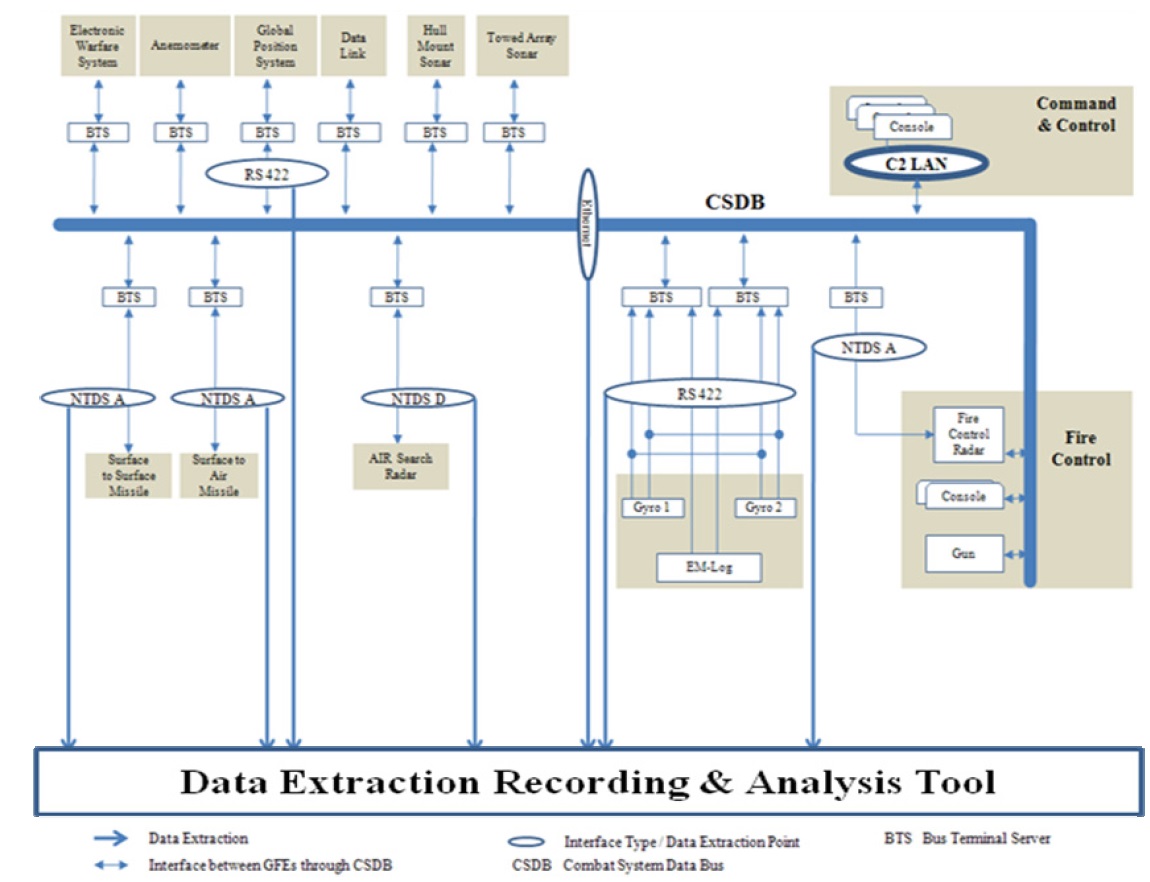
Fig. 3 shows the interface diagram between the DERAT and GFEs which explains the types of interface and the data that needs to be extracted and analyzed.
Global Position System (GPS) data: RS422
Gyro data: RS422
Weapon’s bearing/range/alignment data: NTDS A
Sensor’s bearing/range/alignment data: NTDS A or NTDS D
Interface Data between the combat system and the GFEs: Ethernet
>
Message description language programming
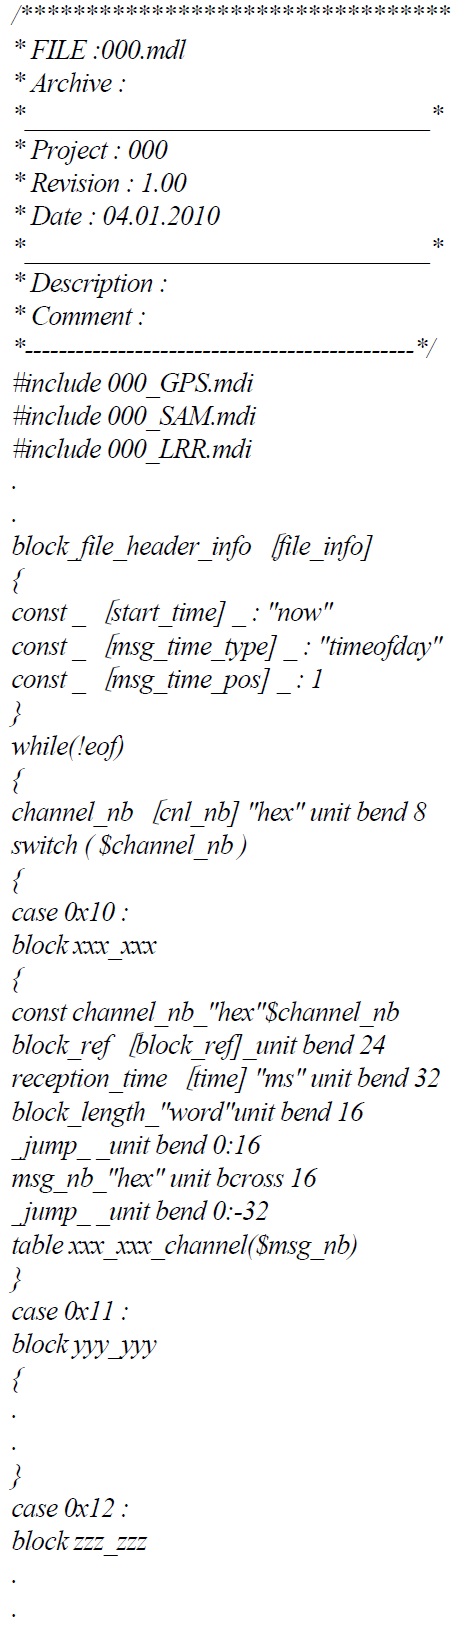
A message description language is used for the data description and contains several message description include. It converts the raw data format into the interpreted data format used by the DERAT. An example of the message description language programming is given below.
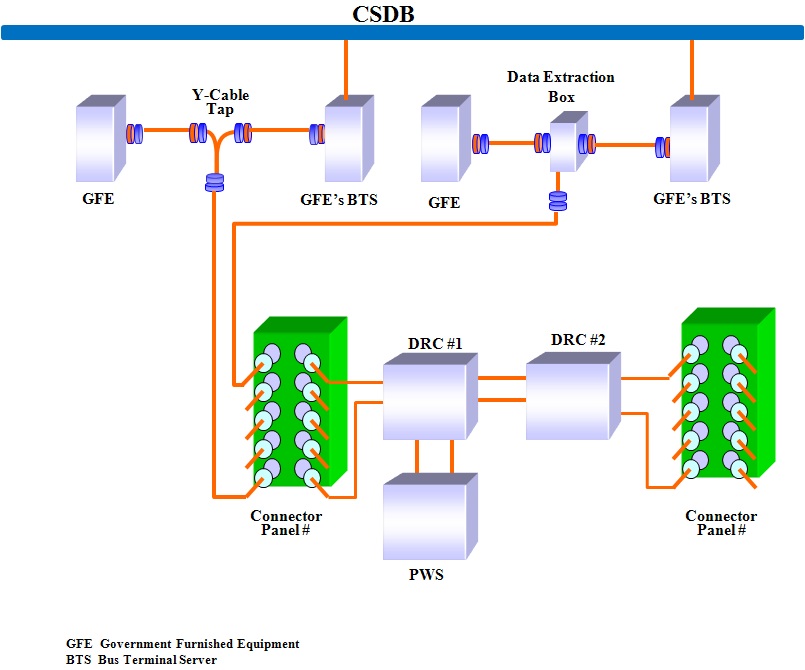
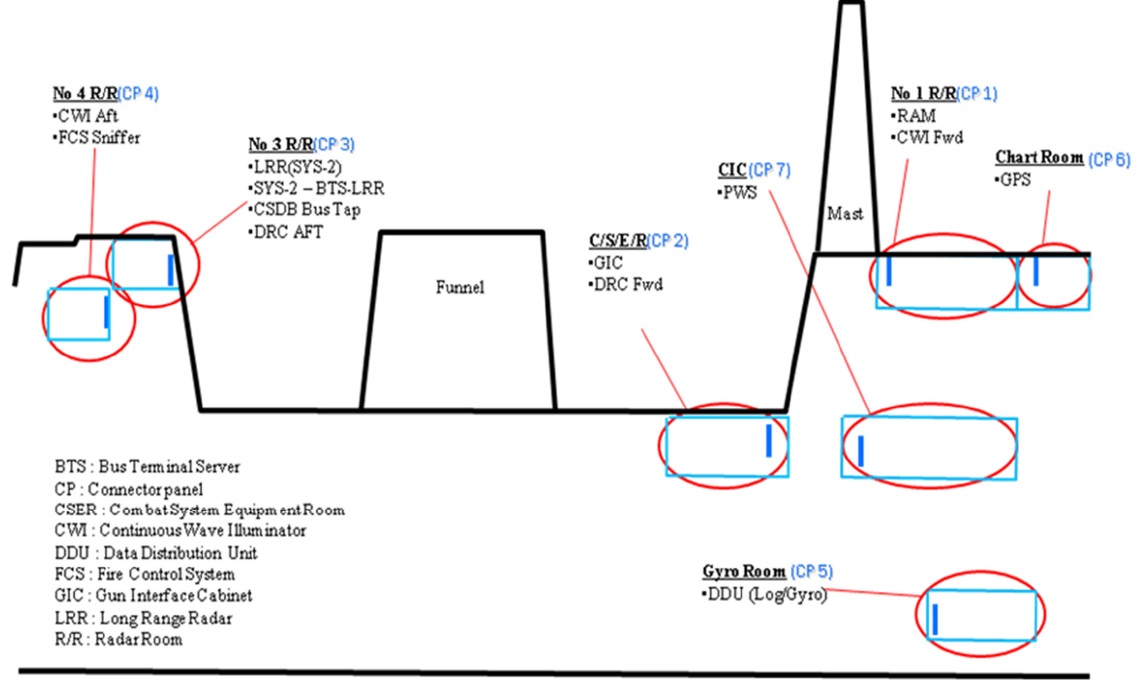
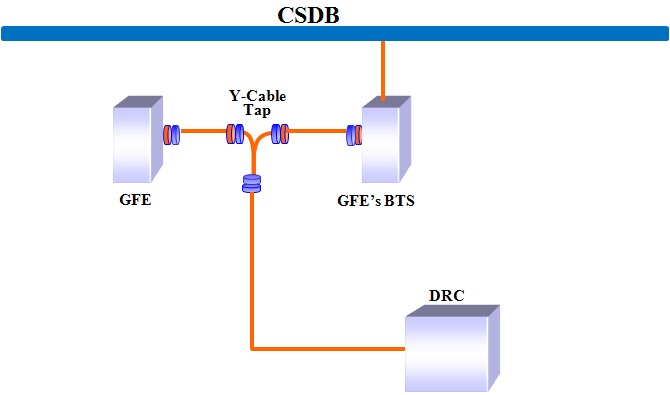
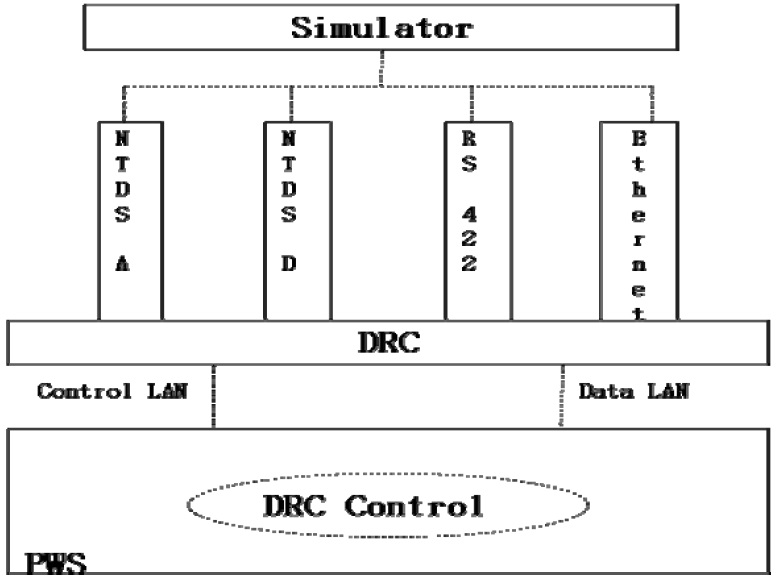
The DERAT consists of 5 components, including a Data Recording Computer (DRC), a Portable Workstation (PWS), a Data Extraction Box (DEB), a Y-Cable Tap, and a Connector Panel. Fig. 4 shows the basic configuration of the DERAT. All of the sensors and weapons are connected to the CSDB through the Bus Terminal Server (BTS) and interfaced together through the CSDB. Consequently, the rational data extraction position is a certain point between the GFE and the BTS of the GFE. Regarding the characteristics of the interface, various methods of data extraction were implemented, i.e. the Y-Cable Tap for NTDS A, the DEB for NTDS D and RS 422. The DEBs were designed to reflect the characteristics of each interface and connected to the DRC through the connector panel. The DRCs, the DEBs and the connector panels were properly installed on the ship regarding the position of the GFE, and the PWS was connected to the DRC #1 for the data analysis.
The US DoD (1998) defined the NTDS A interface as a parallel data transfer. The normal NTDS A interface consists of two channels, an input channel and an output channel. Therefore, the NTDS A interfaces were tapped by Y-cable taps. One line of
the Y-cable was connected to the GFE and the other line was connected to the DRC to provide the data for recording, as illustrated in Fig. 5.
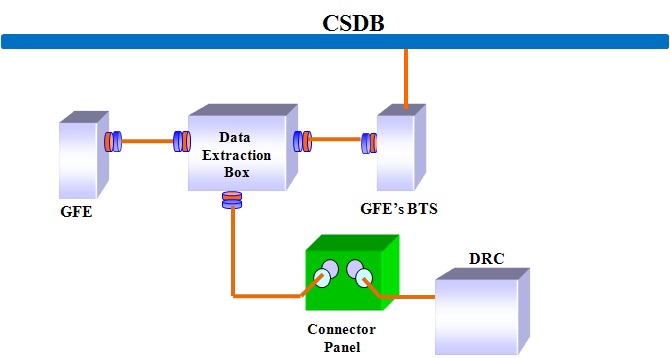
The US DoD (1998) defined the NTDS D interface as an asynchronous serial data transfer. For two-way communication, two lines of communication are necessary. One line is the source line which is from the main equipment to the external function, and the other line is the sink line which is from the external function to the main equipment. Fig. 6 shows the DEB installation for the NTDS D data extraction.
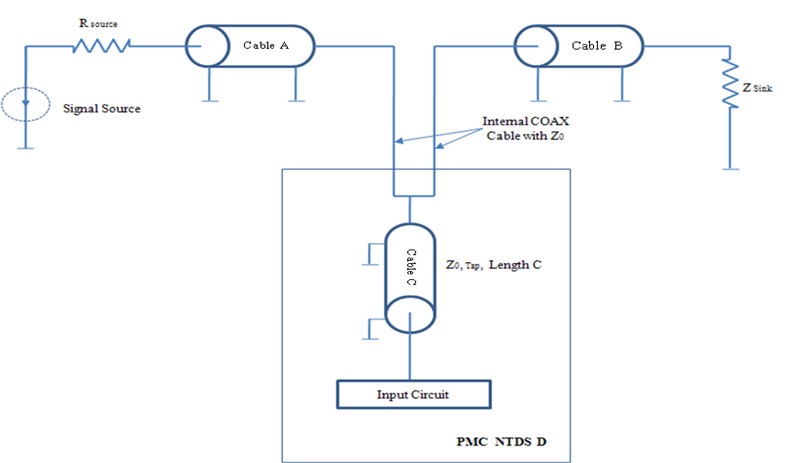
Because no commercial-off-the-shelf components exist for passive tapping of a serial NTDS interface, the design of a dedicated Peripheral component interface Mezzanine Card (PMC) was necessary. In order to extract the serial NTDS D data without disturbing the original signal waveform, impedance matching is essential. Fig. 7 shows the PMC NTDS D cabling for connecting the tap to the original cable. Cables A and B are the original cables and Cable C is for tapping. In order to maintain constant impedance from the source to the sink, the tap should have a high impedance and the length of Cable C should be as short as possible.
As illustrated in Fig. 8, when a wave travels from the source along the line, it hits a boundary and some of the wave reflects back, while some of it continues to move forward. Assuming that the impedance of the source side is
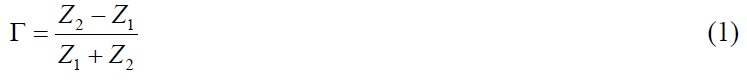
To obtain the original signal waveform without any disturbance at the end of the line, the reflection coefficient Γ should be as small as possible. Thus, regarding Fig. 6, in order to obtain the original signal waveform without any disturbance, the reflection coefficient Γ induced by the Tap should be as small as possible.
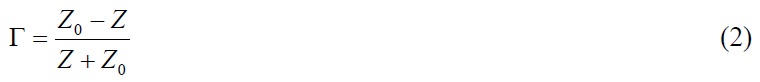
In order to calculate the reflection coefficient Γ induced by the Tap, the impedance
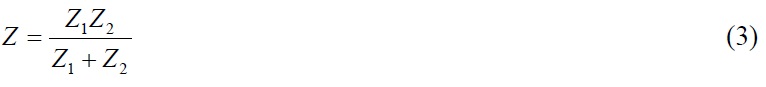
Regarding Fig. 6,
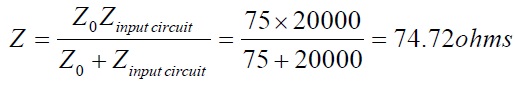
Substituting
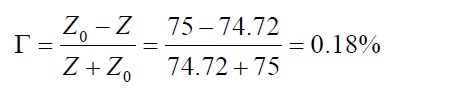
Thus, it is negligible and no signal influence was observed.
EIA (1994) defined the RS 422 as a full duplex serial data transfer. Fig. 9 shows the DEB installation for the RS 422 data extraction. In order to extract the RS 422 data, the DEB was connected to the RS 422 data channel. The DEB has three connectors for the data-input, data-output and data-output to the DRC. The input and output for each data channel were directly connected inside the DEB. Parallel to the data line were galvanic couplers transmitting the data to the RS 422 amplifier. The galvanic couplers isolate the operational and recording data.
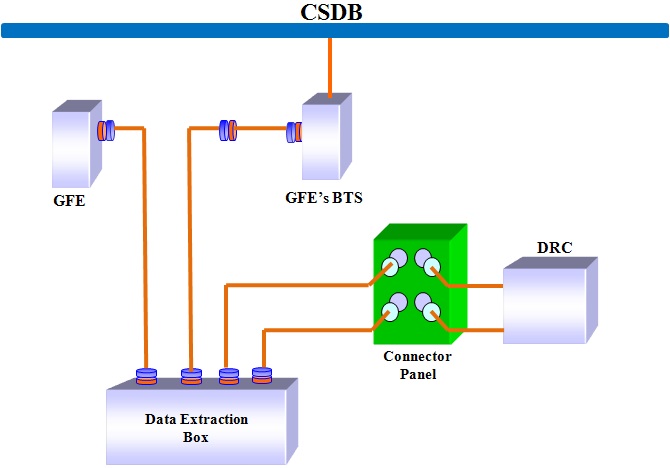
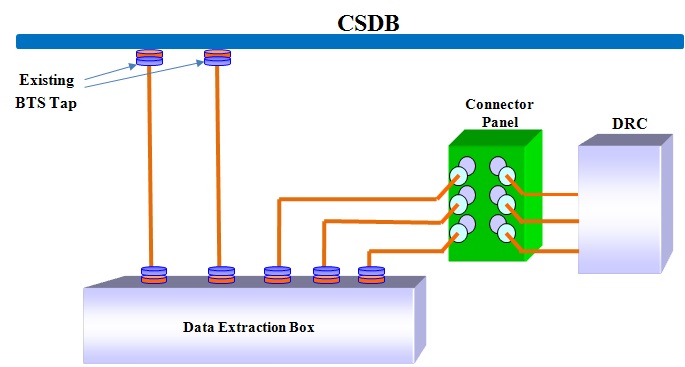
IEEE (1990) standardized the Ethernet as IEEE 802.3. In order to extract the Ethernet data, the DEB was connected to the CSDB using the existing BTS tap which was used for the GFE connection to the CSDB. Fig. 10 shows the DEB installation for the Ethernet data extraction. The original configuration of the KDCOM adopted two CSDBs for the sake of system redundancy. Therefore, the DEB connection to the CSDB was made through two existing bus taps. The data was extracted using the Network Interface Card installed in the DEB. Some of the equipment used a 10Base2 signal and the others used a 10Base T signal. For the analysis, the 10Base2 signal was converted to the 10BaseT signal using the Attachment Unit Interface Transceiver, which was installed in the Network Interface Card in accordance with IEEE 802.3.
>
Land Based Test Site (LBTS) test
Fig. 11 shows the simulated environment used for the LBTS test. A simulated environment was established reflecting the basic configuration of the KDCOM. Simulators were used for the test instead of real sensors and weapons.
Fig. 12 shows the block diagram of the message test environment used to verify the functionality of the DERAT. The basic functions of the DERAT including MDL validation, Non-Interference, Power-On & Initialization, On-line Display, DRC Control, Data Extraction, Data Recording, and Data Analysis were fully tested and demonstrated. In particular, the Non- Interference Test was performed for each interface type in order to confirm that the extraction of data from the external interfaces did not interfere with the interfaces tapped by the DERAT. The test results showed that no interference was observed due to the DERAT. After the completion of the LBTS test, the DERAT was installed on a Korean Destroyer to conduct the Onboard test, in accordance with Fig. 13. The result of the On-board test is described below.
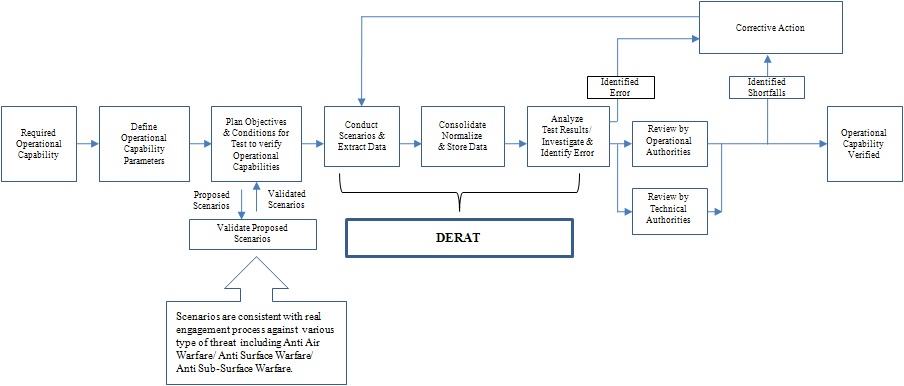
Fig. 13 shows an example of the installation of the DERAT for the data analysis of the AAW scenarios. Although a number of scenarios concerned with Anti Air Warfare, Anti Surface Warfare, and Anti Sub-Surface Warfare were conducted, only some of the analysis results of the Anti Air Warfare scenario will be presented as an example of the tests performed in this study.
The required operational capabilities were defined and the test scenarios were validated and conducted. During the test, the individual equipment data and interface data were extracted and analyzed. The operational authorities and technical authorities were provided with the analyzed data for review. If shortfalls or errors were identified, they were sent back to find a solution as illustrated in Fig. 14.
Data display & analysis
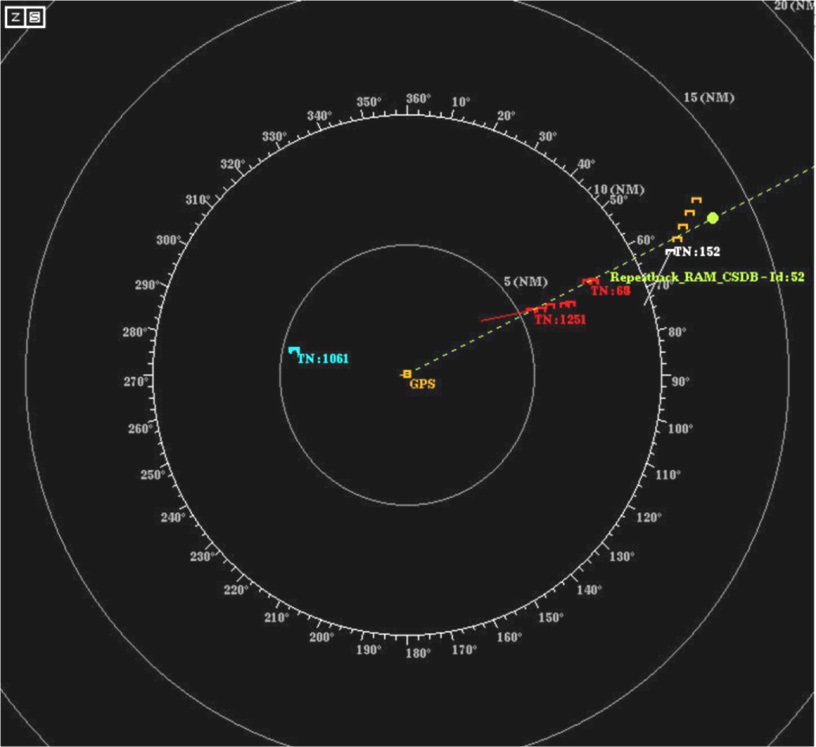
The following 3 figures show the analysis results of one of the AAW scenarios. As illustrated in Fig. 15, the PPI displays that the Air Search Radar tracks a red colored hostile target designated with the track number 65, which is also designated with identification number 52 in Fig. 16, and the Combat System assigns the Surface-to-Air missile to engage with track number 65.
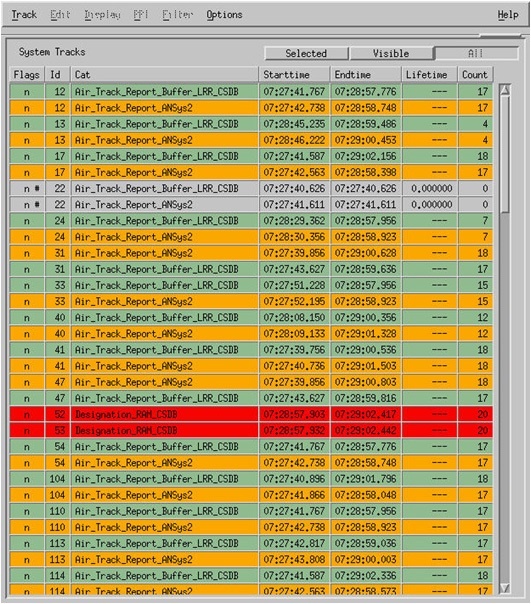
Fig. 16 shows the track list from the data file sorted by identification. This list shows that the Surface-to-Air missile is assigned to engage with track number 65 which is designated with identification number 52.
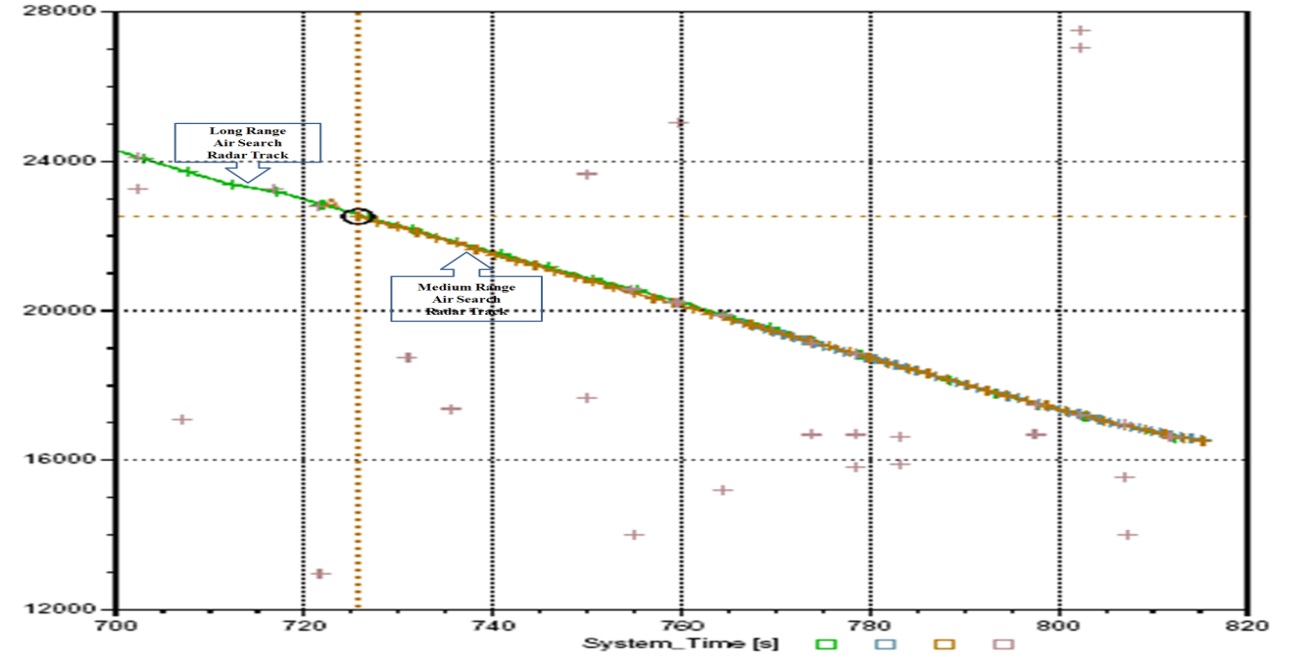
Fig. 17 shows the multi sensor track data within the particular time frame. While the Long Range Air search Radar tracked the above track number 65, the initial contact was made by the Medium Range Air search Radar at 22.5
The above figures provide the data about the same target or in different formats. These data were very useful for the later analysis. For example, if the above engagement fails due to unknown faults, the technical authorities can review the analysis result of the individual equipment data and the interface data recorded at that time, identify the reason for the failure and then find the solution.
Alignment check
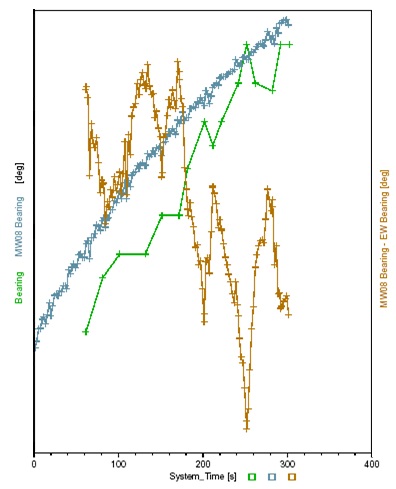
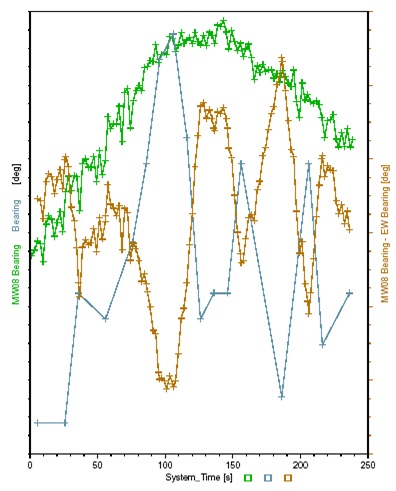
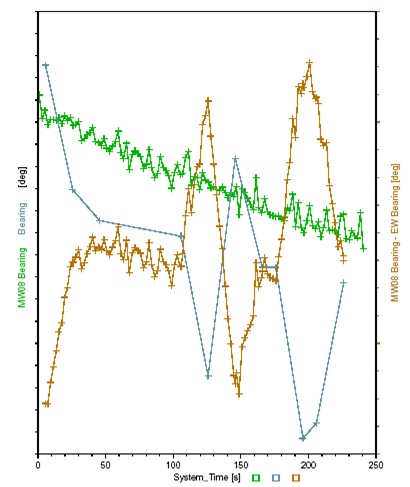
All of the sensors and weapons on-board should be aligned perfectly to ensure a precise engagement. In the case of misalignment, the failure of the engagement is inevitable due to the inaccurate data which causes the error. If the error is a bias error that remains constant in magnitude for all observations, it is relatively easy to correct it. If inherently unpredictable random errors are observed, the equipment should be radically corrected. Actually, a number of test runs were conducted to check the alignment status of the sensors and weapons. Figs. 18, 19 and 20 show examples of the analysis results of the ESM bearing data compared with the real target bearing data provided by the MW 08 Radar through the test run. According to the analysis result,
a bias error of the ESM bearing which was an average of 4.32° less than the real target bearing was observed, was corrected by the gyro supplier and no further errors were observed.
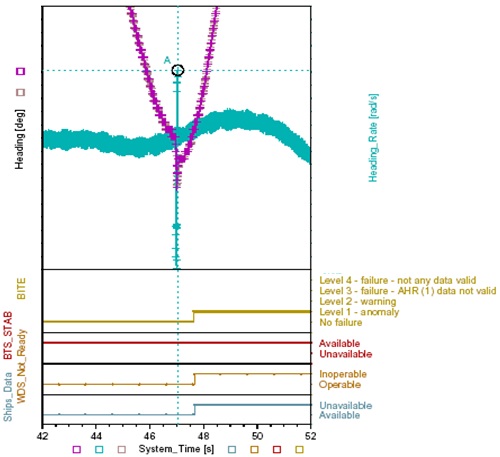
Fault detection
Fig. 21 shows an example of the fault detection. While one of the AAW test scenarios was conducted, the weapon direction system which controls the SM-II surface-to-air missile began to operate improperly. In order to find the reason for this, the DERAT analyzed all of the recorded data extracted from the sensors and the weapons concerned with the functional chain of the SM-II AAW engagement, and detected a gyro anomaly which occurred at a system time of 47
The intention of this paper is to suggest the DERAT as a data analysis tool for combat system integration and to prove the effectiveness of the DERAT by presenting the test results. The DERAT is believed to be helpful to develop a combat system which fulfills the end user's requirement and to timely deliver the combat system to the end user. Furthermore, the DERAT is expected to contribute to reduce the cost and time as well as the system engineering efforts significantly.
If an additional function is implemented, the DERAT will easily be used to support on-board team training, fleet exercise assessment, planned maintenance and repair of equipment regarding the equipment's failure history and trends, data base for future development, etc. Therefore, future study will be necessary to expand the availability of the DERAT as a life time support tool.