According to the International Atomic Energy Agency, over 10,000 metric tons of spent fuels are discharged from the world’s nuclear reactors every year, and about 80% of this spent fuel is placed into storage facilities. They also anticipated that 445,000 tons of heavy metal (tHM) spent fuel will be generated by 2020, of which 300,000 tHM is to be dry-stored [1].
Currently in the United States (US), dry storage is being reconsidered as an effective and efficient option for longterm or extended long term spent fuel storage since the Nuclear Regulatory Commission (NRC) withdrew the license application review process of the Yucca mountain project last year. The US has certified their utility dry storage systems for up to 60 years, and is now considering certification for 120 years including the wet storage period [2]. Japan has recently initiated spent fuel integrity estimation programs for 50 years of storage, because the reprocessing of the spent fuels has been delayed in Rokkashomura [3]. Thus dry storage has been recognized as a realistic storage option for accumulated spent fuels in the aftermath of the Fukushima accident.
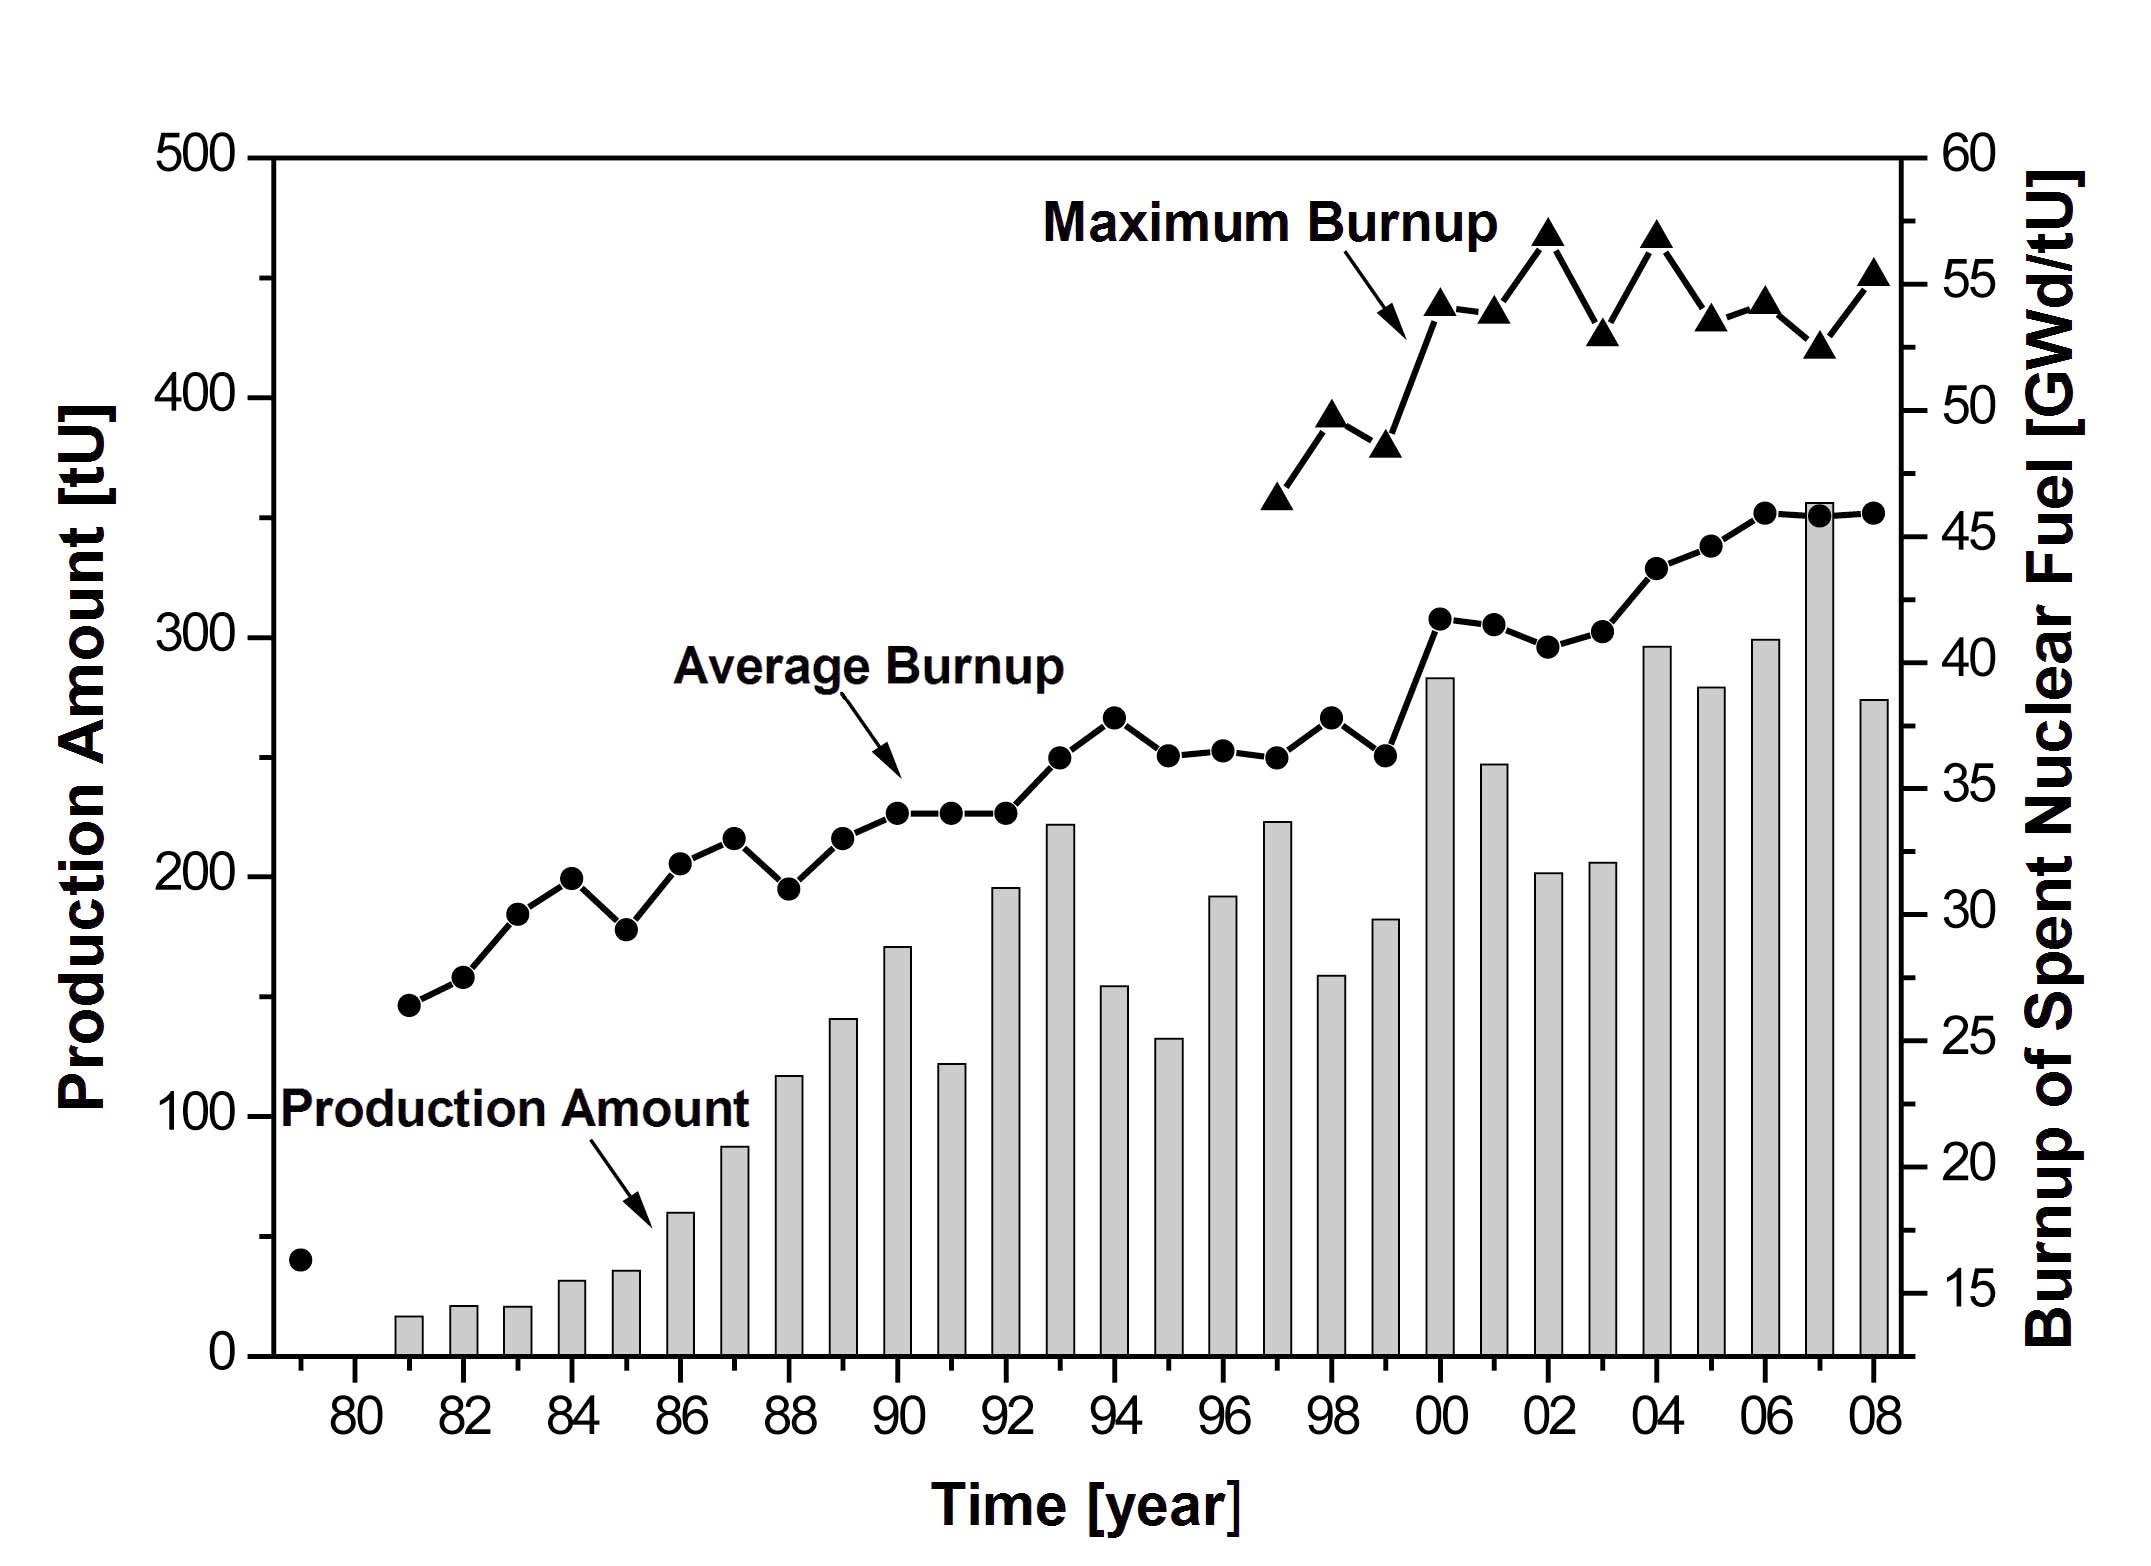
In Korea, since the first commercial operation of Kori unit 1 in 1978, 19 PWRs are now operating with various types of nuclear fuels. During the last three decades, these plants have discharged about 5,950 tHM of spent fuel, which consists of 11 types, depending on the design (Table 1). During this period of time, the average and maximum burn-ups of the domestic fuels have been steadily increased from 30,000 to 45,000 MWd/MTU and from 45,000 to 55,000 MWd/MTU, respectively [4] (Figure 1). Regardless of the fuel type and the discharge burn-up, domestic spent fuels have been continuously stored in onsite wet storage pools, even though the proper duration for on-site storage is not greater than ten years. Consequently, several reports have been published claiming that the national on-site storage capacity would be exceeded by early 2020 and, therefore, we now have to prepare interim or long-term storage options for our domestic spent fuels.
Although nuclear fission reactions stop during dry
[Table 1.] Inventory Ratio of Spent Fuel for Each Reactor and Fuel Type [7] (unit: percent)
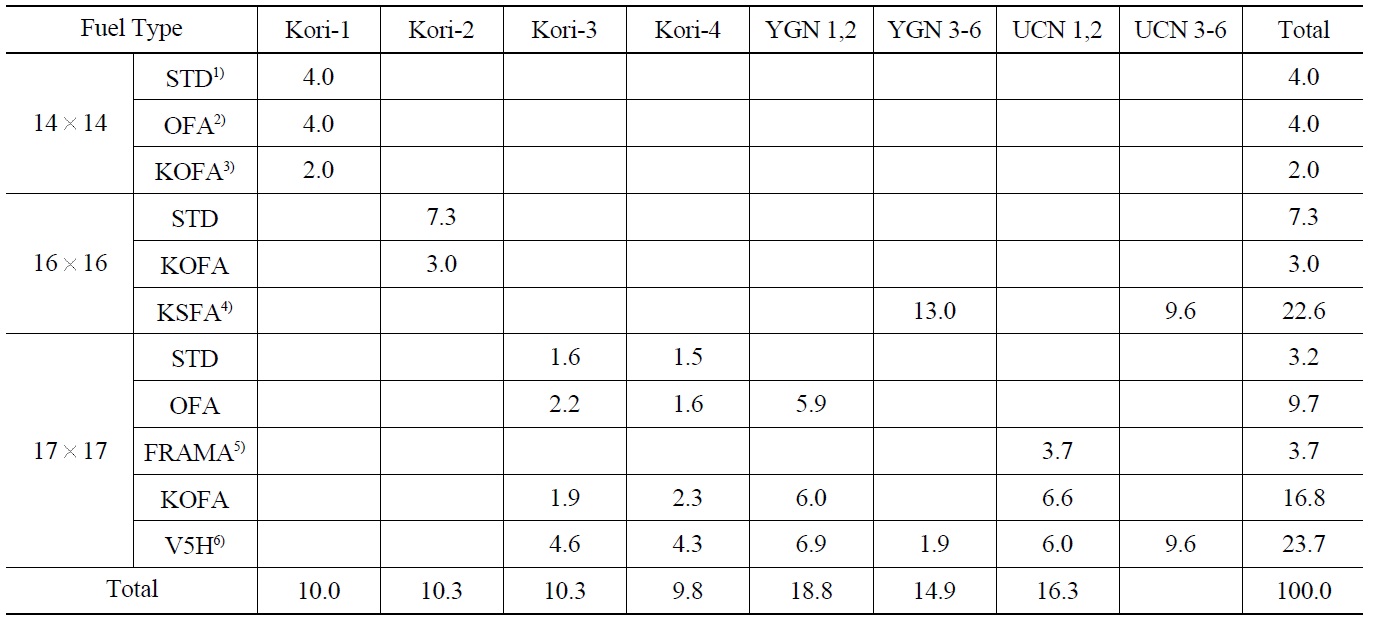
Inventory Ratio of Spent Fuel for Each Reactor and Fuel Type [7] (unit: percent)
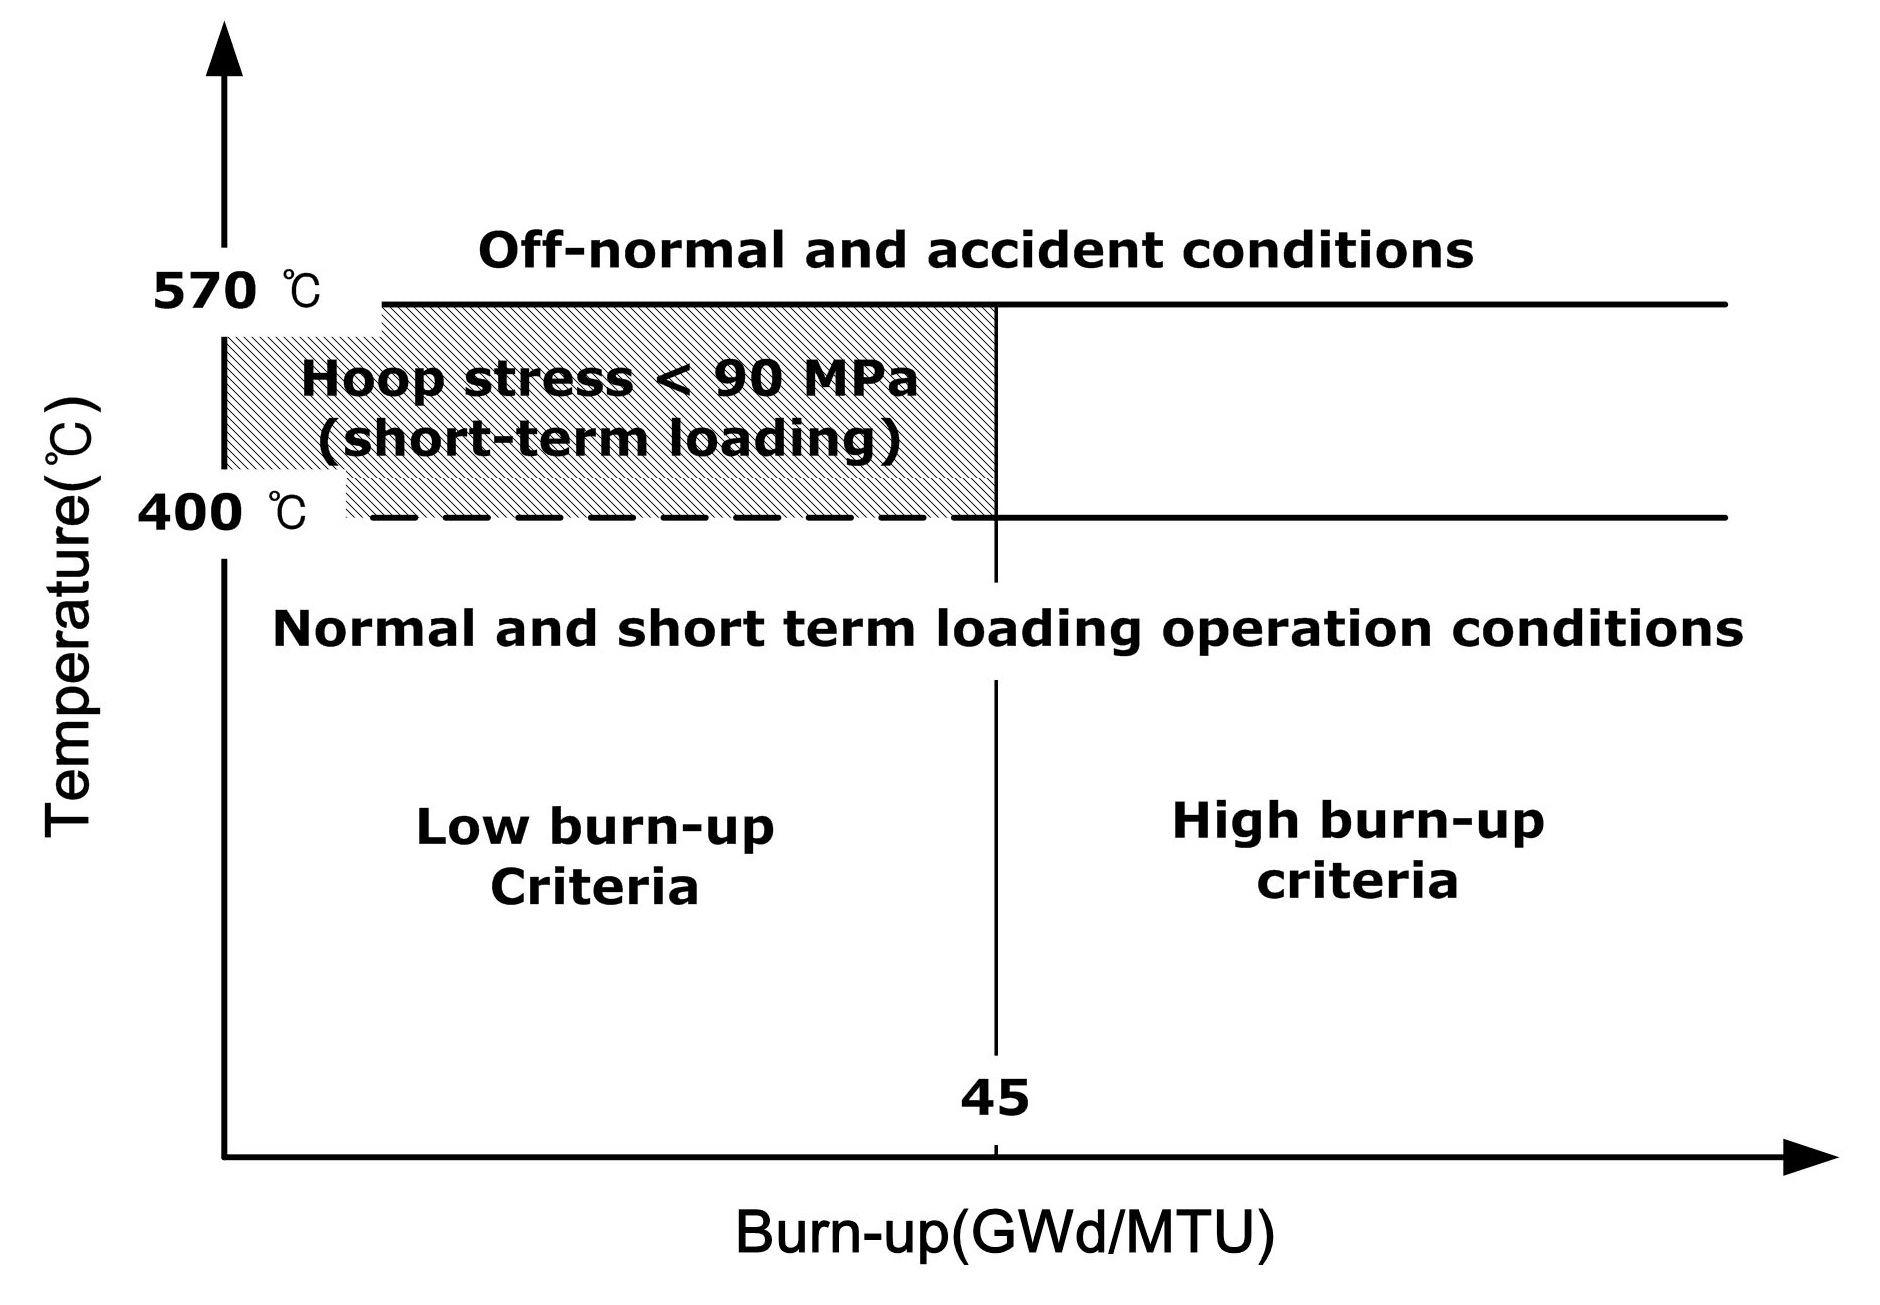
storage, spent fuel cladding temperatures can increase due to decay heat unless proper cooling is supplied. US NRC limits the maximum allowable cladding temperature to 400 ℃ so as to prevent fuel cladding integrity from degradation (Figure. 2) [5]. It is well-known that exceeding this temperature results in substantial cladding degradation during long-term storage. The major mechanisms for the degradation are creep and reoriented or delayed hydride cracking [6].
Recently the NRC has paid careful attention to the relationship between hydride reorientation and cladding hoop stress and suggested 90 MPa hoop stress limit instead of the maximum allowable temperature criteria, even for low burn-up fuels. In actuality, the principal variables
triggering cladding degradation are hoop stress caused by rod internal pressure and cladding temperature that is induced by decay heat. Evolution of the degradation seriously depends on the various conditions developed in the spent fuel cladding during reactor operation. Among these conditions, the cladding oxide thickness, hydrogen concentration, and the rod internal pressure are the most important characteristics to be assessed prior to loading into the storage cask in order to ensure safe and reliable long-term dry storage.
Practically, the three characteristics crucially rely not only on the discharge burn-up, but also on the power history of a fuel rod. Thus, to ensure the performance of long-term dry-stored spent fuel, we need to simultaneously trace both the discharge burn-up and the power history of a spent fuel. Nevertheless, domestic spent fuels have not been characterized for this purpose so far and even essential data or statistics are seldom available.
In this study, therefore, we conducted a statistical survey of all domestic spent fuels to determine the representative domestic spent nuclear fuels. We extensively collected, statistically examined, and normally characterized detailed data on the two representative fuels in order to extract the necessary information for the following analysis. Along with the statistical examination, we traced the power histories of the two fuels in terms of Linear Heat Generation Rates (LHGRs) from Nuclear Design Reports (NDRs) to evaluate their initial characteristics. The actual evaluations were carried out using the FRAPCON-3 code assuming three consecutive cycle operations following the traced LHGRs.
2. STATISTICAL EXAMINATION AND POWER HISTORY TRACE OF DOMESTIC SPENT NUCLEAR FUEL
2.1 Selection of the Representative Domestic Spent Fuels
Even when spent fuels have the same discharge burnup, the initial conditions of the fuel rods can differ significantly, depending on their burn-up history, the type of material, and the design configuration. Currently, 19 PWRs are operating in Korea with various types of fuels: one with WH-14×14, one with WH-16×16, eleven with OPR-16×16, and six with WH-17×17. The number of domestic spent fuel assemblies discharged during the last three decades reached 13,500, which are generally classified into 11 types, relying on the detailed design specifications shown in Table 1. However, it is of little use to analyze all fuels, because fuel burn-up and its power history, rather than fuel type, are more important in this study. Therefore, we have decided to select representative domestic fuels from the sample analysis.
Through the statistical survey, we found that the Vantage 5H (V5H) type is the most abundantly generated assembly, occupying 23.7% of the total. The second most discharged is the Korea Standard Fuel Assembly (KSFA)- 16×16 type, which amounts to 22.6% [7] (Table 1). However, we expected that the number of KSFA-16×16 type spent fuels will exceed the number of V5H-17×17 fuels by mid-2010, so the former will be the predominant fuel by early-2020. Thus, we chose the V5H-17×17 and KSFA-16×16 types as the representative domestic spent nuclear fuels.
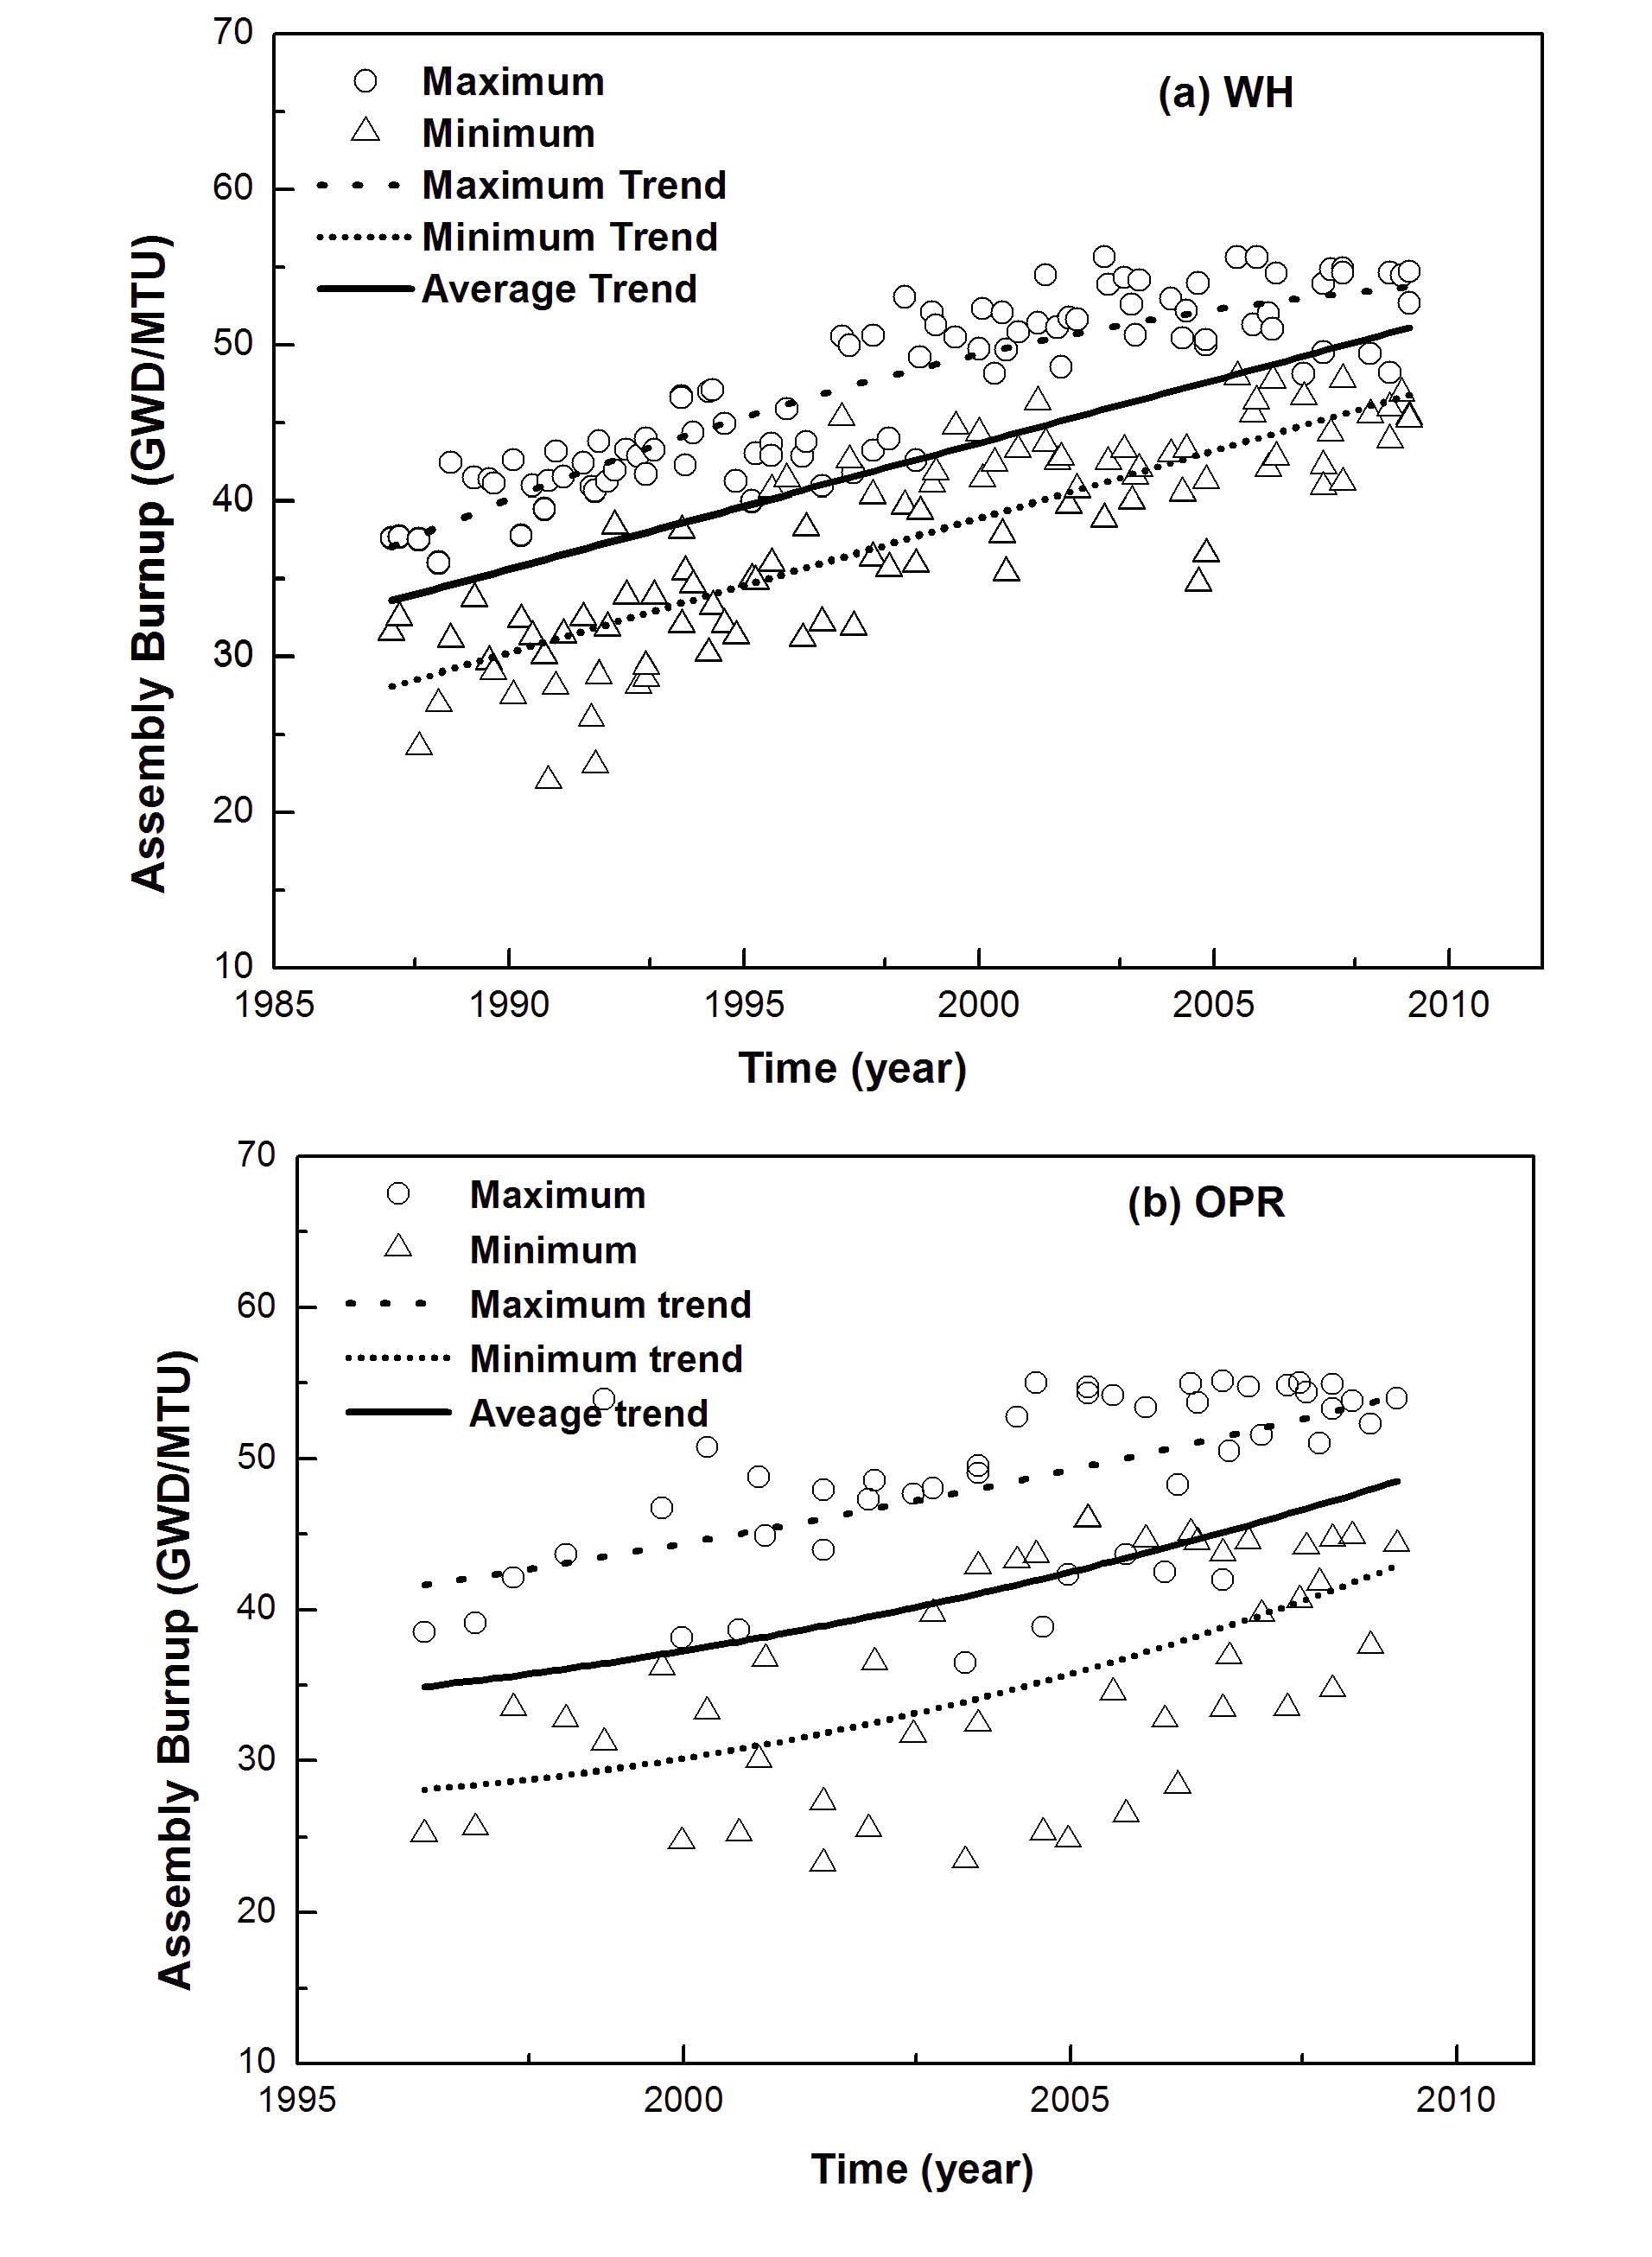
We investigated the burn-up trends of the representative fuels based on the NDRs and the results are plotted in
Figure 3. This figure demonstrates that until 2010, the average burn-up increased from 33,000 to 51,000 MWd/MTU for WH-17×17 and from 34,800 to 48,500 MWd/MTU for OPR-16×16. Therefore, their average burn-ups were 42,400 MWd/MTU for WH-17×17 and 42,000 MWd/MTU for OPR-16×16. An additional survey disclosed that the maximum burn-up of V5H-17×17 is 55,640 MWd/MTU, while that of KSFA-16×16 is 53,947 MWd/MTU. For reference, their cladding material is Zircaloy-4.
2.3 Power History of Spent Fuel
As mentioned in the previous section, the initial conditions of spent fuel rods for long-term storage crucially depend on the power history of the fuels during reactor operation. We can characterize the initial conditions primarily by oxide thickness, rod internal pressure, and hydrogen content. The oxide thickness grows on the zirconium alloy cladding surface due to waterside corrosion while the rod internal pressure develops because of fission gas release from fuel pellets. The hydrogen concentration in the cladding steadily increases due to the hydrogen pickup of the zirconium base metal that accompanies the corrosion.
The cladding corrosion and fission gas release are temperature-dependent phenomena that result from fuel rod power. In actuality, the rod power, described by LHGR, depends on the location of the fuel rod in the reactor, and the related information is contained in the NDR of each cycle of each power unit. However, it is not possible to trace the power history of each fuel rod with the NDR, because it deals only with assembly-wise power history.
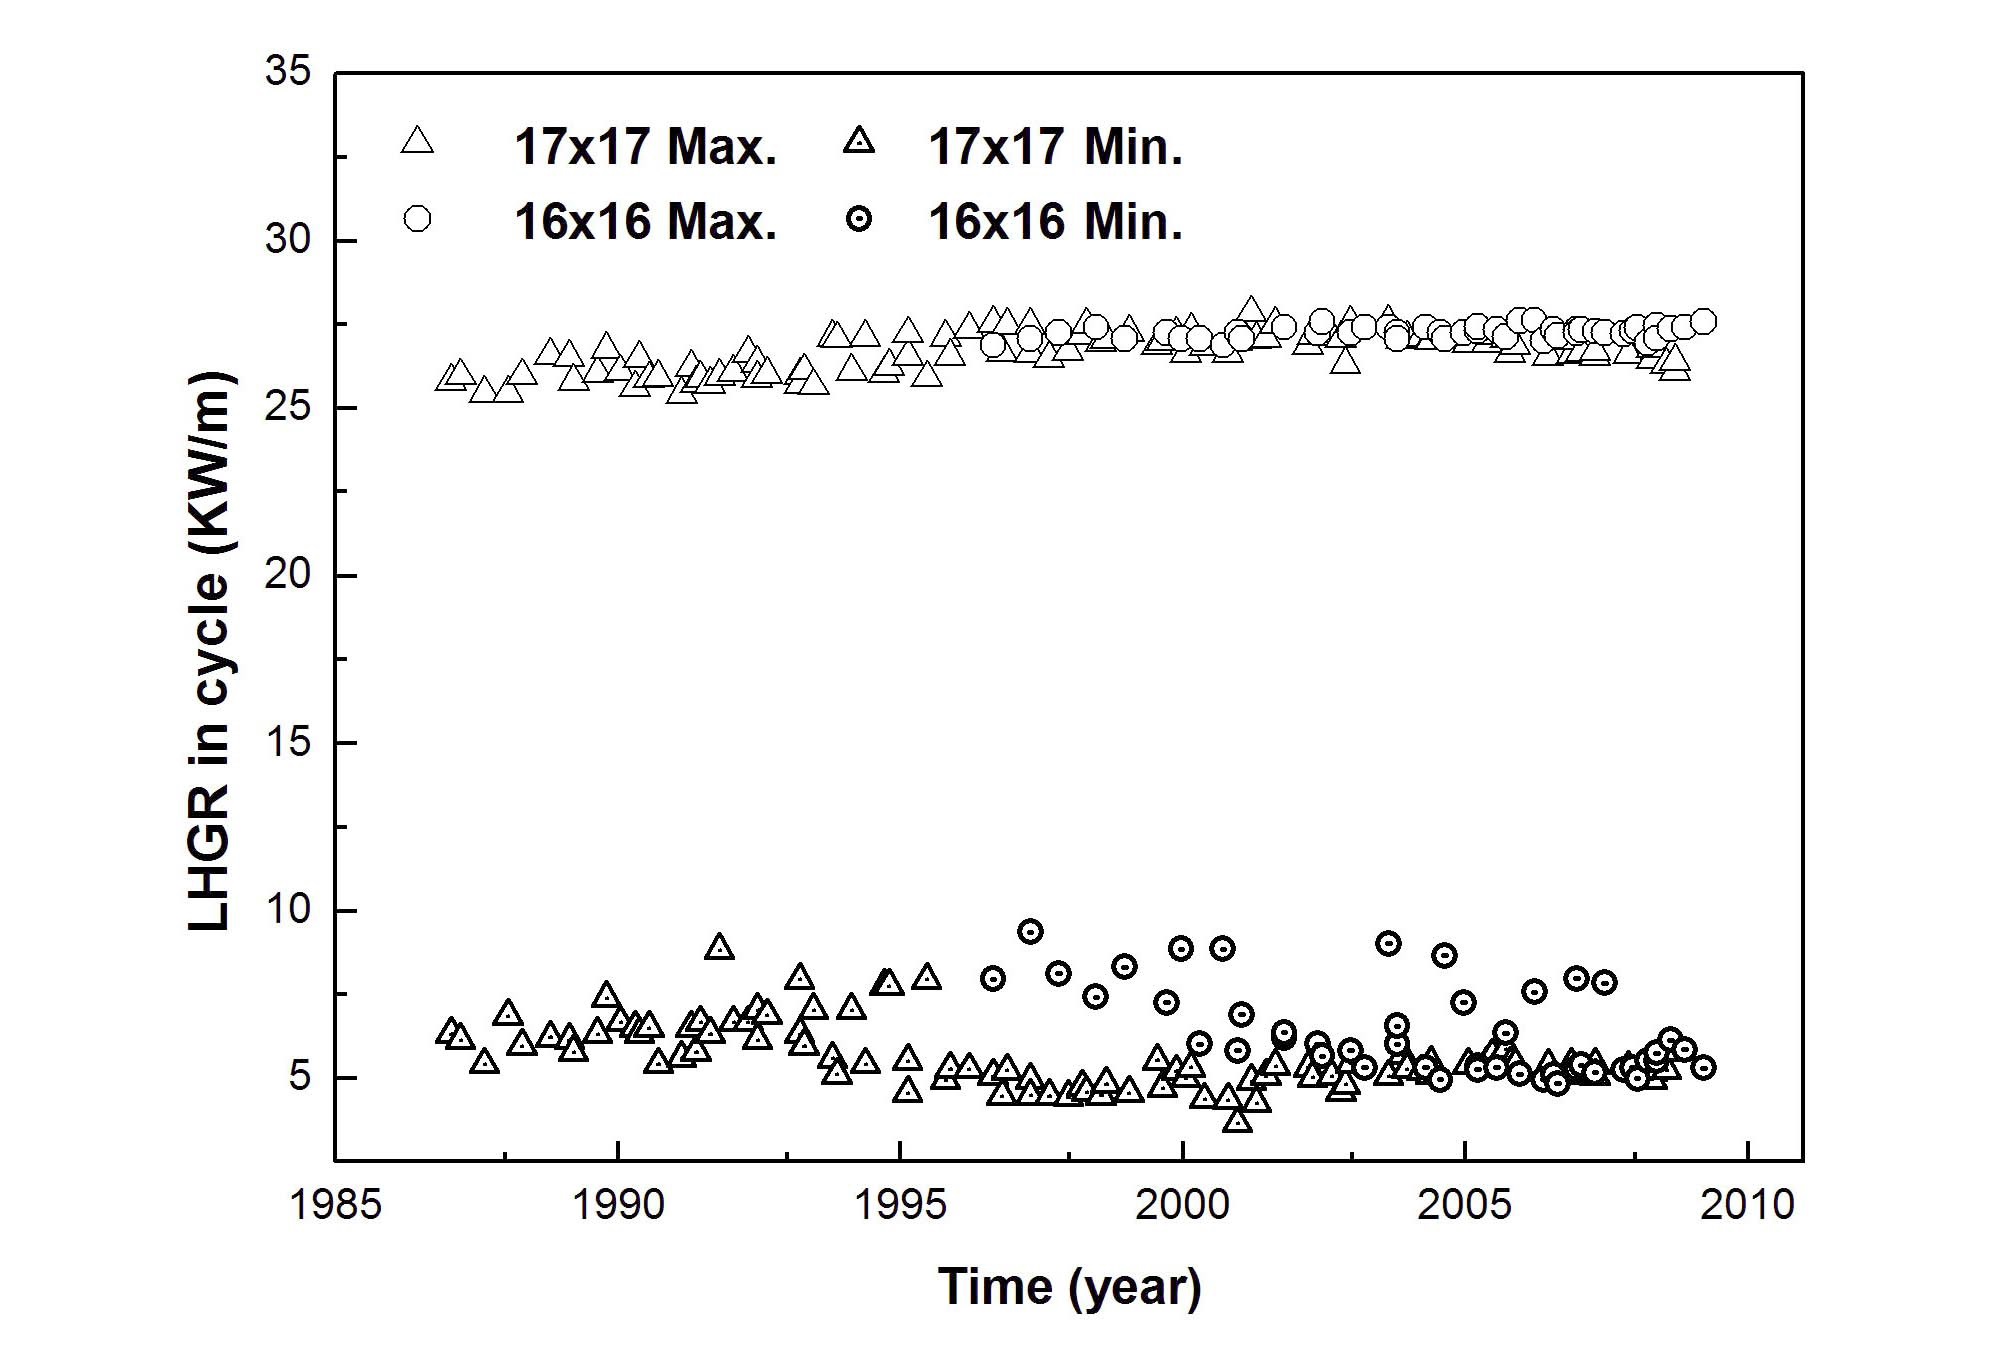
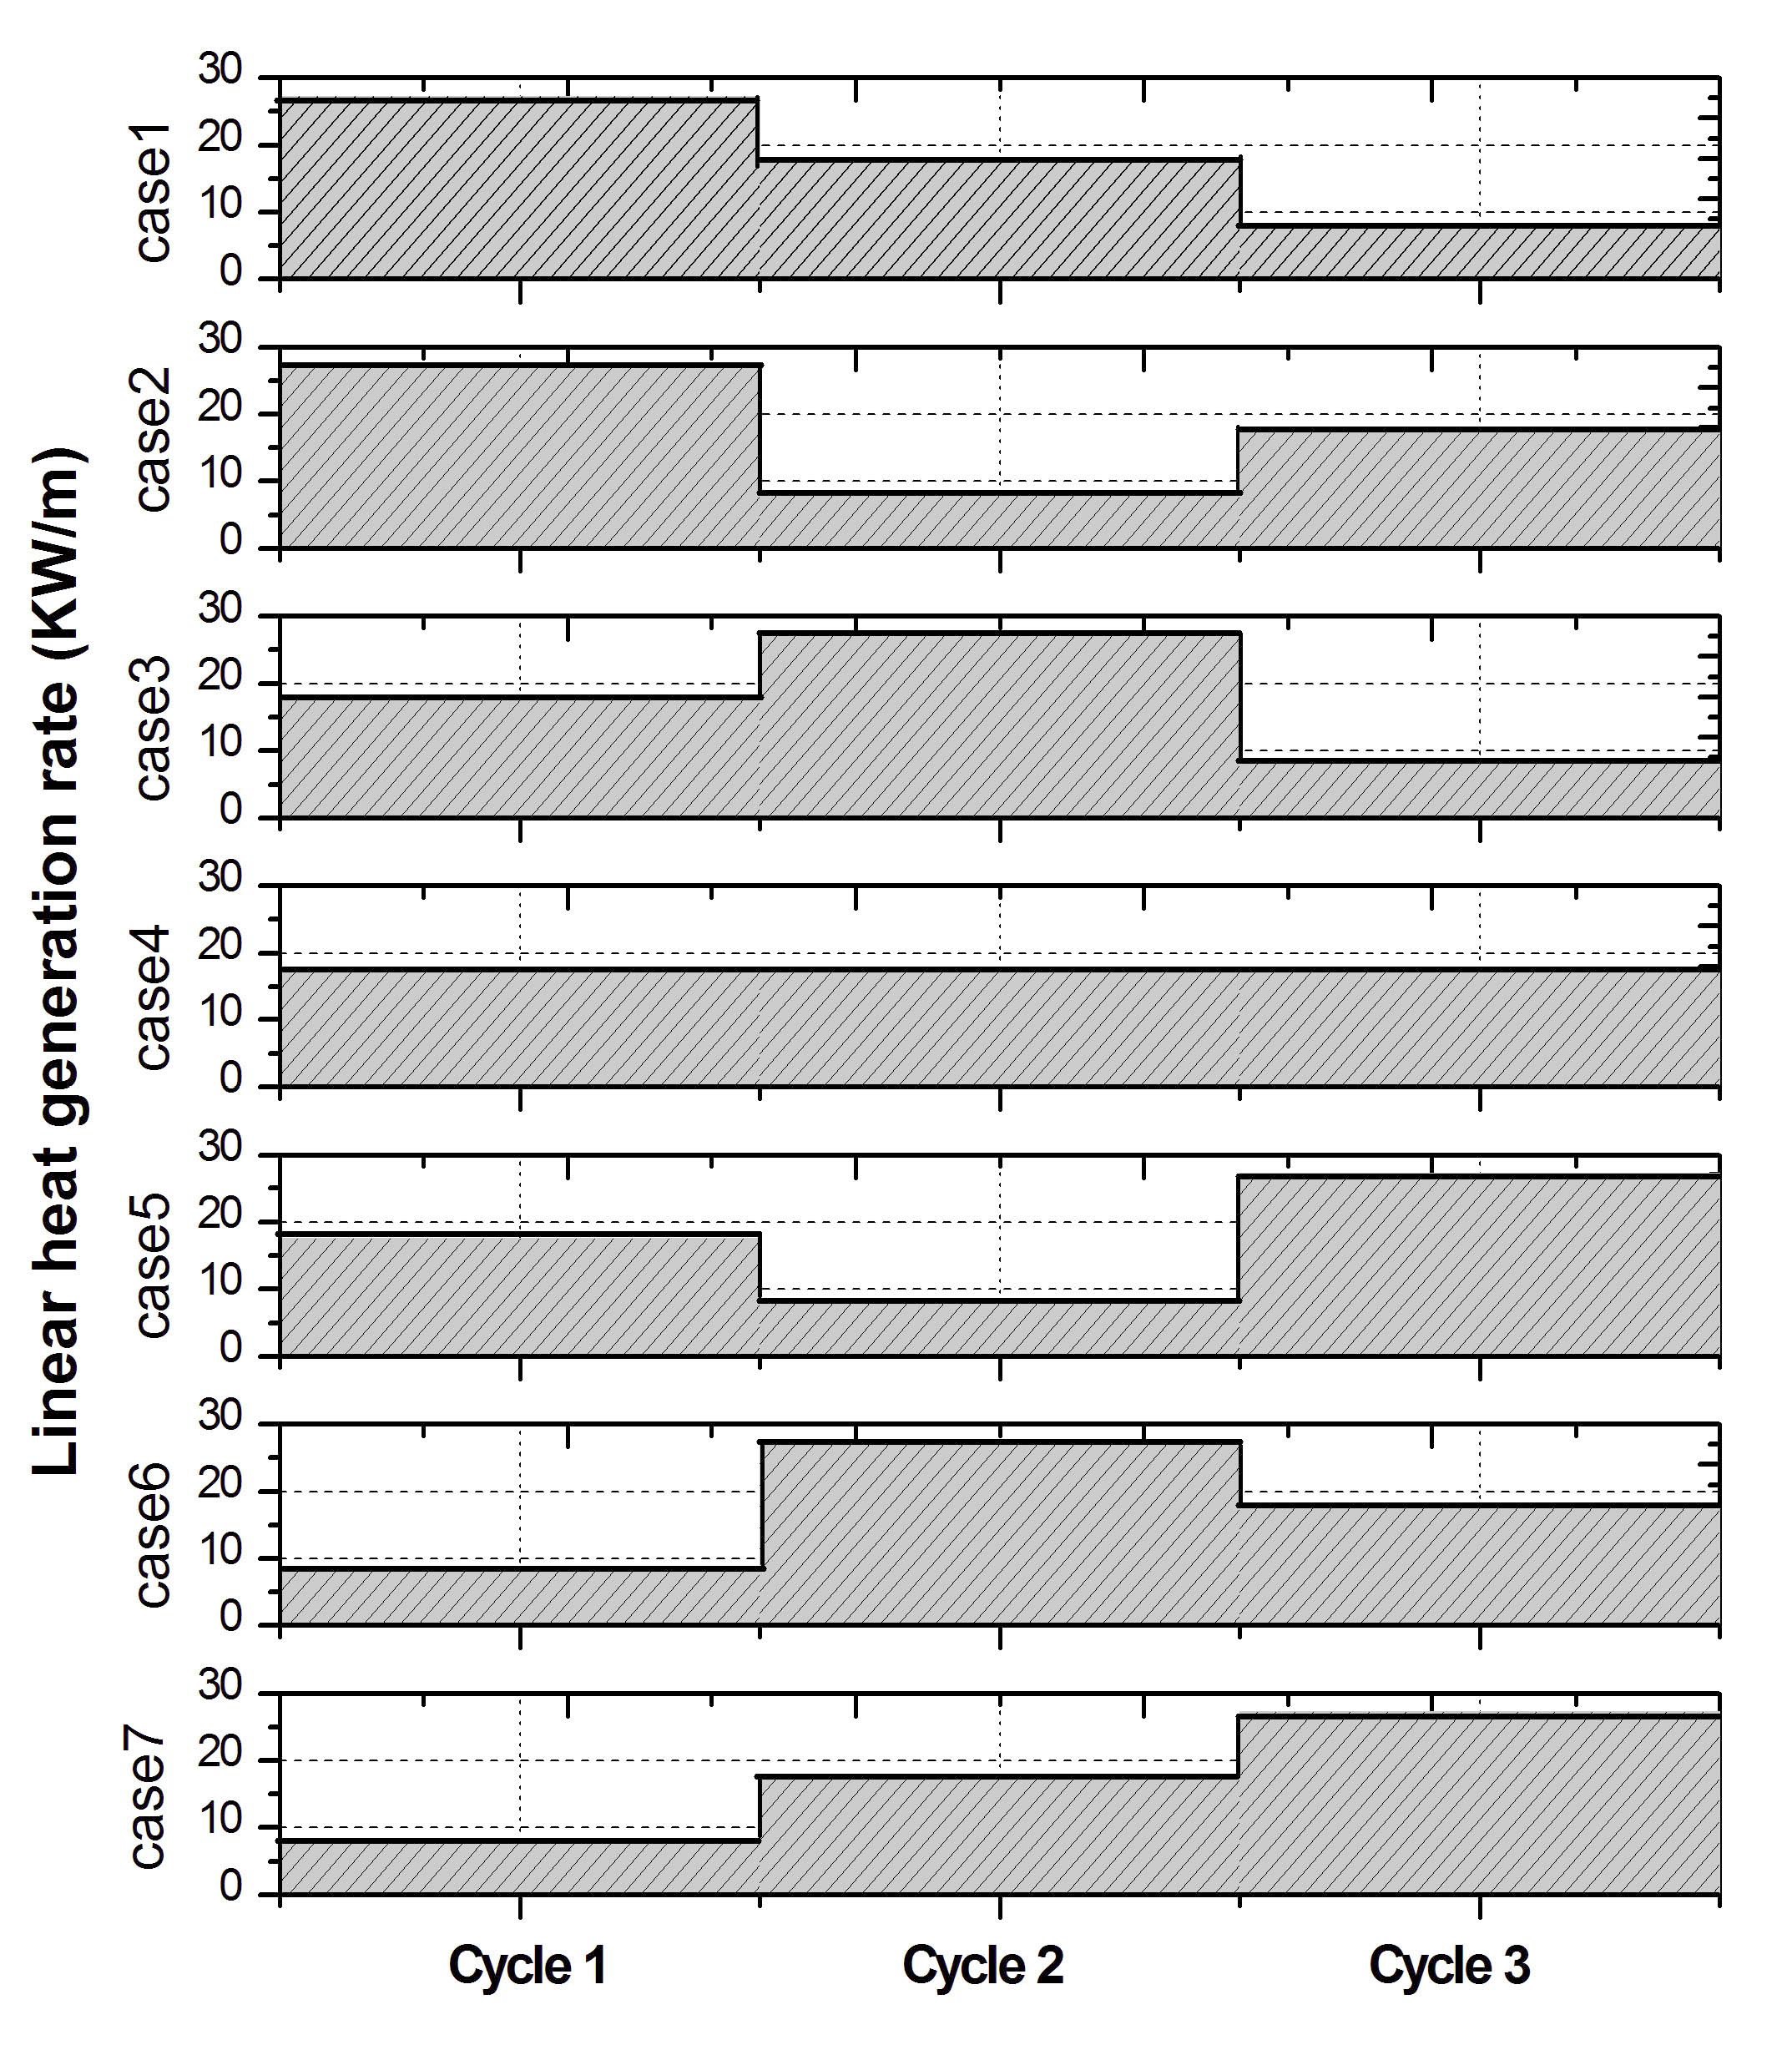
In this study, therefore, we traced the designed LHGRs of the two representative spent fuels with NDRs to determine the upper and lower bound values. As shown in Figure 4, thorough examination disclosed that the maximum and average LHGRs are 26.87 kW/m and 18.3 kW/m for V5H- 17×17 and 27.27 kW/m and 17.69 kW/m for KSFA-16×16, respectively. Then, in order to find the power-dependent variations of the initial characteristics, we suggested seven cases of three consecutive cycle operations enveloping all of the real fuel rod power histories by combining these maximum and minimum values (Figure 5).
In actuality, the following rules were applied to determine the power history for each case:
i) All cases have identical burn-ups and Effective Full Power Days (EFPD).
ii) Each case consists of three continuous cycles with their respective LHGRs, but linear power does not change within cycles.
iii) Even when fuel assemblies have the same power history, burn-up can differ because the loaded mass of uranium is different depending on the type of fuel assembly. In this case, EFPD is adjusted instead of the linear power.
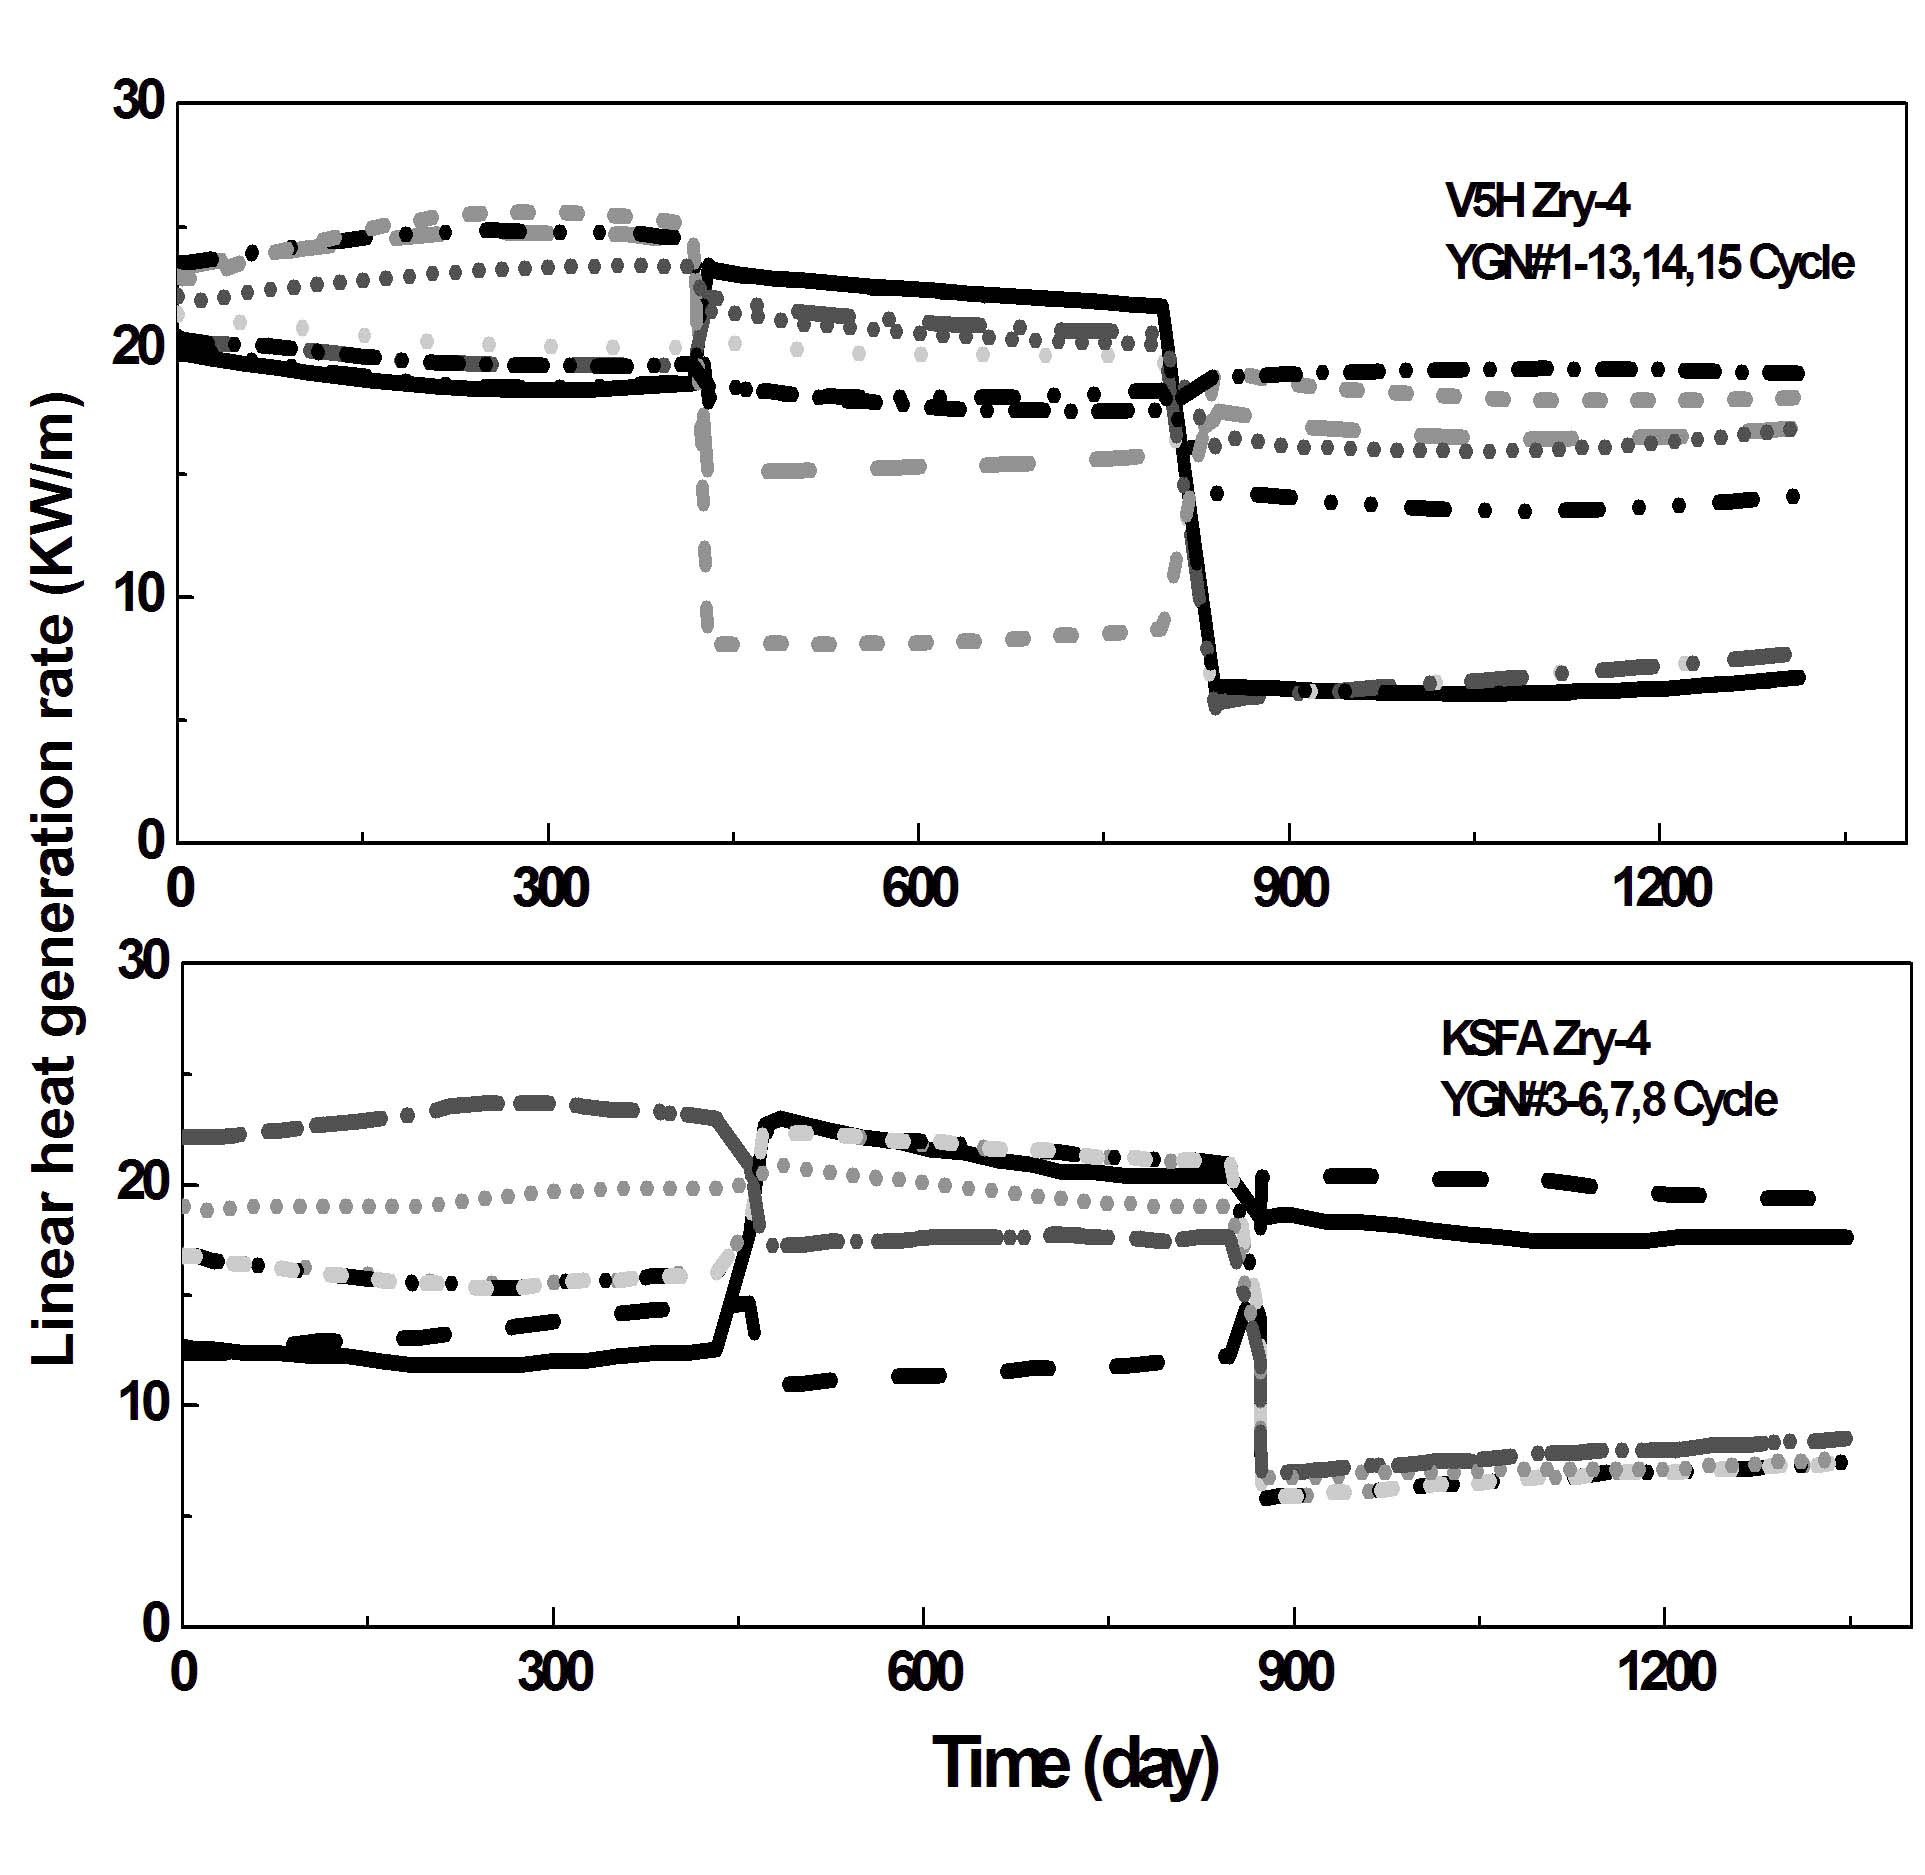
In the meantime, we traced the real power histories of the two representative spent fuels from the NDRs for additional inclusion in the evaluation to see if the current enveloping approach is adequate. The histories are plotted in Figure 6. A comparison of Figures 5 and 6 shows that the real power history seems to be different from the seven cases of postulated power histories, but can be included within the upper and lower bounds of the postulation.
As mentioned in the previous section, cladding oxide thickness, hydrogen concentration, and rod internal pressure are the most important initial conditions to be evaluated prior to fuel loading into a cask in long-term dry storage. These conditions are crucially influenced by the fuel burnup and its history.
In this section, we evaluated the conditions on the basis of the power histories reported in Figures 5 and 6. For the evaluation, we used FRAPCON-3 code [8] which was developed by the NRC to audit the fuel performance assessment. Then we compared the results with the available experimental and PIE (Post-Irradiation Examination) data.
3.1 Oxide Thickness and Hydrogen Contents Distribution
Oxide thickness
For Zircaloy-4 cladding under PWR conditions, FRAPCON-3 used the following corrosion model [8,9]:
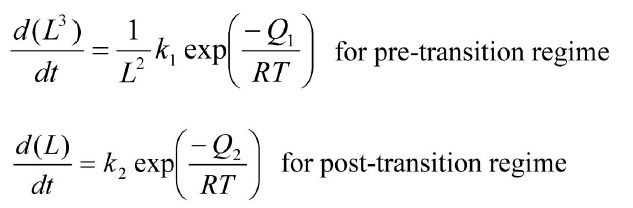
where L= oxide thickness (μm), Q1= 32,289 (cal/mol), Q2= 27,354 (cal/mol), k1= 6.3×10⁹(μm3/day), k2= {8.04×10⁷+2.38×10⁸(1.91×10⁻¹⁵F)0.24}, F= fast neutron flux (n/cm2sec), and T = temperature of the oxide-metal interface (K). As seen in the formulation, a cubic rate law is applied as a function of time until the transition thickness of 2 μm is reached, while a flux-dependent linear rate law is applied in the post-transition regime, with the rate constant being an Arrhenius constant of the oxide-metal interface temper-ature.
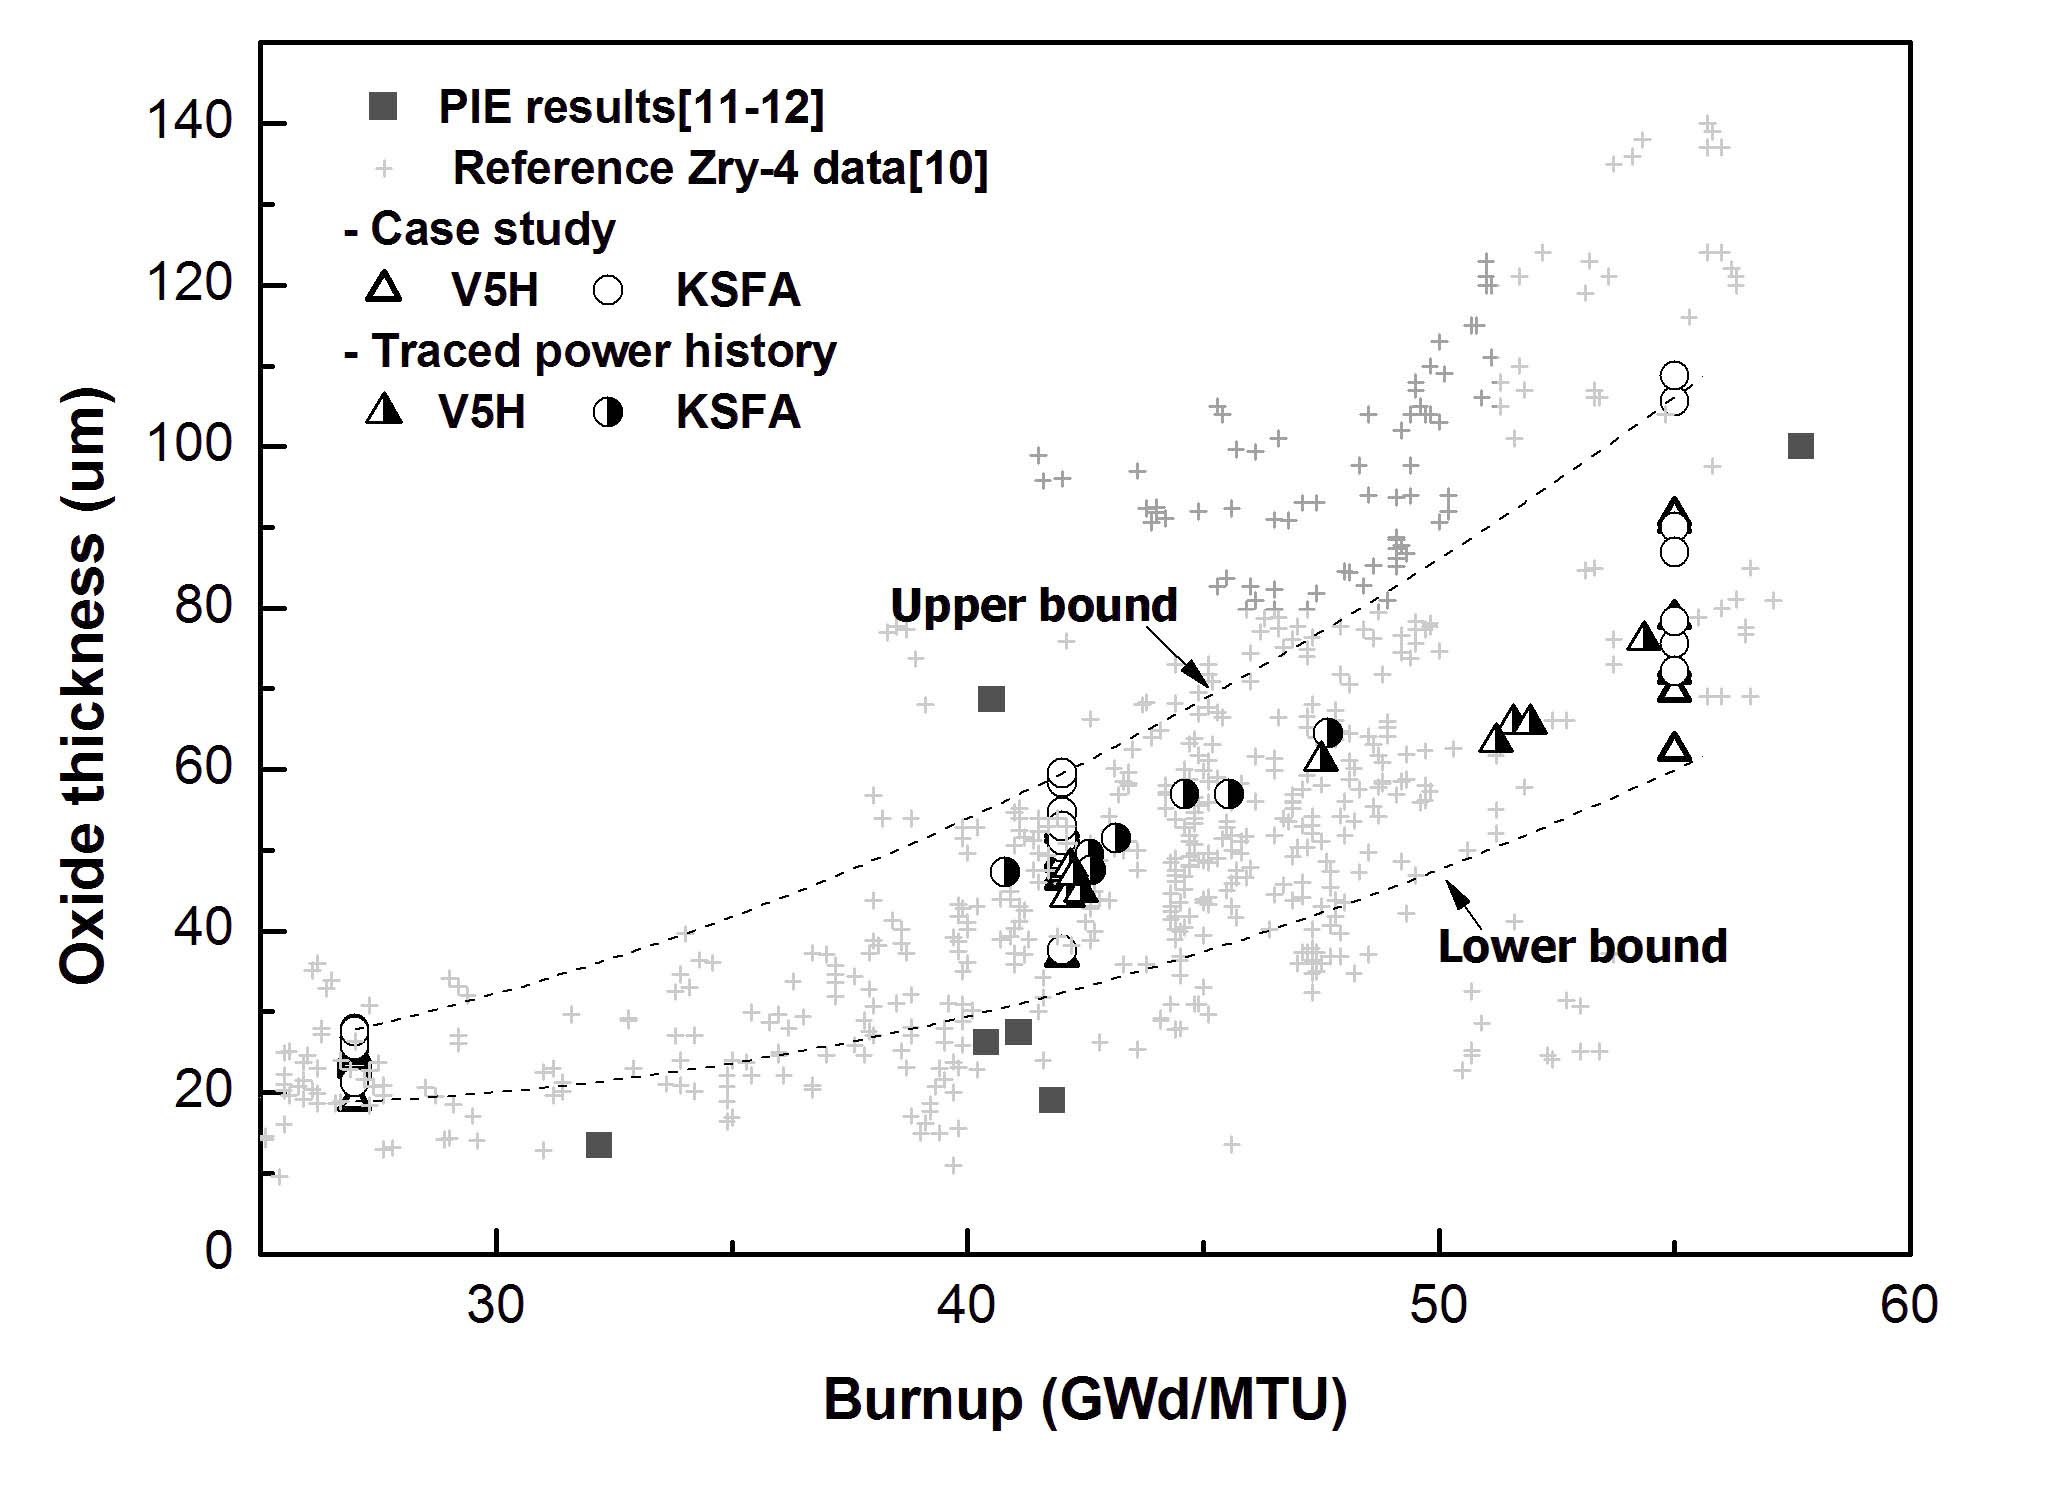
The computation results are plotted in Figure 7, and this figure shows an increasing oxide thickness trend with the increasing discharge burn-up. The figure also reveals that when the burn-up exceeds 55 GWd/MTU, the thickness increases acceleratively with the burn-up, reaching up to 100 μm. These results also show that the thickness variation can more than double, even at the same burn-up, depending on the power history. For example, the lower
bound value of the oxide thickness is around 30 μm, while the upper bound thickness is about 60 μm at 42 GWd/MTU, which is the average burn-up of domestic spent fuel.
This figure demonstrates that the in-pile Zircaloy-4 data in reference [10] are in good agreement with the current results, residing between the upper and lower bound limits. The simulation results that follow the real power history of the two representative spent fuels (Figure 6) also show excellent agreement. Several PIE data [11,12] included in the figure show that they agree with the current evaluation, particularly at high burn-up. For reference, a burn-up greater than 45 GWd/MTU is conventionally classified as high burn-up in this field.
It is noteworthy to discuss that the PIE data from the V5H-17×17 fuel at 40.531 MWd/MTU in the figure shows an unusually large thickness above the upper bound limit. Close examination reveals that the oxide grew up to 68 μm due to CRUD (Chalk River Undesirable Deposit) formed on the surface with a 10-μm thickness. Actually, this phenomenon is called CRUD-induced excessive oxide growth, which we often observed on the PWR Zircaloy-4 cladding surface, especially in a high burn-up fuel.
In this study, the oxide growing on KSFA-16×16 fuel cladding surface is slightly thicker than that of V5H-17×17 fuel, even at the same discharge burn-up. This is ascribed to the fact that the coolant inlet temperature in the Korean Optimized Power Reactor (OPR) using KSFA-16×16 fuel is higher than that in the Westinghouse-designed reactor with V5H-17×17 fuel. In fact, they are 291.3 ℃ and 294.2 ℃, respectively. However, the current results clearly show that the power history of a fuel influences the oxide thickness growth more than its fuel type.
Hydrogen concentration in the cladding
The cladding locally absorbs some of the hydrogen liberated in the metal-water oxidation reaction, and this reaction can be expressed as follows:
Zr+2H2O→ZrO2+f(4H)
This is the well-known hydrogen pick-up phenomenon, and the fraction, f, is called the hydrogen pick-up fraction. Actually, this is the direct cause of the hydrogen concentration increase in the spent fuel cladding. For Zircaloy-4 used in PWR, a constant hydrogen pick-up fraction has been found to be applicable, whereas for Zircaloy-2 under BWR conditions, a burn-up dependent model is required. Practically, FRAPCON-3 uses 0.15 for Zircaloy-4.
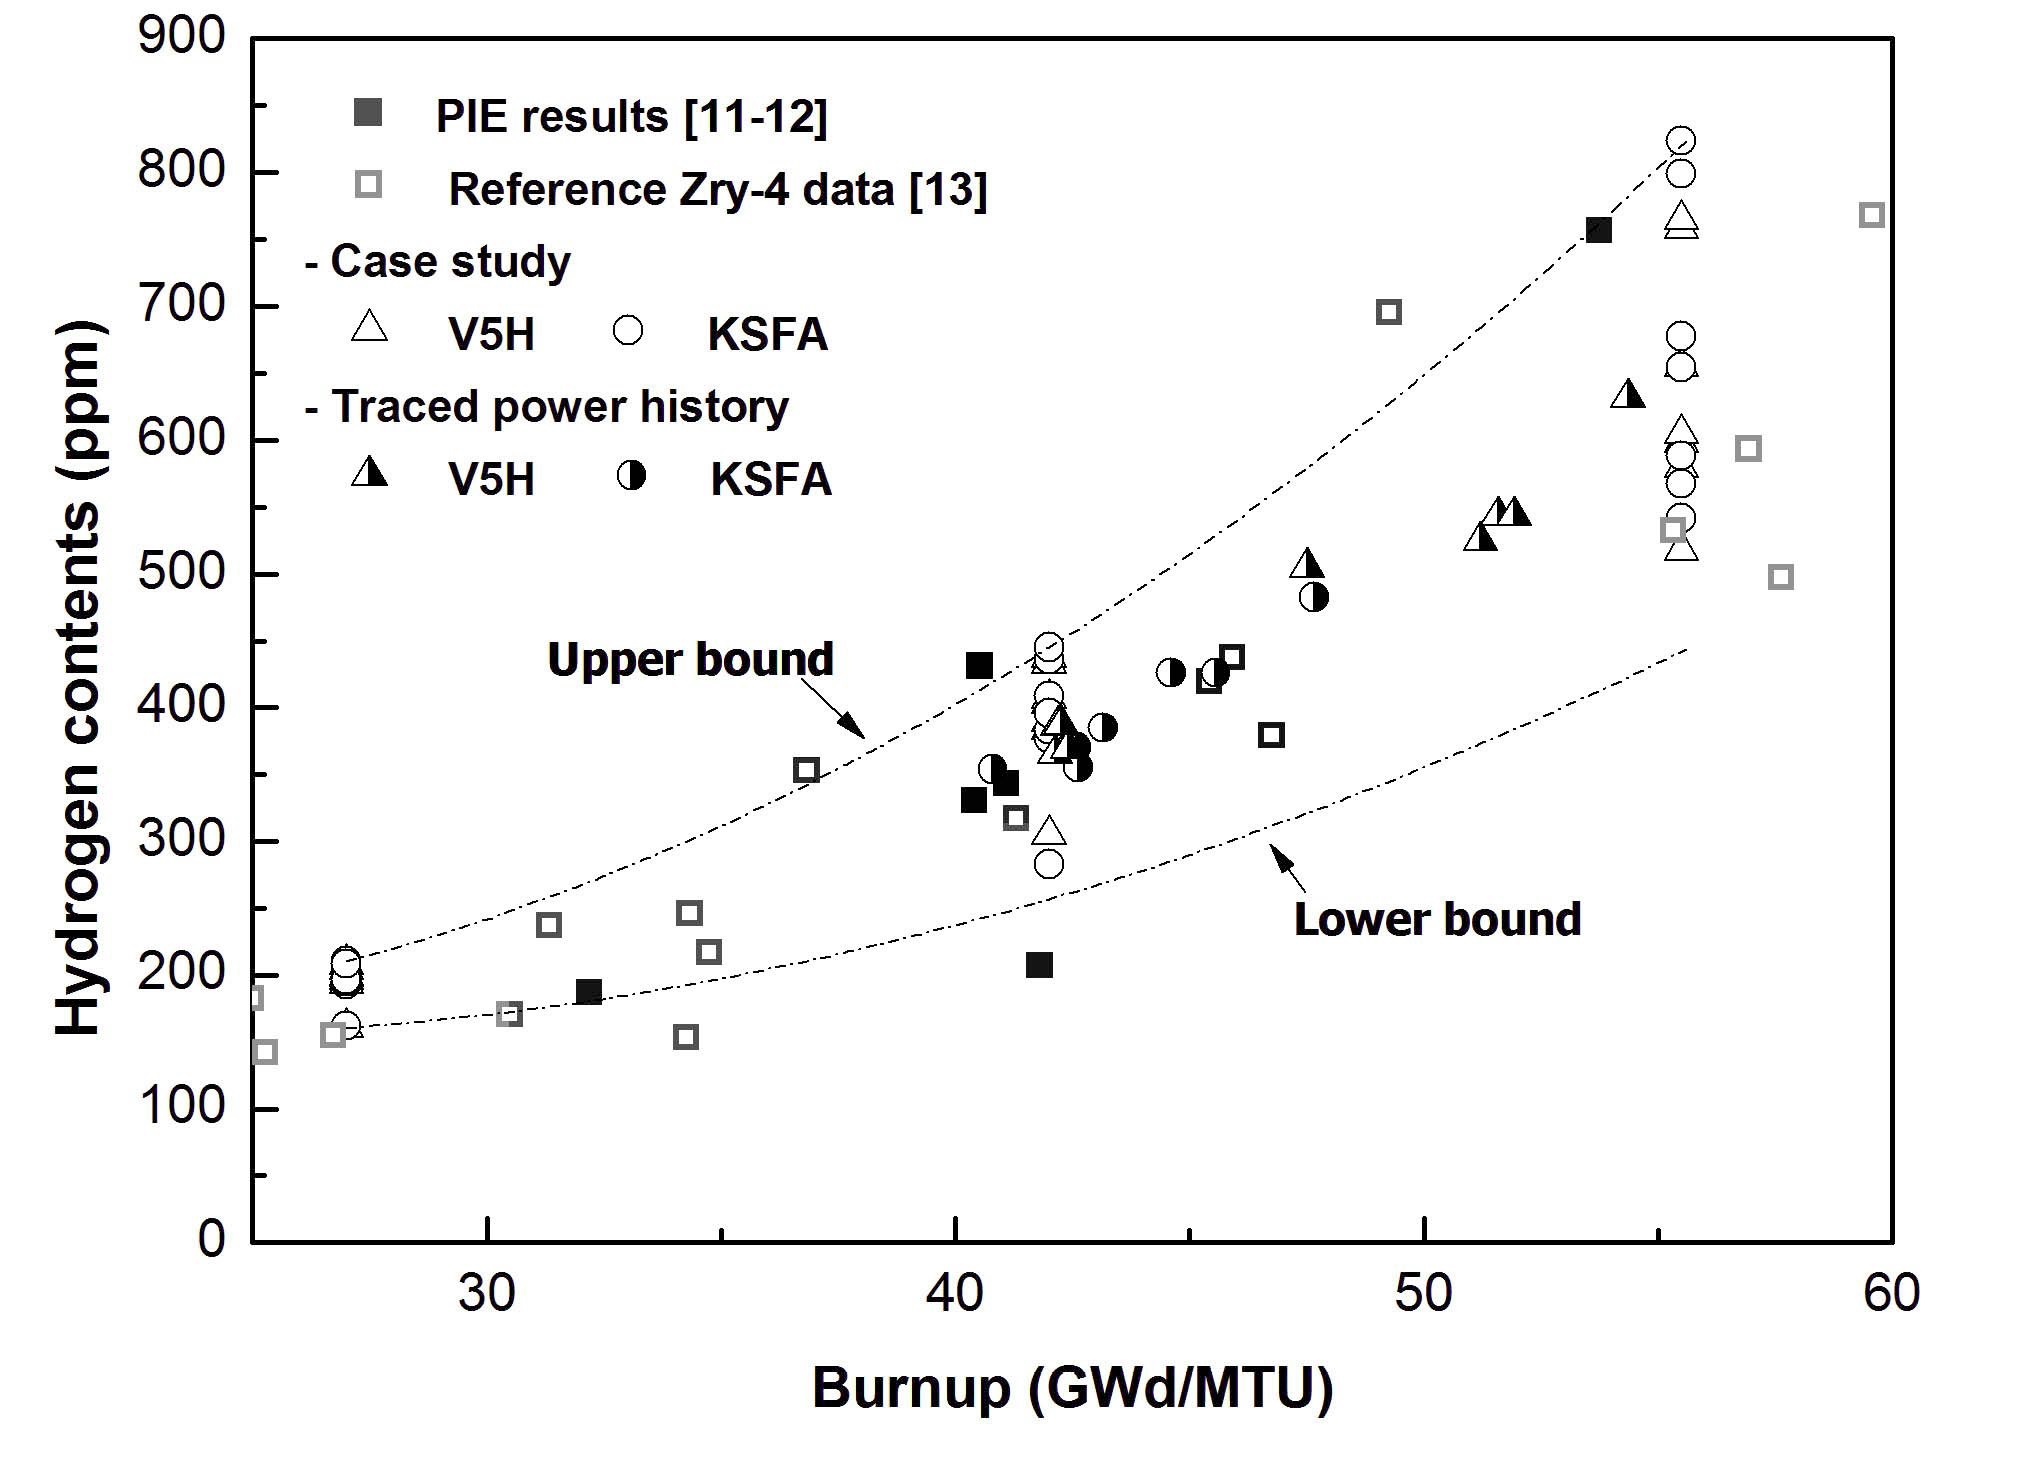
Figure 8 shows the computation results, showing the hydrogen concentration tendency with the fuel discharge burn-up. Most of the Zircaloy-4 data in the ASTM report [13] that were included for comparison are in good agreement with these results. They follow the concentration increasing trend with burn-up, staying between the upper and lower bound limits. It is also found that the real power history simulation results are in the middle of the bounds, while the PIE data are close to both limits.
The figure shows that the lower and upper bound values
are 250 and 500 ppm, respectively, at 42 GWd/MTU, which is the average discharge burn-up of domestic spent fuels. This confirms that the hydrogen concentration can also vary twice, even at the same burn-up, depending on the power history. As expected, these results also support that the power history of a fuel is a stronger influence than its fuel type.
These results demonstrate that the hydrogen concentrations in current domestic spent fuel claddings are expected to be insufficient to promote the cladding degradation mechanisms during long-term dry storage, but when the burn-up is greater than 50 GWd/MTU, the concentration can exceed the fuel design limit concentration of 600 ppm [14,15], which may require special concern.
Through case studies we have found that, even at the same discharge burn-up, spent fuels experiencing high power operation in the last cycle, such as in cases 5 and 7, have the thickest oxide and highest hydrogen concentration in the cladding, whereas the fuels undergoing just intermediate power operation over three cycles, such as in case 4, have the lowest oxide thickness and hydrogen concentration. This implies that cladding degradation during long-term dry storage may begin earlier in the former spent fuel than in the latter.
3.2 Rod Internal Pressure and Cladding Hoop Stress
Rod internal pressure
A fuel rod is initially filled with helium gas when manufactured, and later, the internal pressure builds up steadily due to the release of fission gas from the fuel pellet during the reactor operation. In fact, it is well-known that fission gas release is crucially influenced by fuel power history, and the release of gas accelerates with increasing burn-up, especially in a high burn-up regime.
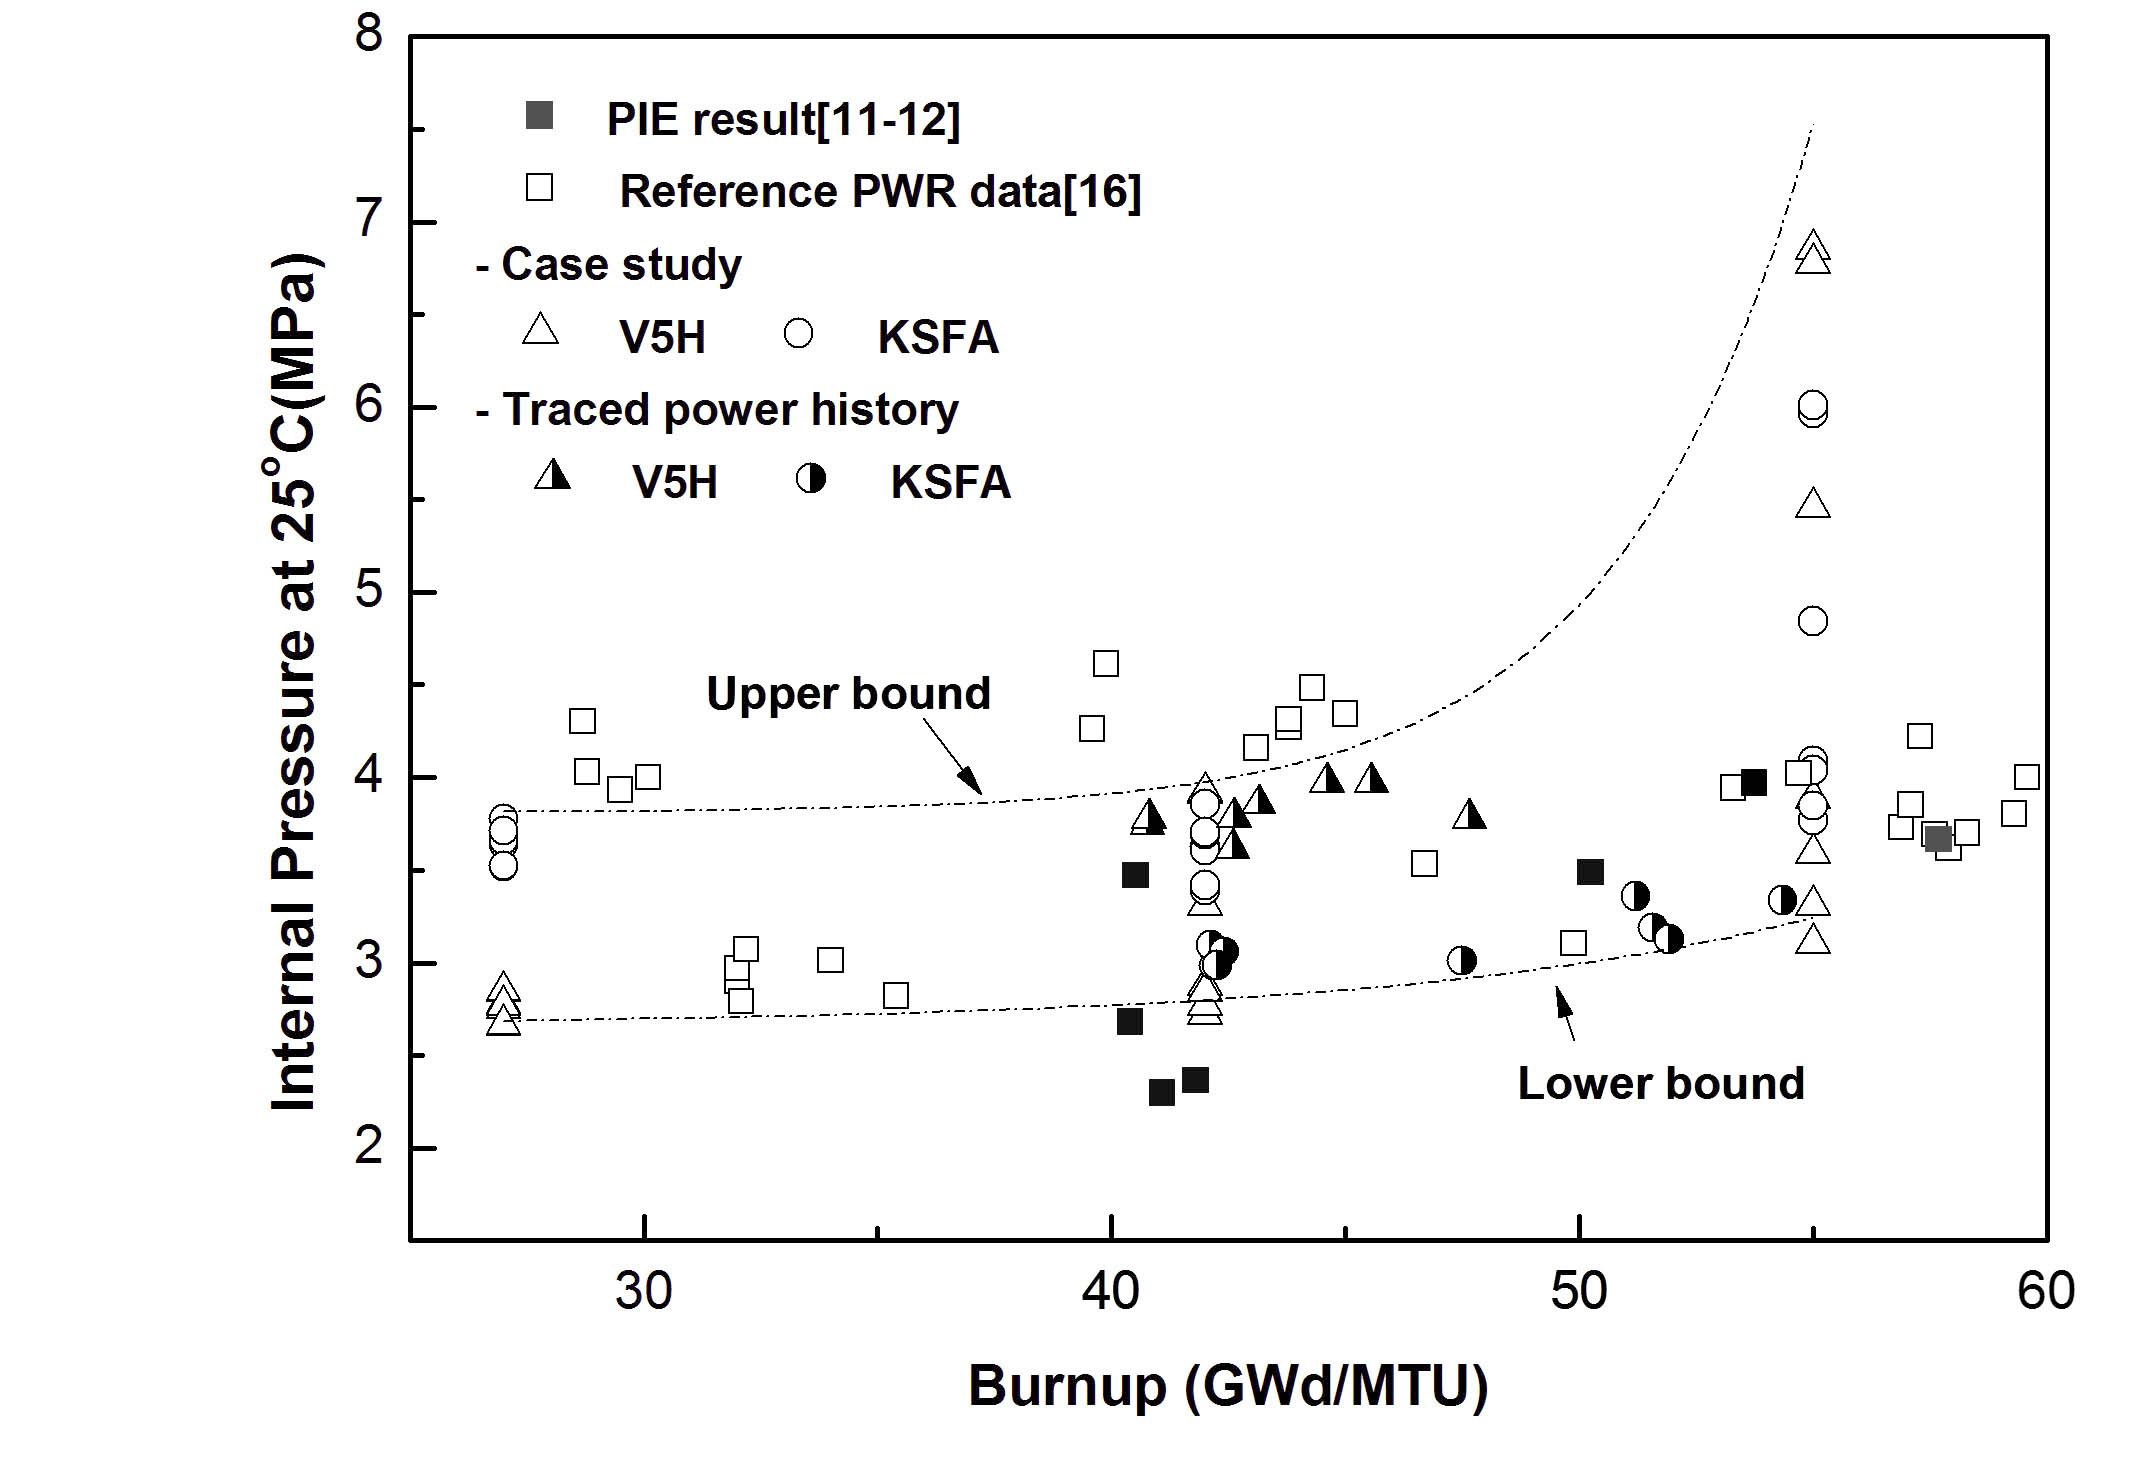
As expected, Figure 9 shows that as the discharge burn-up increases, the rod internal pressure of domestic spent fuels increases within the upper and lower bound
limits, particularly with the accelerative increase in the high burn-up range. Reference data from PWRs [16] and several PIE data are plotted together in the figure for comparison, which shows agreement with the current analysis.
This figure demonstrates that the variation of the pressure according to the power history is larger than the oxidation and hydrogen concentration, especially in the high burn-up region. Further examination shows that the reactor operation such as those in cases 5 and 7 can release much more fission gas from the pellet than other types of operations. The importance of the power history is also supported in the figure by the fact that some PWR data and PIE data spread over both of the bound limits. In the pressure assessment, we considered the initial helium pressure and void volume, including the plenum, because those in KSFA-16x16 and V5H-17×17 fuels are different. For example, the initial charging pressures are 2.61 MPa for KSFA-16×16 and 1.93 MPa for V5H-17×17.
Cladding hoop stress
The hoop stress is determined from the rod internal pressure, and the formula can be expressed as follows:
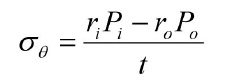
where
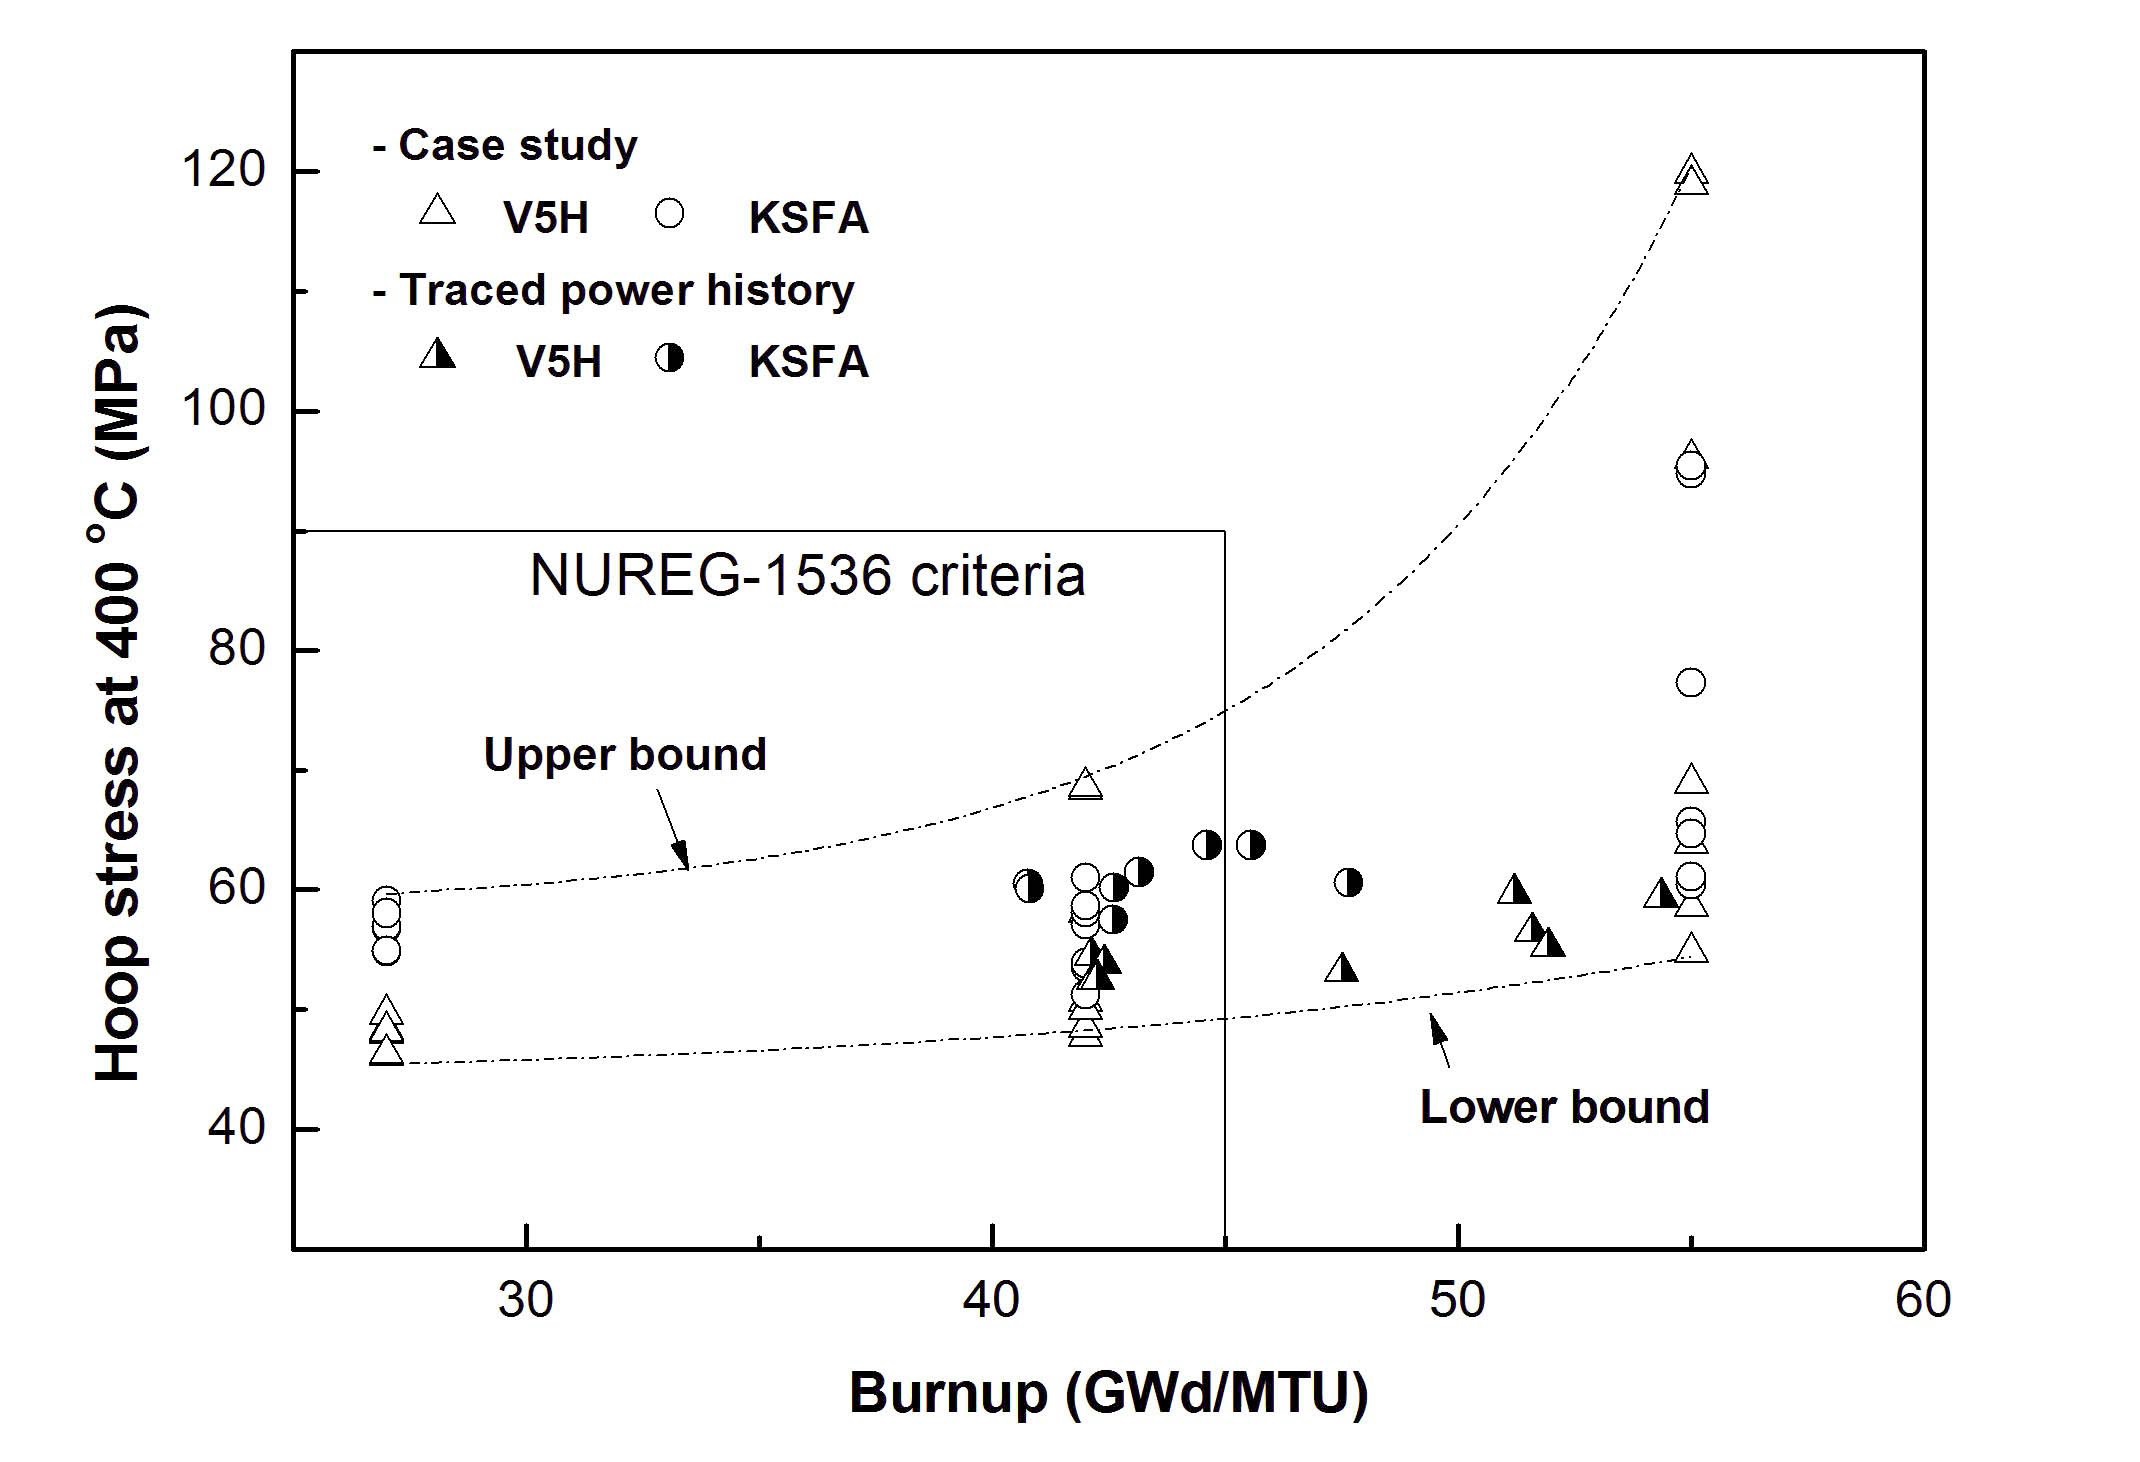
However, these results clearly indicate that when the
discharge burn-up exceeds 50 GWd/MTU, the hoop stress may exceed the licensing criteria, even for a low burn-up fuel. Therefore, recalling the fact that the average and maximum discharge burn-ups of domestic fuels had already reached 45 GWd/MTU in 2006 and 55 GWd/MTU in 2002, respectively, we now need to begin fundamental research and development to resolve any upcoming technical issues for the optional study of domestic spent fuel storage.
It is well-known that spent fuel cladding begins to degrade substantially during long-term storage, depending on the storage conditions. The degradation evolution crucially depends on various conditions, such as the cladding oxide thickness, the hydrogen concentration, and the rod internal pressure which are developed in the cladding during the reactor operation. The principal variables triggering the degradation are hoop stress caused by the rod internal pressure and the cladding temperature induced by decay heat.
In this study, we carried out wide-ranging examinations into the domestic spent nuclear fuels from statistical survey to burn-up and power histories. Based on the examination, we chose V5H-17×17 and KSFA-16×16 fuels as the representative domestic spent fuels, taking the current accumulation and future generation into consideration. The survey revealed that their average burn-ups have increased from 33 to 51 GWd/MTU and from 34.8 to 48.5 GWd/MTU, respectively, as of 2010.
Then, we fundamentally evaluated the characteristics of the two fuel types. The evaluation shows that at their average burn-up of 42 GWd/MTU, the oxide thickness, hydrogen content, and hoop stress range from 30 ~ 60 μm, 250 ~ 500 ppm, and 50 ~ 75 MPa, respectively. We confirmed that different power histories of a fuel influence the initial characteristics more than different fuel type.
These findings are in good agreement not only with previous works but also with the PIE results. We also found that even at the same discharge burn-up, KSFA-16×16 spent fuels have a slightly thicker oxide and higher concentration of hydrogen due to the higher coolant temperature, whereas the rod internal pressure of V5H-17×17 is a little higher than that in KSFA-16x16 because of the smaller rod void volume.
On the other hand, this study revealed that when the burn-up exceeds 55 GWd/MTU, the oxide thickness can reach 100 μm, the hydrogen may precipitate up to 800 ppm, and a hoop stress of 120 MPa can be attained in the spent fuel cladding, depending on the power history.
Therefore, these results demonstrate that most Korean spent nuclear fuels belong to the low burn-up spent fuel category, so they are expected to remain within safe bounds in long-term dry storage if the storage system is properly designed and maintained. However, this study clearly demonstrates that when the discharge burn-up exceeds 45,000 MWd/MTU, the initial characteristics may be substantially deteriorated prior to storage due to the excessive hydrogen concentration and the hoop stress applied in the cladding, so that the degradation may reach the licensing criteria limit in the early stage during long-term dry storage.
Recalling the fact that even the average discharge burnup of domestic fuels had already reached 45 GWd/MTU in 2006, we expect that a variety of experimental and analytical studies and developments will be following for the optional study of interim or long-term spent fuel storage, particularly focusing on reliability and safety issues. In concert with the technical efforts, we also hope that Korean government will prepare the development of the nation’s own regulations and guidelines for the future management of our spent fuels, including long-term dry storage.

![Inventory Ratio of Spent Fuel for Each Reactor and Fuel Type [7] (unit: percent)](http://oak.go.kr/repository/journal/12389/OJRHBJ_2013_v45n3_377_t001.jpg)
![Annual Production Amount and Burn-up Trend of Spent Fuel [4]](http://oak.go.kr/repository/journal/12389/OJRHBJ_2013_v45n3_377_f001.jpg)
![Cladding Temperature Limit for Dry Storage in the USA [5]](http://oak.go.kr/repository/journal/12389/OJRHBJ_2013_v45n3_377_f002.jpg)