Biometrics is a science that studies automated methods for identifying or verifying a person based on their physiological or behavioral traits. Various features have been used for human identification, such as the face, fingerprints, palmprint, handwriting, iris, gait, and voice. Gait recognition is considered to be a non-coercive recognition method that is practical for use at a distance.
Gait recognition is classified into two categories: model-based approaches and silhouettebased approaches [1]. Model-based approaches focus on describing the static and dynamic characteristics of human walking using model parameters [2]. Silhouette-based approaches make intuitive interpretations based on the observed images. In particular, the gait energy image (GEI) is used frequently in silhouette-based approaches.
GEI-based methods have advantages for individual identification because they include simple spatiotemporal movement changes in an image [3]. However, these methods have view-dependent limitations in two dimensions (2D), like other silhouette-based approaches [4]. Bouchrika et al. [5] demonstrated that view-dependency affects gait recognition significantly.
Two methods have been applied widely to overcome the limitations of view-dependency in 2D. The first method trains the image data depending on various views. Methods were developed by BenAbdelkader et al. [6] and Wang et al. [7]to identify a person using various images from different views. The second method simply extracts the least view-sensitive features from the gait. Han et al. [8] proposed a statistical method for identifying view-insensitive features.These methods are useful in some restricted cases but it can be difficult to identify a person in practice due to the low recognition rate.
Alternatively, the features extracted from three-dimensional (3D) data can be used to overcome the view-dependency problem. Sivapalan et al. [10] studied the gait energy volume (GEV), which is an extended version of the GEI method that uses frontal depth images. Tracking people using multiple cameras was also studied by Zhao et al. [11], who found that individual movements can be recognized clearly in 3D based on the joint trajectories of the lower limbs and body information, such as the height and leg length.
Distortion of appearance is another problem that affects silhouette-based gait recognition. Lee et al. showed that the elimination of appearance distortions, such as carrying a backpack or a handbag while walking, is necessary for gait recognition because objects carried while walking lead to incorrect silhouette images. Thus, principal component analysis (PCA) was applied recursively to overcome the distorted appearance problem [12]. Similarly, Pratheepan et al. proposed a method to overcome the distorted appearance problem, which generated dynamic and static feature templates of silhouette images based on motion history images [9].
However, both of the problems mentioned above can be overcome using 3D motion capture data that contain points on body parts. The gait data obtained using points on the body in 3D are independent of the viewpoint. Furthermore, it is easy to extract points on the body such as the head, leg, or arm even when objects interrupt the body, unless the overall appearance is obscured. Individual identification based on gait would be useful in practice if a person could be identified using trajectory information from the body points in 3D.
In this study, we investigated the feasibility of gait recognition based on points on the body in 3D and we also compared four different methods to identify the most effective method for gait recognition using body points. The first two methods used feature vectors extracted from the gait voxel intensity, which is conceptually similar to GEI. The other two methods used feature vectors extracted by principal components analysis of the trajectories of the body points and joint angles.
A 3D motion capture system was used to obtain gait data from people in 3D space where 35 markers were attached to the body and tracked to extract the point trajectories of the body during walking. In addition, four shoes with different heel heights were used to investigate the effects of shoe variability. This was because Phillips et al. [13] found that the gait recognition performance was degraded with different shoes types and ground surfaces, because these external factors affected the individual gait of a person. At present, this is not considered
to be a critical problem during gait recognition, but it will be important for practical applications.
Gait recognition with the four different shoe conditions was performed using four feature vectors and the recognition rates were compared to determine the characteristics of the feature vectors and the effects of heel height. Finally, the cumulative matching characteristics (CMC) curves were obtained to illustrate the recognition results.
2. Data Collection and Preprocessing
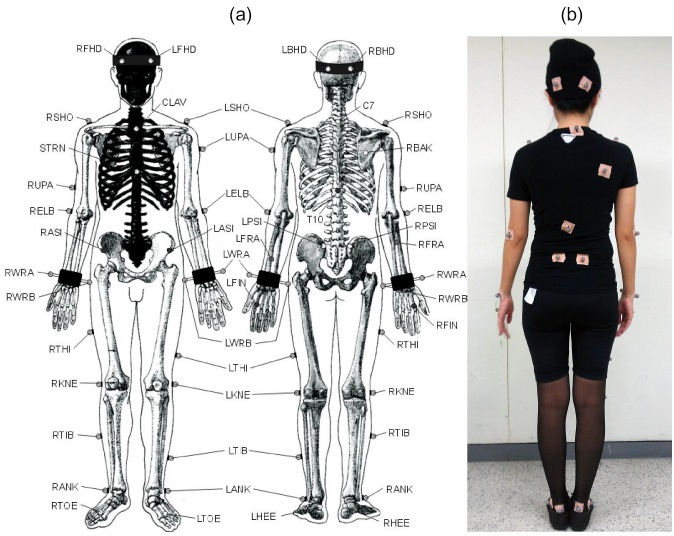
Gait data were collected using 3D motion analysis system (Vicon Motion Capture System Ltd., Oxford, UK) at Advanced Institutes of Convergence Technology (AICT, Suwon, Korea). Ten women participated in the experiment, whose average age, height and weight were 21.0 ± 0.85 years, 159.68 ± 4.18 cm and 50.10 ± 3.31 kg, respectively. Thirty-five reflective markers (14 mm spheres) were attached on the body of the participants based on Vicon Plug-in-Gait marker set (4 in the head, 15 in the upper body, and 16 in the lower body). Three walking trials of each participant were captured at 100 Hz by 12 cameras which have a resolution of 16 megapixels (Vicon T160 Camera, Vicon Motion Capture System Ltd.). All participants walked at their preferred speed under the four different types of shoes (flat shoes of 1.2 cm heel, medium heels of 4.7 cm heel, wedge heels of 7.5 cm heel, and high heels of 9.8 cm heel).
This experiment was approved by the institutional review board of Seoul National University. Figure 1 shows a detailed description of the marker set (Figure 1a) and an example of attached markers on the body (Figure 1b).
Kinematic data of walking were obtained from 10 participants using Vicon Nexus software. Thirty-five marker point trajectories were extracted in x-axis (anterior direction), y-axis (lateral direction), and z-axis (vertical direction), respectively. Fiftythree joint angle trajectories were calculated from the marker point trajectories by the software.
To define the starting frame of one gait cycle, we chose a key frame at the instant of which the distance of two feet on the ground are farthest away in x-axis as Collins et al. [14] choose. Each walking cycle of all participants starts from the key frame and ends before the next key frame.
3. Feature Modeling and Classification
3.1 Feature Vectors Using Gait Voxel Intensity
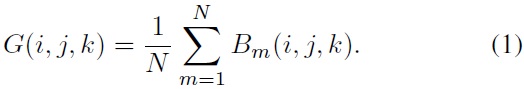
Gait voxel intensity is defined as the number of overlapped voxels in total frames during a gait cycle divided by the number of the total frames. This concept is similar to GEI, which uses silhouette images of the whole body in 2D. However, we use voxels of some points obtained from motion capture data in 3D. The gait voxel intensity represents spatial-temporal information just as GEI does, but it is not view-dependent.
The gait voxel intensity is calculated as follows in our experiments. First, the marker data of a frame were positioned into the 3D space of 1500 × 1500 × 2000 mm (length × width × height) based on the center point of pelvis. The space is then divided into 60 × 60 × 80 voxels, which size is 25 mm3. A binary digit at each voxel in the mth frame is denoted as
In this paper, we obtain gait voxel intensity by two different ways: using marker points and using lines between two points.
Gait voxel intensity using marker points is calculated from the voxels of the 35 points which are the marker positions attached on the participants during a gait cycle. Meanwhile, gait voxel intensity using lines is obtained from the voxels of the 55 lines which are the straight line connecting two points among 35 marker points. From these gait voxel intensity, feature vectors

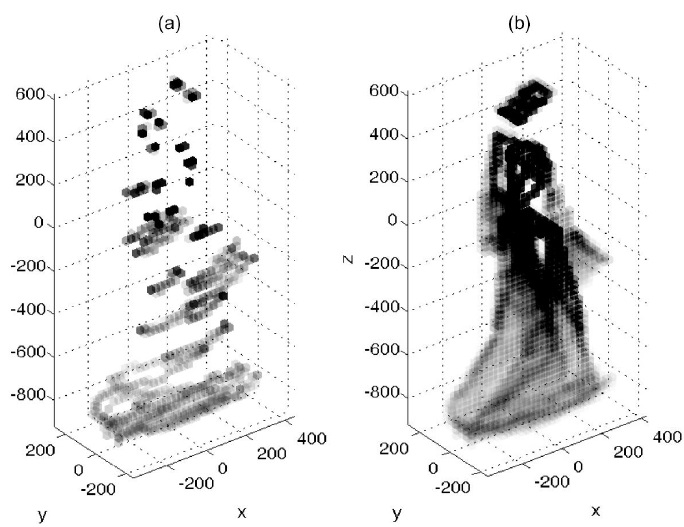
Figure 2 shows an example of gait voxel intensity in the 3D space: (a) using maker points and (b) using lines between two points. A voxel with higher intensity means that the voxel is overlapped more frequently in a cycle of walking. Thus, in the figure, dark colored voxels indicate that the body parts have little change of movement, for example the head part, while bright colored voxels mean a wide change of movement, for example the leg part.
3.2 Feature Vectors Using Principal Component Analysis
Principal component analysis (PCA) reduces the dimensionality of data, while highlighting similarities and differences of patterns in the data by choosing highest variance of the data [15]. Thus, it is often used to calculate feature vectors from GEI and silhouette-based images.
However, in our experiments, PCA is directly applied to trajectories of the body points or joint angles. This approach
[Table 1.] Description of the joint angles
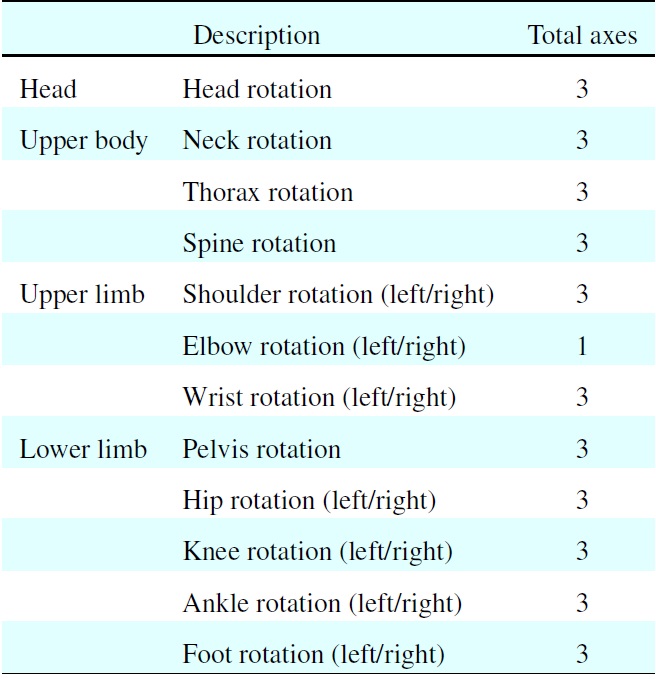
Description of the joint angles
is effective to reflect temporal kinematic information such as a percentage of a cycle, and duration of swing or stance phase, whereas GEI includes combined spatial-temporal information of a whole cycle in an image.
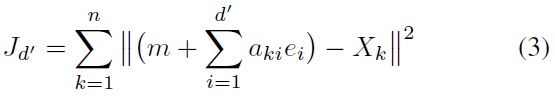
Using PCA, the principal components
where
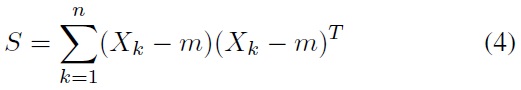
and the reduced dimension
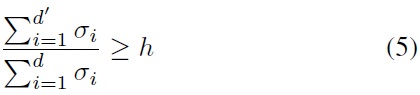
here
By the PCA algorithm, we extract feature vectors for gait recognition in two different ways: using trajectories of the body points and using trajectories of joint angles. The feature vector using PCA on the trajectories of the body points is calculated from the 35 marker points which are the same points used in gait voxel intensity with marker points. On the other hand, the feature vector using PCA on the trajectories of the joint angles is obtained from the 53 joint angles which are described in Table 1.
To calculate feature vectors from those trajectories, the gait data for 10 participants were normalized in the same number of frames because people have different durations of a gait cycle by different walking speeds. Therefore, range of the data was interpolated by linear time normalization in 50 frames for a gait cycle. In summary, a feature template
Finally, feature vectors using PCA are extracted as follows,
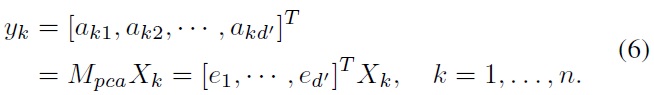
where
Once the feature vectors are extracted from four different methods: gait voxel intensity using points and lines and PCA using points and joint angles, Euclidean distance is used for classification. The similarity between training and validation data is determined by the distance among feature vectors.
4. Experimental Result and Analysis
Four gait motion cycles were captured with four different shoe heights from 10 people. Thus, we analyzed gait recognition data from 160 cycles in total. Of these data, 80 cycles were used as training data, which are referred to as gallery data. The other 80 cycles were used as validation data, which are referred to as probe data.
The gallery and probe data were used to compare the gait recognition rates with the four different methods. CMC curves were produced to illustrate the performance of the methods. The effect of heel height was also analyzed based on the recognition rates.
4.1 Gait Recognition Using Four Different Feature Vectors
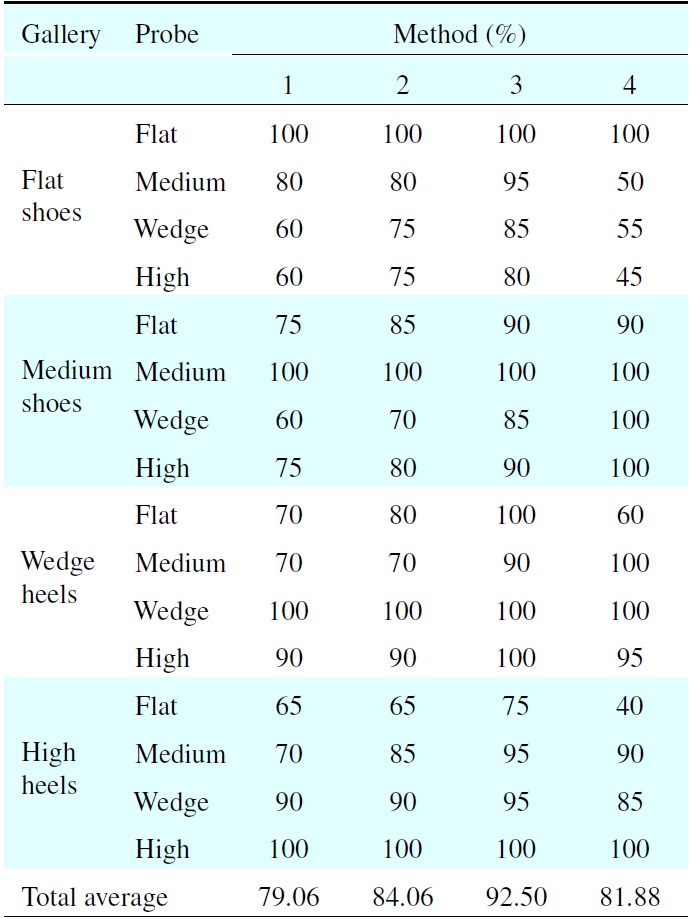
First, gait recognition with various shoe conditions was analyzed using four different methods. Table 2 shows the recognition rates, where method1 and method2 are the gait recognition results obtained based on the gait voxel intensity using marker points and the lines between two points, respectively. Method3 and method4 are the gait recognition results obtained using PCA based on the trajectories of the body points and the joint angles, respectively.
The total average recognition rate was higher using method2 than method1. This indicates that the gait voxel intensity was more effective when using lines to identify a person compared with the gait voxel intensity determined using points because the lines connecting two points could include more information related to the walking motion.
Method3 had a higher recognition rate than method1, although both methods used the same gait information, which was obtained from 35 marker points. This was probably because the gait voxel intensity only considered overlapping voxels and not the exact positions of the marker points in the voxels throughout the gait cycles. Therefore, for gait recognition based on points, the recommended method is the one that used the feature vectors extracted by the PCA, rather than the method based on the gait voxel intensity.
Gait recognition based on PCA of the trajectories of the joint angles was less effective than that based on the trajectories of the body points. Table 2 shows that the average recognition rate with method4 was lower than that with method3, and even lower than that with method2. This may be because the trajectories of the joint angles are affected more by different heel heights than those of the body points.
4.2 Cumulative Matching Characteristics (CMC) Analysis
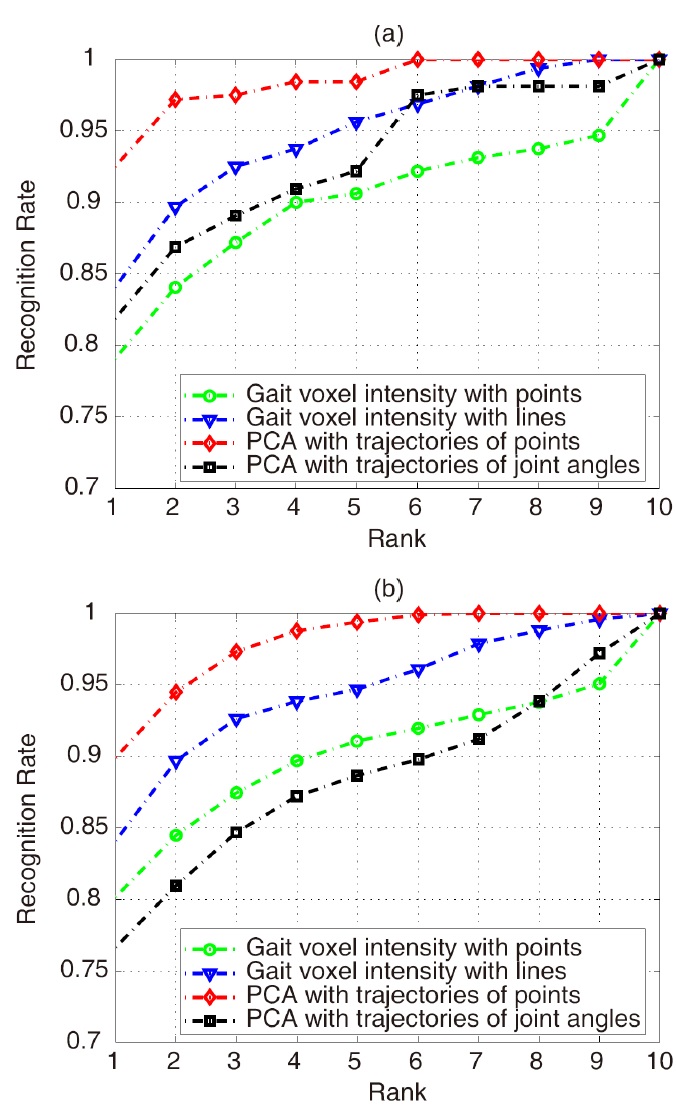
Cumulative Matching Characteristics (CMC) curves were generated to illustrate the recognition results using the four different methods. First, a CMC curve was computed by averaging the CMC curves using each separate type of shoe for all subjects as the gallery data. Each type of shoe was used as the gallery data and the four types of shoes were used as probe data separately. The CMC curve is shown in Figure 3a. In the CMC plot, the horizontal axis represents the rank while the vertical axis is the probability of a correct match. All four methods had recognition rates over 90% at rank 4. The most effective approach for
[Table 2.] Recognition rates using the four methods
Recognition rates using the four methods
identifying a person was method3, which applied PCA to the trajectories of the body points. Method2, which used the gait voxel intensity based on connecting lines, was more effective than method1, which used the gait voxel intensity based on points.
A second CMC curve was generated to consider more practical cases where the gallery was not constructed using only one type of shoe, i.e., people wore flat shoes, medium height shoes, wedges, or high heels in the gallery data. This CMC curve shown in Figure 3b was computed by averaging the CMC curves using randomly selected type of shoes for each person as the gallery data. The probe data were also selected randomly for each gallery data item. A discrete uniform distribution was used to select the gallery and probe data. Twenty-thousand tests were conducted to determine the average.
The plot shown in Figure 3b has the same trend as the plot in Figure 3a, except for method4. This is because the trajectories of the joint angles were dependent on the shoe height.
4.3 Effects of Shoe Types with Different Heel Heights
In this study, we used four different shoes to simulate practical gait recognition problems. Cowley et al. [17] showed that the heel height affects the gait style and posture, which may prevent accurate individual identification. This was confirmed by the results shown in Table 2.
To investigate the effects of heel height on gait recognition from a different viewpoint, the recognition rates in Table 2 were rearranged based on the difference between the heel heights in the gallery and probe data. The experimental shoes are listed by the heel height in ascending order: flat shoes (1.2 cm), medium heels (4.7 cm), wedge heels (7.5 cm), and high heels (9.8 cm).
[Table 3.] Recognition rate with different classifications
Recognition rate with different classifications
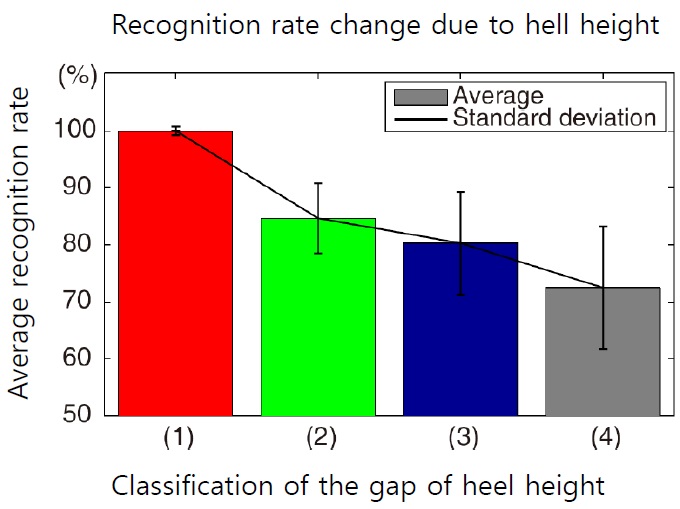
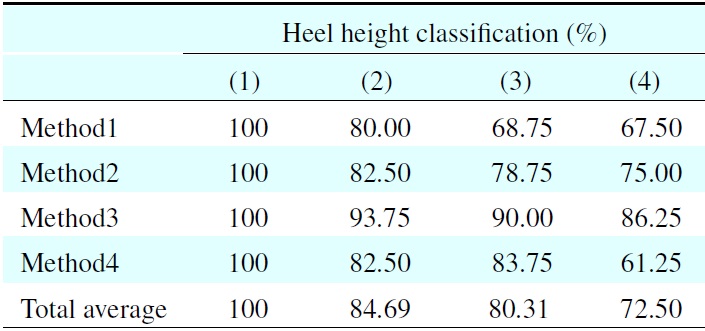
Next, the differences between the heel heights in the gallery and probe data were classified as follows for gallery-probe pairs: (1) the same heel height, e.g., flat shoes-flat shoes; (2) slightly different heel heights, e.g., flat shoes-medium heels; (3) moderately different heel heights, e.g., flat shoes-wedge heels; and (4) totally different heel heights, e.g., flat shoes-high heels.
The recognition rates for the four classifications are shown in Table 3. The overall average recognition rates are shown in Figure 4. The bar graph in Figure 4 demonstrates that the overall average recognition rate declined as the difference in the heel heights between the two shoes increased. This showed that the recognition of the gait of a specific subject could be incorrect, depending on the shoe conditions. However, method3 had the highest recognition rate of the four methods shown in Table 3.
If these gait recognition approaches are applied in practice, the feature vectors should be obtained from the gallery data before gait recognition. However, it can take a significant amount of time to process the gallery data to obtain feature vectors. By contrast, the processing time required to extract the feature vectors from the probe data and to perform classification is insignificant. For example, the four methods compared in the present study required less than one second using Matlab as the environment on a PC with an Intel processor (3.4 GHz clock frequency) and 4 GB of RAM.
In this paper, we proposed four feature vectors for gait recognition based on points on the body in 3D space and we investigated their feasibility by experiments using a 3D motion capture dataset.
We compared four different feature vectors using the gait voxel intensity and PCA to determine the most effective method of gait recognition using point information. We found that the analysis of the feature vectors using PCA based on the trajectory of the body points was the most suitable method for identifying a person.
In addition, we studied the effects of heel height on gait recognition using four different shoe types. This study showed that different heel heights affected the gait styles of subjects, which led to incorrect gait recognition.
Based on these results, we plan to investigate the feasibility of gait recognition using points on the body in a 2D partial view. Furthermore, our future work will determine how many points are required to identify a person and the specific body parts where they should be positioned.