Cloud analysis is a challenging but critically important task for many practical applications such as weather forecasting and air traffic control. One of the main difficulties is that the texture of clouds is variable under different atmospheric conditions. Although the infrared or near-infrared or vapor image is available from the satellite [1], it is not very helpful in quantifying small and/or low-altitude cloud features owing to their limited spatial resolutions and unknown surface influences on the measured radiances [2].
Cloud types are classified into several groups. When the updraft is strong, cumuliform type clouds with a vertical shape appear and the horizontal-shape stratus-form clouds appear when the updraft is weak. The types of clouds are also different according to their altitude. At high altitude, we find cirrus, cirrustratus, and cirrocumulus clouds. At low-altitude, we find stratocumulus, nimbostratus, and stratus. Altostratus and altocumulus clouds are found in the middle, and cumulus and cumulonimbus clouds are known to spread from low altitude to high altitude [3]. Many have taken traditional and theoretical approaches in cloud-type classification, and many have taken intelligent approaches based on machine learning with different purposes and paradigms. The approaches, include maximum likelihood [4], instance based learning [5], neural network [6], fuzzy logic [7,8] and the K-nearest approach [9]. Some researchers also tried to use different feature extraction methods to improve classification quality [2,9-12].
While no single methodology prevails over others in terms of accuracy, the choice of algorithm is largely dependent on the purpose of the classification and the research environment. For example, a fuzzy logic approach deals with discriminating single-layered clouds, multi-layered clouds and clear skies [8] while a K-nearest approach classifies cumulus, towering cumulus, cumulo-nimbus clouds, and other clouds and skies [9,13].
In this paper, we revisit the fuzzy logic approach for the traditional cloud-type classification problem. We have six cloudtype classes (cirrus, cirrustratus, cumulus, cumulonimbus, stratus, cumulus) that are frequently used in weather forecasting analysis. Our new approach differs from previous studies using fuzzy logic, because the noise removal process to extract the cloud area from the image was improved to avoid recognizing fog as a cloud. Fuzzy logic used in classification is designed to use different characteristics of three possible source images by using a two-layered fuzzy reasoning structure.
Because we primarily use color information from three different source images, the noise removal process is designed to exclude areas other than the cloud, and this preprocessing phase is further explained in the next section. The main classifier based on fuzzy logic is discussed in Section 3, followed by the experimental results and discussion.
From satellites, we can obtain the thickness of the cloud and other related information from visible-light images and the height information from the infrared images. Near-infrared images contain features of infrared images and visible-light images.
A previous study [7] used only information from infrared and visible-light images; therefore, it is unable to reliably distinguish clouds from fog. The fog is typically recognized as part of the cloud, because the brightness is not sufficiently different in the available data. The fog must be removed during the noise removal process to reduce this type of false positives.
In this study, we remove noises using additional color information from near-infrared images to determine the region of interest (ROI), which includes only land and the cloud area. We
use the threshold-cut method, as in the previous study, but the final color information of a pixel is determined as the average of the same pixel in different images. In the visible-light image, the color information from the near-infrared image is averaged. In the infrared image, the color information from the infrared images and the color information from the near-infrared images are averaged. In the near-infrared image, the color information from all three images is averaged.
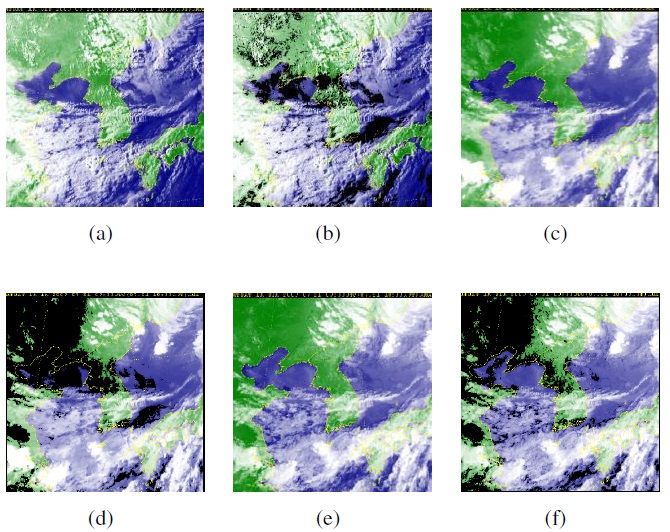
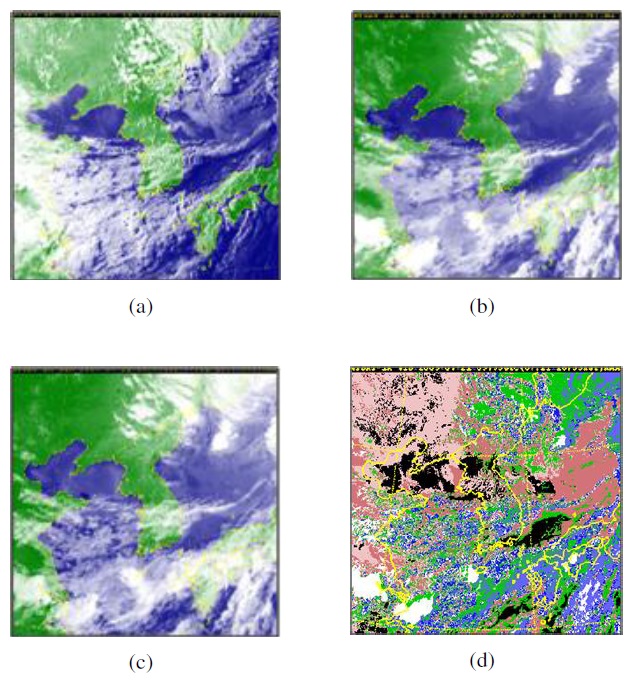
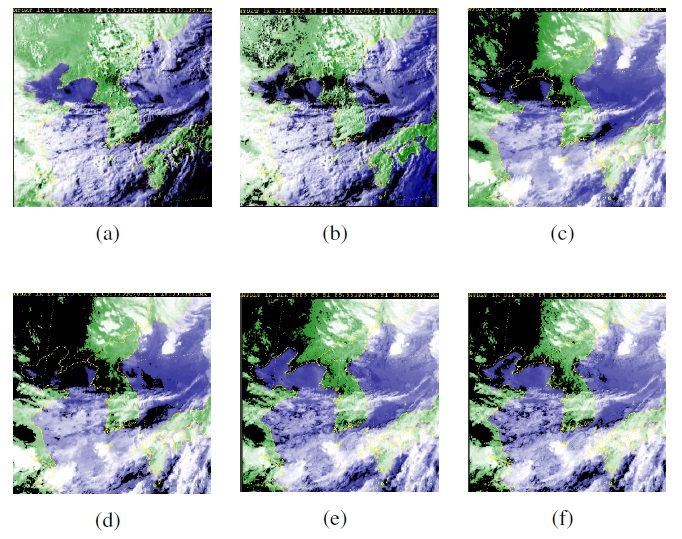
Figure 1 shows the original source images and the resultant ROIs after noise removal.
3. Cloud Type Classification by Fuzzy Logic
If the cloud exists in only one of the two main source images (visible-light or infrared), it is relatively easy to classify, because the height and thickness information is sufficient to classify the cloud type. Therefore, we need only one fuzzy membership function for classification.
If the cloud appears in both source images, we need the nearinfrared source image, which contains both the cloud thickness and height. In such a case, we need two different inference rule sets to characterize the target. However, the output of the inference is only qualitative.
Therefore, we need the second fuzzy membership function and another inference rule set with outputs from the first rule set as inputs. That makes our fuzzy inference logic two-layered.
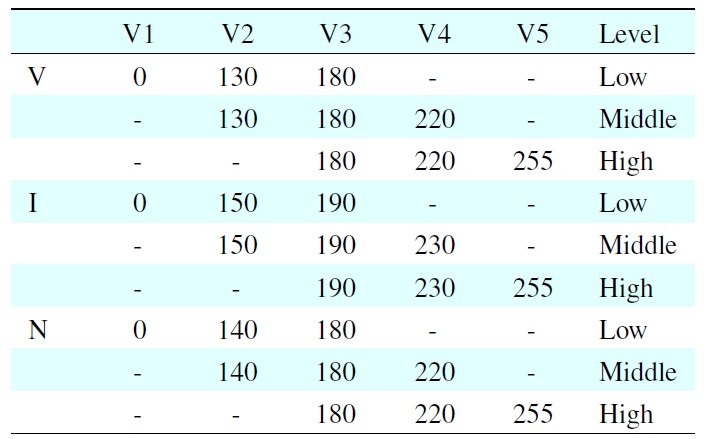
[Table 1.] Interval point of membership function for R channel

Interval point of membership function for R channel
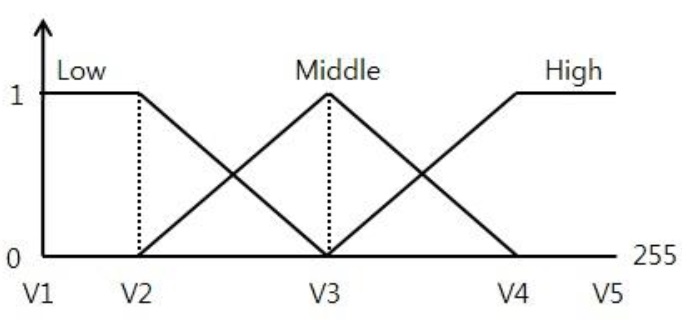
First, the R channel information from three source images (visible-light [V], near-infrared [N], and infrared [I]) are classified into three qualitative value levels (low, medium, and high) and used as inputs for our fuzzy membership function, which is designed as shown in Figure 2. With these three qualitative value levels, five interval points are assigned as specified in Table 1, with respect to the sources of the R channel. The threshold values of those intervals are determined empirically as shown in Table 1.
In order to classify cloud types in to our six classes, the membership degree is determined by two-layered qualitative fuzzy reasoning. Since we include the channel information from the near-infrared source image, the first membership degrees are represented as two numbers: 1) a membership degree that combines near-infrared and visible-light source images, and 2) a membership degree that combines infrared and near-infrared source images. These are the firsthand membership degrees as determined by fuzzy inference rules, as shown in Tables 2 and 3. These qualitative levels are later used in our secondhand inference rules.
The inference is performed by a well known max-min method [3].
[Table 2.] Firsthand inference rules 1 (near-infrared and visible-light)
Firsthand inference rules 1 (near-infrared and visible-light)
[Table 3.] Firsthand inference rules 2 (near-infrared and infrared)

Firsthand inference rules 2 (near-infrared and infrared)
If the cloud exists in only one of the two main source images (visible-light or infrared), the computed membership degree is defuzzified by the center of gravity rule and the classification is done by interval rules shown in Table 4 where W
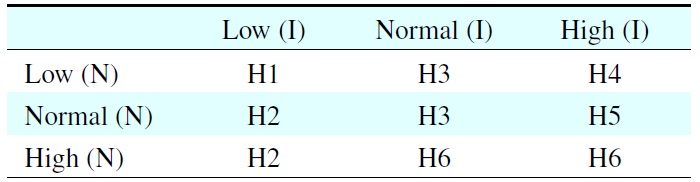
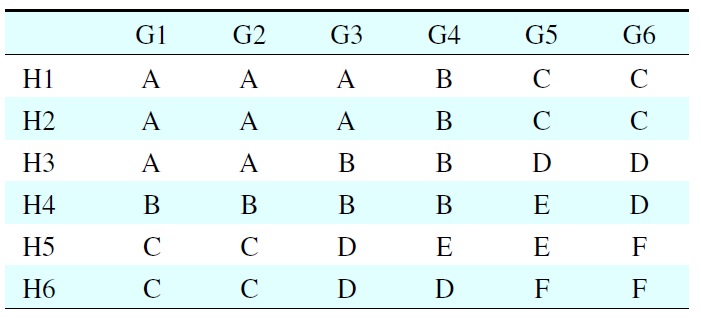
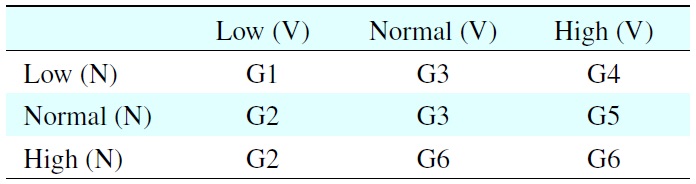
If the cloud exists in both infrared and visible-light images, we need a second fuzzy inference rule, as shown in Table 5, using firsthand membership degrees explained in Tables 2 and 3 as input. Again, the max-min method and the center of gravity defuzzication are used in the process.
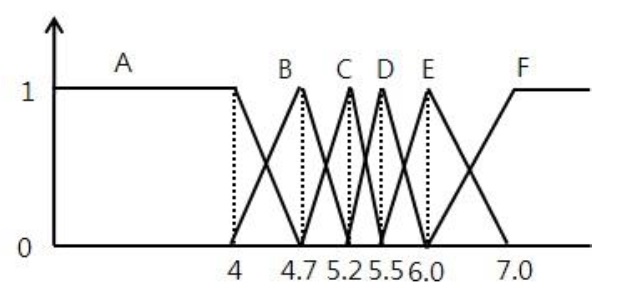
Therefore, the shape of the fuzzy membership function is different, as shown in Figure 3.
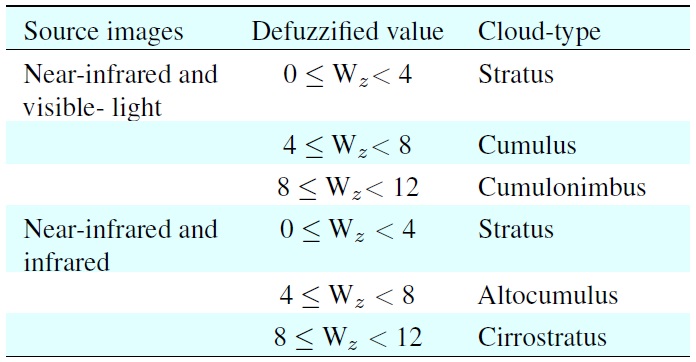
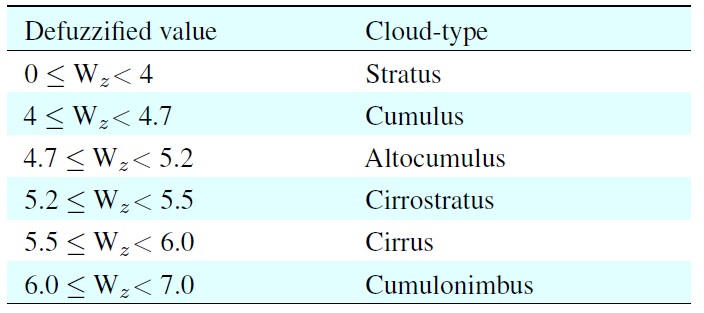
Then the cloud-type classification rules are determined as shown in Table 6, with the defuzzified value Wz.
With this two-layered fuzzy inference, we can produce the final cloud-classified source images as shown in Figure 4(d), from three input images.
We collected 50 532×512-pixel images of visible-light, infrared, and near-infrared images provided by the Korean National Weather Service [1]. The software was written in VC++ on IBM compatible PC with an Intel Core Duo CPU E7300 with 2.0 GB RAM.
The previous study [7], used reflection and release characteristics of the near-infrared image to classify salient cloud types first, and then it applied fuzzy logic for further classification. Therefore, during the noise removal process, the fog area tended to be wrongly classified as stratus. In this study, we used all
[Table 4.] Firsthand classification

Firsthand classification
[Table 5.] Secondhand inference rules

Secondhand inference rules
[Table 6.] Secondhand classification
Secondhand classification
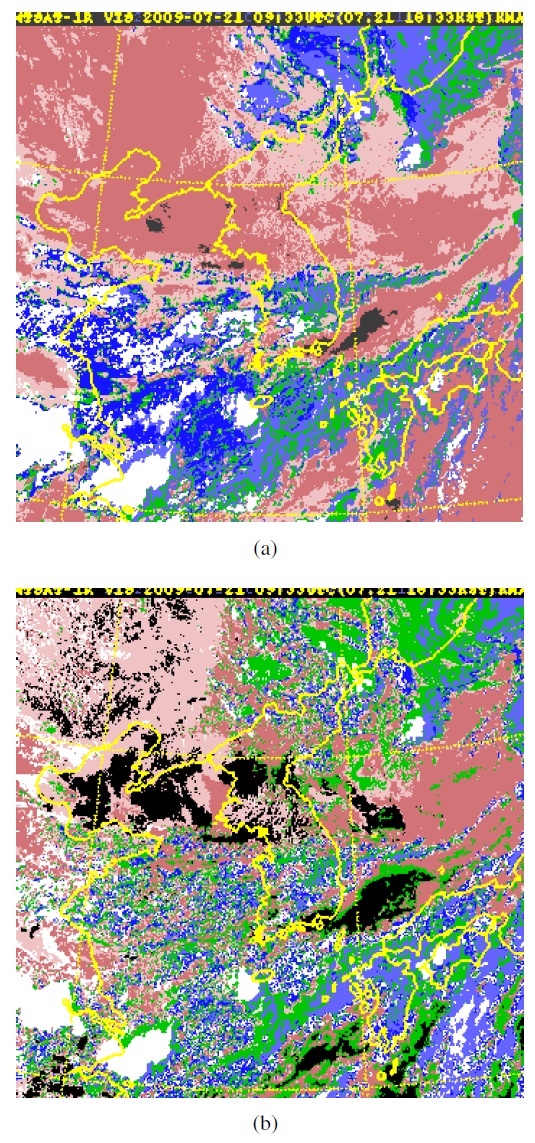
three source images with the brightness computed as the average of brightness from two to three source images. The change successfully avoids false positives and threshold value sensitivity. Figure 5 compares the difference of the two approaches in producing ROIs.
As expected, the new approach succeeded in removing the fog area from the cloud area.
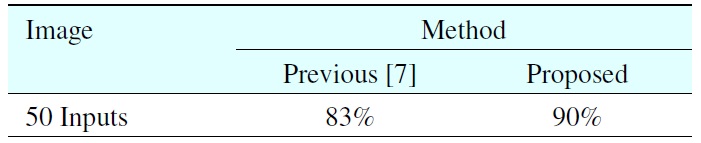
Table 7 summarizes the experimental result of the proposed method, as compared with the previous fuzzy-logic-based method [7].
In the proposed method, we do not use reflection/release characteristics as the classifying criteria. However, we observe if the cloud exists in both infrared and near-infrared images. If
[Table 7.] Cloud area extraction rate

Cloud area extraction rate
it appears only in one of them, we apply the first set of fuzzy inference rules, if it appears in both source images, the second set of membership functions and inference rules are also applied for further classification. The results show that the proposed method is more accurate and effective (Figure 6).
While many different methods are available to perform cloudtype classification from satellite images, no single algorithm outscored others on accuracy nor is any single algorithm widely used in practice. Fuzzy logic is one of several possible methodologies that could be used, because the nature of the problem contains a high level of dynamic uncertainty.
In this paper, we proposed a new method using a two-layered fuzzy inference system, using all possible source images to strengthen the classification accuracy. In addition, our new ROI-producing logic successfully avoids false positives caused by fog as in a previous study.
The primary goal of this study was to avoid false classification of fog as part of a cloud. While using all three possible source images in classification, our study further explored the characteristics of clouds depending on which source images the extracted cloud is found. We converted the traditional process to a two-layered fuzzy logic process. If the cloud exists in only one of the two main source images (visible-light or infrared), the classification follows only one fuzzy decision rule. On the other hand, if it exists in both source images, the data is processed first through our qualitative fuzzy inference rules and then through another fuzzy membership function and a new inference rule set; i.e., a two-layered fuzzy logic process.
Cloud-type classification has many practical applications and use different features of source images, depending on the target
applications and classification purposes. Our first concern in this paper was to contribute to weather forecasting, but the same paradigm may be extended to other applications, such as air traffic control, using different satellite image databases, which is our next goal.
While many different paradigms and algorithms were developed for different purposes in this research domain, the classification accuracy we gained (90%) is one of the better results reported, if not the best. Considering that we only used primitive attributes, such as color information, improvement is easily achievable if we employ more informative features as others have tried [11,12], and we could also compare our approach with others in the same environment [13].