With continuous control of exposure of toluene against workers, the criteria of hippuric acid as a biological markerof exposure to toluene lowered to 1.6 g/g creatinine in U.S.A. in 1998.1 However, the significance of hippuric acid as the biological maker of toluene at the level of environmental exposure below 50 ppm is under the question, as hippuric acid in normal person can go up to this level due to food additives.2 While there is difficulty finding alternative biological markers of toluene,3 organic solvent itself in blood or urine is drawing more attention as new biological markers.4 Organic solvent in urine is better marker as collection of sample is possible in non-invasive way.
There are about 100 laboratories in the field of occupational health, and most of them are small laboratories. They have gas chromatograph-flame ionization detector (GC-FID) according to the regulation, but most of them do not have gas chromatograph-mass selective detector (GC-MS) or headspace (HS) auto-sampler except for several large size laboratories. We have tested HS solid phase micro-extraction (SPME) auto-sampler to conventional GC-FID and analyzed organic solvent in urine samples. By comparing the results of HS-SPME-GC/FID with those of HS-GC/MS, feasibility of using HS-SPME-GC/FID for trace analysis of organic solvents in urine has been demonstrated.
Benzene, toluene, ethylbenzene, xylene, hippuric acid (Sigma, St.Louis, Missouri, U.S.A.) were used to prepare the standard solution. Spiked organic solvent standard material containing 200 mg/L of benzene, toluene, xylene, and ethylbenzene was purchased from AccuStandard (New Haven, Connecticut, U.S.A). Methanol and ethyl acetate (HPLC grade, J.T.Baker, PhiUipsburg, New Jersey, U.S.A) were used as solvent for dilution or extraction, and sodium chloride (Sigma-Aldrich, St.Louis, Missouri, U.S.A.) was added to raise extraction efficiency by salting-out effect. Water was purified using Simplicity system (Millipore, Bedford, Massachusetts, U.S.A).
HS-SPME-GC/FID was performed using CP-3800 (Varian, Walnut Creek, California, U.S.A.) model and PAL system (CTC Analytics AG, Zwingen, Switzerland) with SPME syringe conditioning station and SPME injection kit. Merlin Microseal (Varian, Walnut Creek, California, U.S.A.) was used for injection of SPME sample, with glass liner (Agilent, Palo Alto, California, U.S.A.) for SPME application. Hewlett Packard 6890 Series GC connected with HP-5973 MSD and 7694 headspace sampler was used for analysis of urinary organic acid and hippuric acid. DB-624 column (60 m × 0.25 mm, 140 μm film thickness, J&W Scientific, Folsom, California, U.S.A.), and SPME fiber of 100 μm PDMS (Polydimethylsiloxane, Supelco, Bellefonte, Pennsylvania, U.S.A.) were used for anaysis of organic acid in urine, and DB-5 column(25 m × 0.2 mm, 0.33 μm film thickness, J&W Scientific, Folsom, California, U.S.A.) was used for analysis of hippuric acid in urine.
The urine was collected from workers in KOSHA who were not exposed to organic solvents and kept at ?60℃. Once thawed and filtered through filtering paper, the urine was spiked with 200 mg/L of AccuStandard organic solvent mixture to prepare 10-400 μg/L of calibration standard solutions to check precision and accuracy. 2.5 mL of standard solution and urine sample was moved to 20 mL headspace vial for SPME containing 1 g of sodium chloride. After capping the vial, the content was mixed for 30 seconds. Derivatization of hippuric acid was performed after drying extracts of acidic component in urine for GC/MSD.5
Temperature of injector and detector was 250℃, and GC oven was set 40℃ for 2 min, raised at 10℃/min up to 180℃, 20℃/min up to 240℃, and kept at 240℃ for 11 min. Extraction for SPME was performed at 30℃ for 2 min after 30 min pre-incubation, and the fiber stayed in injector for 10 min for desorption of organic solvents and cleaning the fiber. Flow rate of GC was kept at 1.2 mL/min. Splitless injection followed with split ratio 20:1 after 30 s was applied to raise detection sensitivity. HS conditions as follows were used for HS GC/MSD: aux pressure 18 psi, oven 50℃, sample valve 60℃, transfer line 80℃, vial equilibration 10 min, vial pressurization 0.3 min, sample loop fill 0.15 min, loop equilibration 0.3 min, and sample injection 0.3 min. SIM condition was set for 5 compounds, as m/z 78 for benzene at 13 min, m/z 91 for toluene at 15 min, m/z 91 and 106 for ethylbenzene, m- and p-xylene at 16 min, and m/z 91, 104, 106 for styrene and o-xylene at 18 min.
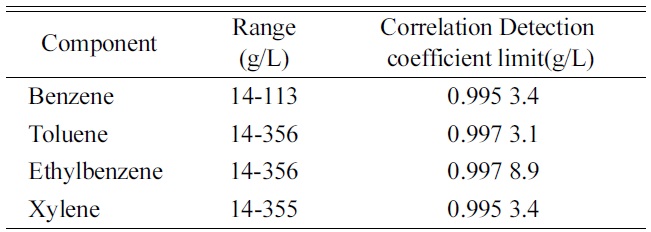
SPME HS condition was set for optimal detection of organic solvents. The condition suggested by Asakawa6 was tested, which showed the same tendency of better sensitivity at lower extraction temperature. The extraction temperature was set at 30℃, the lowest limit of present instrument, which showed up to 3 times better extraction than at 50℃. Considering sensitivity and lifetime of the fiber, extraction was performed for 2 min. Longer extraction time caused damage of the fiber by vigorous agitation of the needle part. 1 g of sodium chloride was added to 2.5 mL of sample for better extraction efficiency, which resulted 1.5 times better response. Toluene showed good linearity in the range of 14-356 μg/L. The detection limit was calculated from calibration data at S/N ratio 3, 3.4 μg/L for benzene,
[Table 1.] Linearity and detection limits of organic solvents by HS- SPME-GC/FID.

Linearity and detection limits of organic solvents by HS- SPME-GC/FID.
3.1 μg/L for toluene, 8.9 μg/L for ethyl benzene, and 3.4 μg/L for xylene. The result by HS GC/MSD in SIM mode showed comparable result, with detection limit of toluene as 8.8 μg/L, with sensitivity enough for practical application for biological monitoring of organic acid in urine. Precision and accuracy were tested for spiked urine sample containing 200 μg/L of solvents mixture. 5 times injection showed coefficient of variance in the range of 3.5-4.7%. Accuracy calculated from the data of standard solutions was 96-118%.
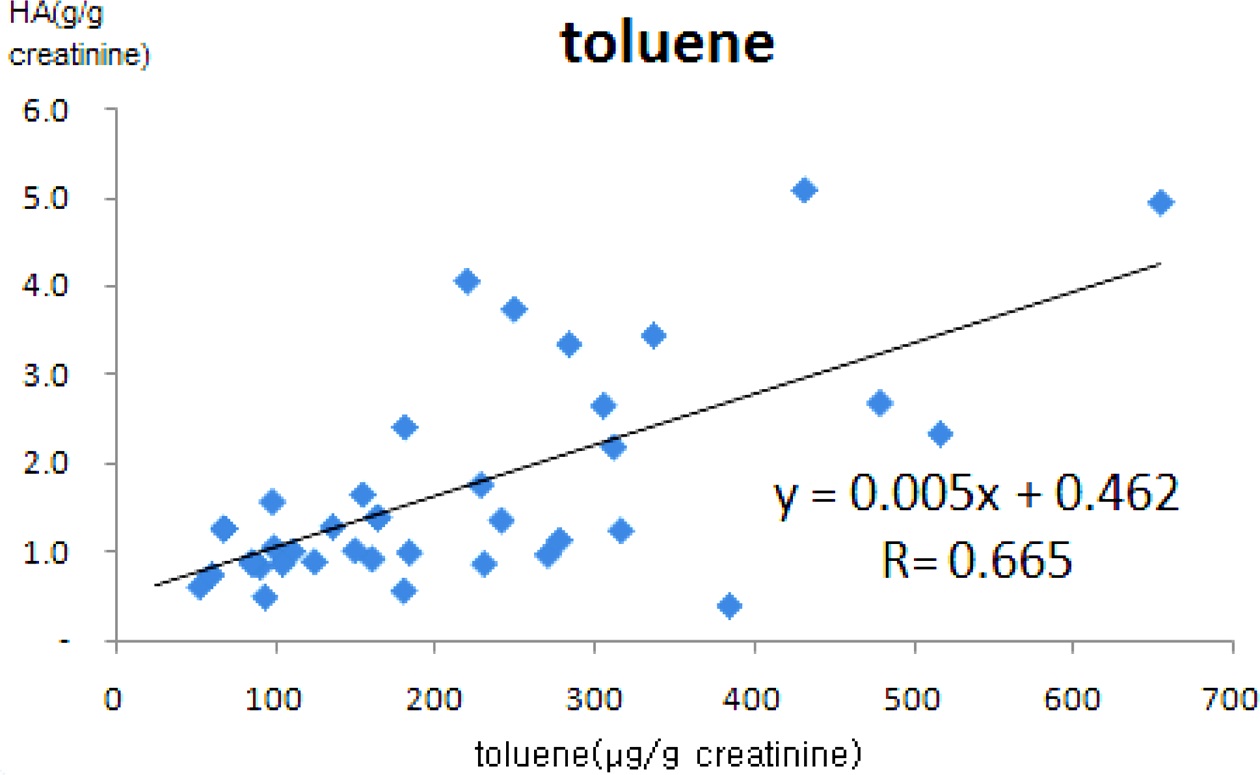
We could detect toluene from most of the urine samples, but not the other solvents. The availability of organic acid in urine for biological monitoring of organic solvent was already shown in the previous study, with correlation coefficient of 0.820 (n = 27)7 between toluene in urine and ambient air. The samples in this study showed good correlation with hippuric acid in urine, which was corrected by creatinine value, with correlation coefficient of 0.644 by simple linear regression. The data produced by HS-SPME-GC/FID method showed good relationship with hippuric acid in urine analyzed by GC/FID method.
Toluene in urine is better biological marker than hippuric acid or o-cresol in urine as environmental toluene is the only source of toluene, except the amount in urine is very small as the excretion ratio in urine is just 0.005% of absorbed amount. However, trace analysis of organic solvent was possible by GC/FID combining HS-SPME as pretreatment
and injection technique.
Ducos et al.8 reported that the toluene in urine exposed to 50 ppm of environmental toluene was 75.6 μg/L, which comes in the linear range of toluene in this study. We have demonstrated performance of the analytical technique to analyze organic solvents in urine for biological monitoring. Most of the laboratories in the field of occupational health in Korea are of small size and GC/FID is the only available instrument in many cases. Even though additional experiments or efforts are sometimes required for unambiguous identification of unknown component in GC/FID, the method described here is expected to be conveniently applied for biological monitoring of workers or normal population for organic solvent exposure in laboratories without GC/MS.
Analytical method for trace analysis of organic solvent in urine was investigated and showed good sensitivity and linearity for biological monitoring of organic solvent. Detection limit of toluene by HS-SPME-GC/FID was 3.1 μg/L, which was low enough for trace analysis of organic solvent in urine. Linear range of 4 organic solvents was 10-400 μg/L, with fair correlation coefficient between 0.992 and 0.999. The detection sensitivity could reach up to 4 times of HS-GC/MS. Accuracy was confirmed usingcommercial reference material containing 200 mg/L organic solvent, with about 90% accuracy. Toluene in urine was detected from 45 samples from workplace in the range of 21-324 μg/L. Organic solvent in urine over 20 μg/L could be analyzed by HS-SPME-GC/FID with high sensitivity. So, small laboratory without GC/MS can use this method for evaluation of exposure to organic solvent.