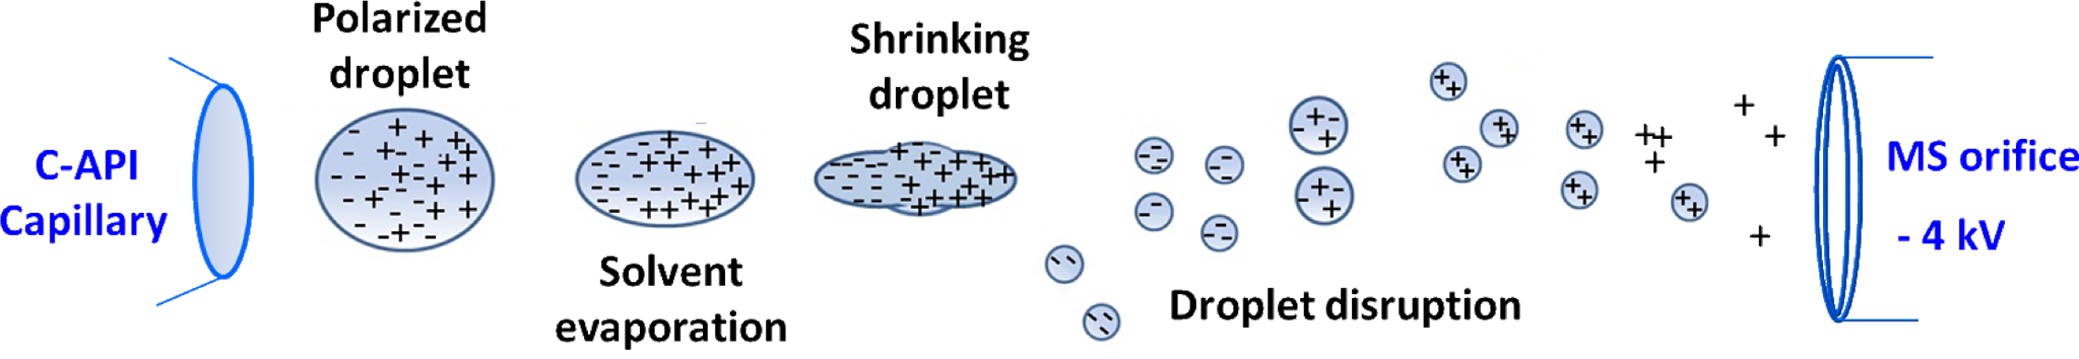
The rapid development of atmospheric pressure ionization (API) mass spectrometry has brought remarkable progress in the design of ion sources.1-29 The key features of recently developed API are speed and simplicity through the reduction of time-consuming sample preparation steps and minimization of the components required to fabricate ion sources.24-29 We recently explored contactless API (CAPI) 30 (or contactless electrospray ionization (C-ESI)),31 which uses a tapered capillary as the sampling tube and spray emitter without the application of any external electric voltage. Capillary action is the initial driving force that directs the sample from the inlet to the outlet. No external accessories, such as a high pressure gas supply or a high voltage power supply, are applied in the C-API process. Capillary action causes the sample solution to continuously flow to the capillary emitter. We believe that ionization results from the high electric field applied in the mass spectrometer because of the close proximity of the emitter (~1 mm) to the mass spectrometer. The sample eluent on the emitter is polarized, leading to the accumulation of charges on the droplet of the emitter. Droplet disruption is a consequence of columbic explosion in the droplet overcoming the surface tension. Gas phase ions are formed as the solvent is continually evaporated from resultant fine droplets on the way to the mass spectrometer. The ionization processes may be similar to those that occur during electrospray ionization (ESI). When detecting positive ions, the negative ions are separated from the positive ion in the droplet that hanged in the end of the capillary tip owing to polarization resulting from the high electric field applied in the mass spectrometer. As the charges of the droplet accumulate to a certain point, coulomb repulsion overcomes the surface tension of droplet. The droplet is detached from the capillary tip as shown in Scheme 1. The droplet is continually polarized on the way to the orifice of the mass spectrometer. After the droplet shrinks because of solvent evaporation, the droplet disruption occurs. The fine droplets with positive charges readily fly toward the orifice of the mass spectrometer, while the fine droplets with negative charges will be repulsed from the electric field of the mass spectrometer. Eventually, the negatively charged ions disappear in the air because of collision with the air molecules.
We previously demonstrated that application of a balloon filled with nitrogen gas in the sample inlet can accelerate the flow rate for introduction of the C-API sample.31 However, the balloon may gradually lose gas, leading to reductions in the flow rate. Thus, we herein alternatively use a syringe pump to provide a given flow rate to direct the sample solution from the capillary inlet to the proximity of the mass spectrometer for polarization and ionization to occur.
Angiotensin I human acetate hydrate, acetic acid (99.8%), aspartic acid, bradykinin acetate salt (98%),
insulin from human, cytochrome c from bovine heart (95%), and myoglobin from horse heart (90%) were obtained from Sigma (St. Louis, MO, USA). Methanol (HPLC grade), ethanol (HPLC grade), and acetonitrile (spectral grade) were purchased from Merck (Darmstadt, Germany). Hydrofluoric acid (48%) was obtained from Union Chemical Works (Taiwan). The fused-silica capillary (50 μm i.d.; 363 μm o.d.) was obtained from Polymicro Technologies (Phoenix, AZ, USA)
>
Fabrication of the tapered capillary
The C-API setup was assembled with three components: a syringe pump (KD Scientific, Holliston, MA, USA), a syringe, and a tapered capillary. Tapered capillaries were fabricated according to the method shown elsewhere.3031 Briefly, the lower end of a vertically positioned capillary was connected to a heavy object (50 g). A propane/butane flame was used to quickly heat the lower part of the capillary, leading to the formation of a narrow tip. After cooling to room temperature, the capillary tip was etched by immersing in 24% (v/v) HF solution for ~30 min followed by rinse with methanol and deionized water. Prior to C-API MS analysis, the tapered capillary (20 cm) was rinsed for 30 min with aqueous NaOH (1 M) and deionized water using a pump.
>
Syringe Infusion-based C-API setup
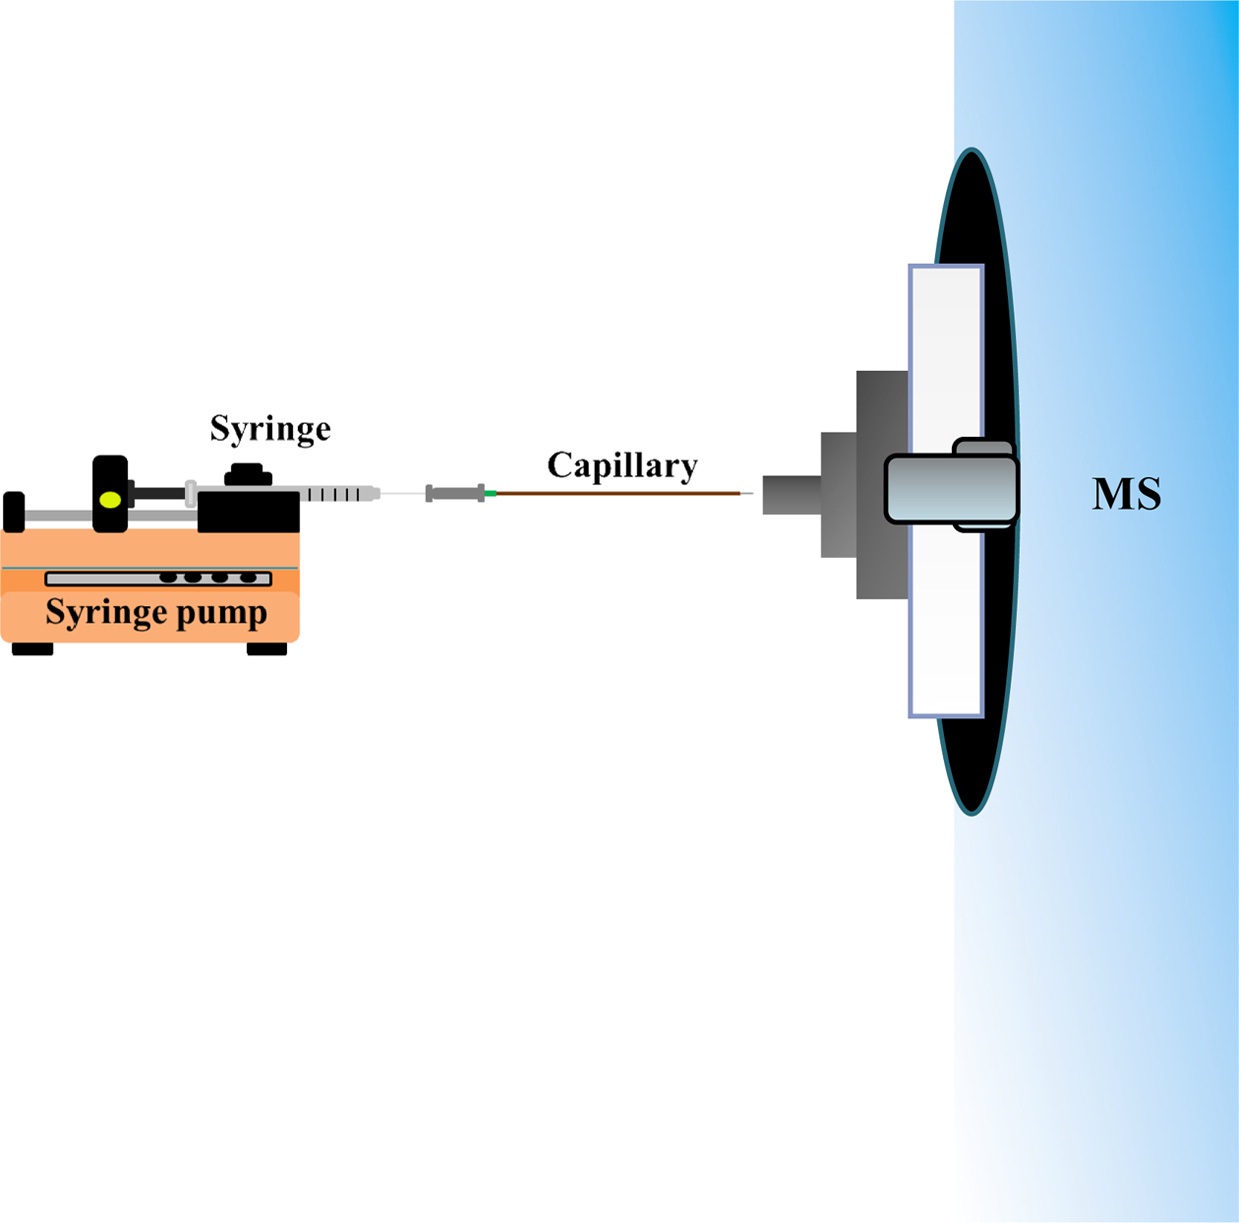
Scheme 2 shows a schematic diagram of the syringe infusion based C-API MS. A syringe connected to a capillary (~20 cm) was fixed to a syringe pump, and the tapered capillary outlet (~10 μm) was placed close to the stainless tube (1.1 mm o.d.; 0.8 mm i.d.) connected to the orifice of a Bruker Daltonics micrOTOF-Q II mass spectrometer (Bremen, Germany). A 2.5 cm long stainless tube was used unless otherwise indicated. Nano-ESI on-line mode was chosen when conducting MS analysis. The flow rate of the dry gas was 4 L/min. The voltage applied on the orifice of the MS inlet was ?4000 V unless otherwise indicated. Standard ESI emitter in the Bruker Daltonics micrOTOF-Q II mass spectrometer should be grounded when conducting ESI-MS analysis. However, neither electric contact nor external supply was made on the C-API capillary tip in our approach. Nevertheless, the sample solution can be continuously introduced into the capillary at a controlled flow rate. The tapered capillary caused polarization of the sample eluent in the capillary emitter and then the generated gas phase ions were readily detected by the mass spectrometer.
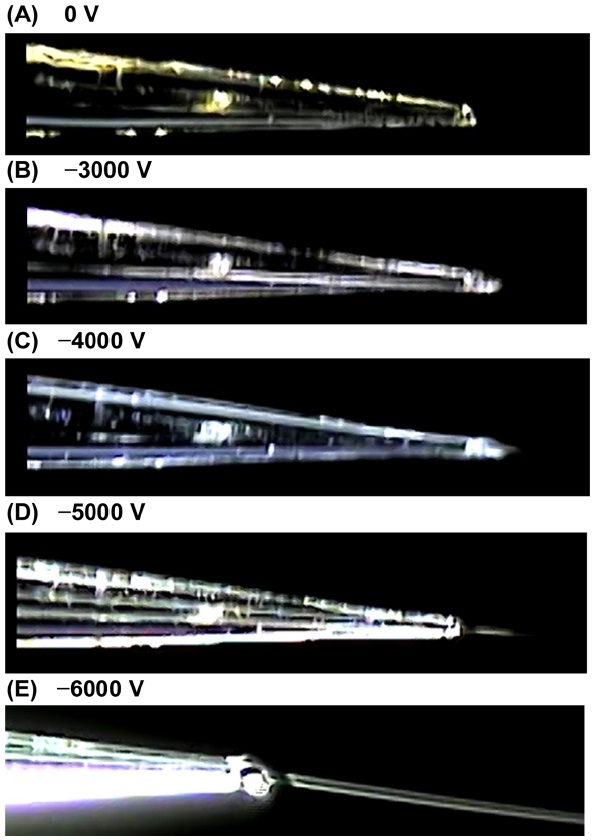
Initially, we examined the images of the syringe pumpbased C-API spray located in the C-API capillary emitter by operating different voltages on the orifice of the mass spectrometer. The solvent of acetonitrile/water (1:1, v/v) was continuously introduced through the capillary at a flow rate of 75 μLh?1. Figures 1(A) to 1E present photographs of the syringe infusion spray of the mass spectrometer operating at electric voltages of 0, ?3000, ?4000, ?5000, and ?6000 V. No external electric connection was applied on the capillary emitter. Nevertheless, a Taylor cone was observed in the capillary outlet when the voltage was set to ?3000 V. When the voltage was set to ?4000 V, the Taylor cone became apparent, and a thin stream toward the front to the mass spectrometer was observed. As the voltage was set to ?5000 V and ?6000 V, the stream became very apparent. The Taylor cone and fine droplets were formed in this syringe infusion approach although no electric connection was applied to the capillary emitter, similar to our previous
C-API approach.3031 We still consider the present approach as C-API because no external electric connection on the capillary emitter was applied.
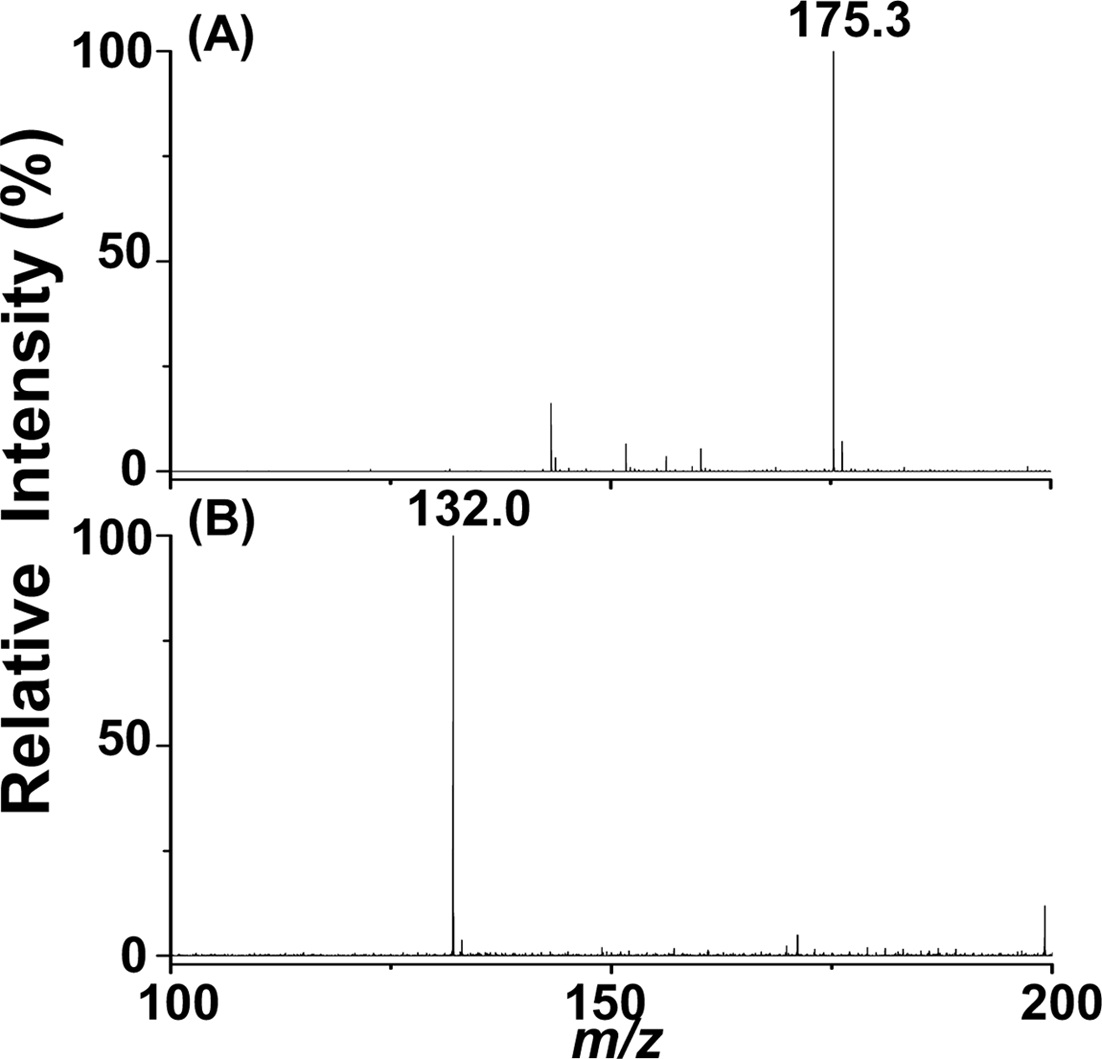
Figure 2(A) displays the positive ion C-API mass spectrum of arginine (10 μM, [M + H]+ = 175.3) infused by a syringe pump at a flow rate of 50 μLh?1. Figure 2(B) presents the C-API mass spectrum of aspartic acid (10 μM, [M ? H] = 175.3) obtained in negative ion mode. The analytes were prepared in acetonitrile/deionized water (1:1, v/v). This syringe infusion setup can readily be used to conduct C-API-MS analysis. Furthermore, positive ions and negative ions can be readily detected by a mass spectrometer using the current setup.
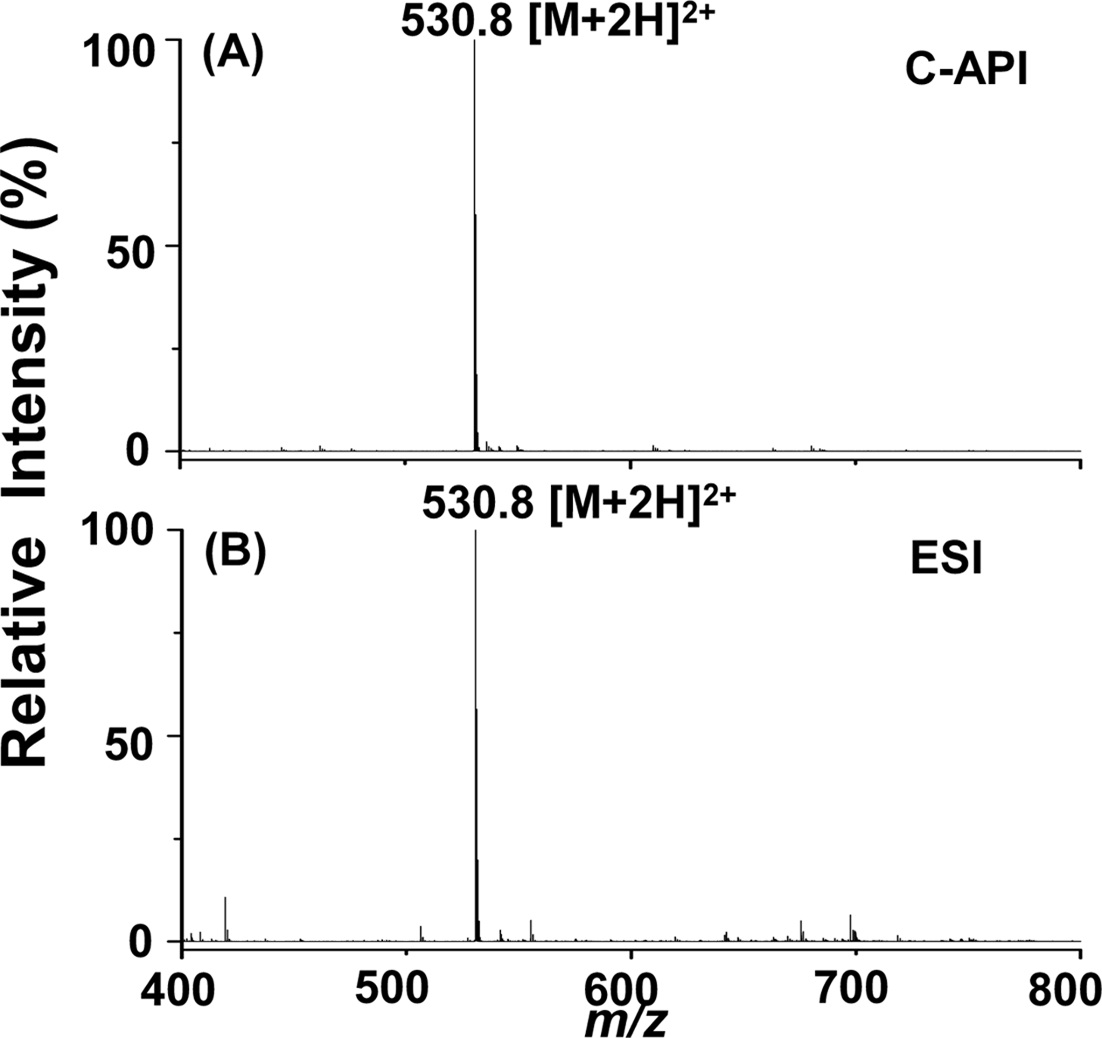
We further used bradykinin as a sample to examine the feasibility of this new C-API approach for larger molecules. Bradykinin was prepared in acetonitrile/deionized water (1:1, v/v). Figure 3(A) displays the mass spectrum of bradykinin (10 nM) as the sample, which was injected at an infusion flow rate of 50 μLh?1 controlled by a syringe pump. The doubly charged ion peak of bradykinin at m/z 530.8 dominated the mass spectrum. Although the concentration of bradykinin used for the experiment was quite low, background ions were barely seen in the mass spectrum.
Furthermore, the background ion peaks were fewer than those obtained from ESI using the same sample (Figure 3(B)). The flow rate was 240 μLh?1 when conducting the ESI MS analysis. The signal to noise ratio (S/N) at m/z 530.8 was ~3238 in Figure 3(A) and ~2425 in Figure 3(B). Thus, we estimated that the limit of detection of bradykinin is ~10 pM in C-API-MS, slightly lower than that estimated for ESI-MS (~12 pM) according to S/N 3. These results indicate that the proposed approach can be used to analyze analytes such as peptides. The background in the C-API
mass spectra was relatively low compared with that obtained in the conventional ESI approach. The low background may result from the absence of an external electric connection applied to the capillary emitter of the CAPI setup. Thus, solvent background generated from electrochemical oxidation/ reduction can be reduced.
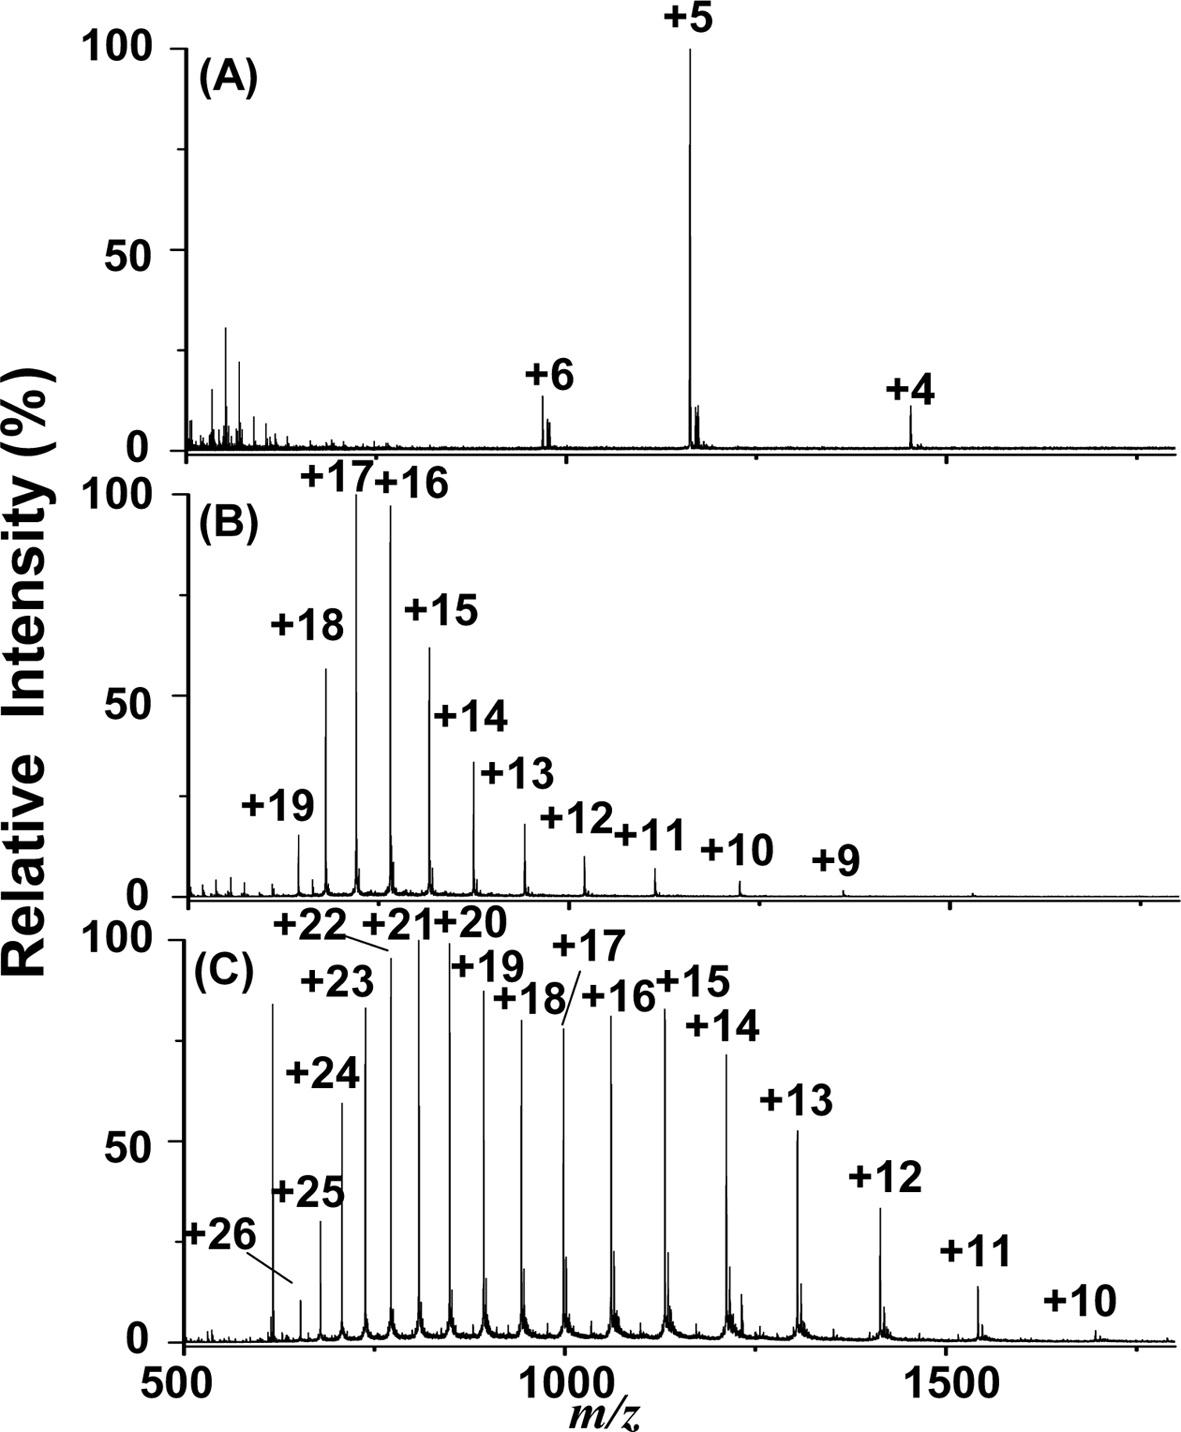
Additionally, we examined the feasibility of employing the current approach for the analysis of proteins. Figures 4(A) to 4(C) show the C-API mass spectra of insulin (1 μM), cytochrome c (1 μM), and myoglobin (1 μM) by directly infusing the sample from a tapered capillary controlled by a syringe pump (50 μLh?1). Proteins were dissolved in acetonitrile/0.5% acetic acid (1:1, v/v). Figure 4 shows that the multiply charged ions of proteins dominated all of the mass spectra. The mass spectral profiles resembled those obtained from the ESI-MS approach because the ionization process in C-API is similar to that of ESI. These results indicate that our current approach is also suitable for large molecules, such as proteins.
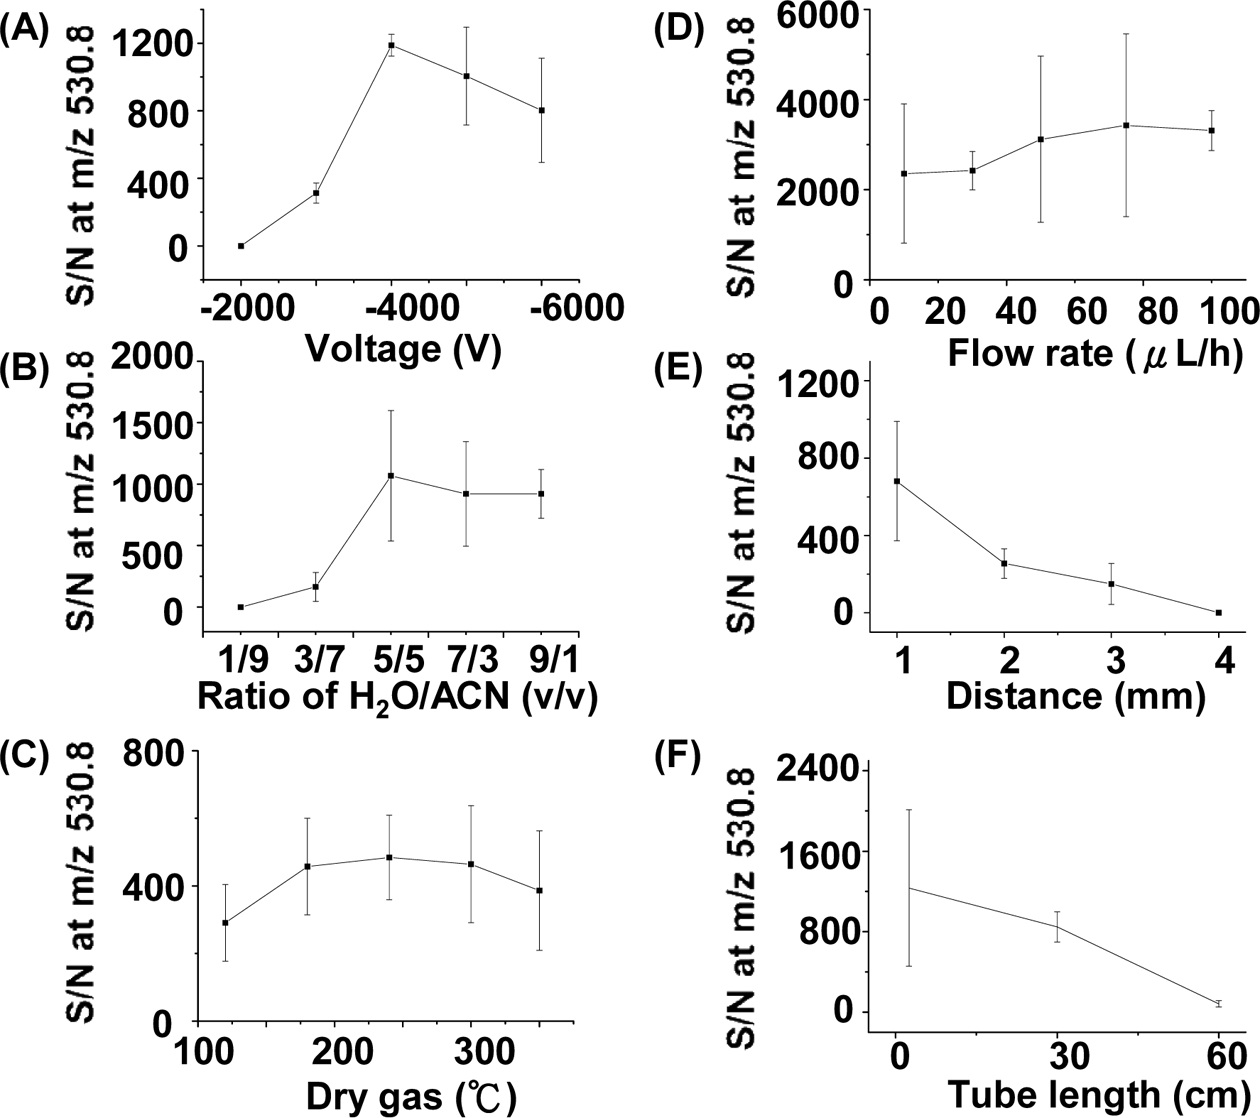
We also studied the optimized experimental parameters of the C-API approach using bradykinin as the sample. Figure 5(A) shows the S/N plot of the doubly charged ions of bradykinin at m/z 530.8 versus the voltage applied on the orifice of the mass spectrometer. The optimized result was obtained when the voltage was set to ?4000 V in positive ion mode. When the voltage was further increased, the S/N
of the peak at m/z 530.8 decreased, which could be a result of the higher background intensity. When the voltage was low, the polarization effect was not sufficient enough to cause effective ion formation. We examined the effects of solvent composition on the ion intensity of the analytes. Figure 5(B) presents a plot of S/N at m/z 530.8 versus the ratio of water to acetonitrile. The fraction of acetonitrile in the solvent composition is higher than that of water. It is understandable because more organic solvent present in the sample solution can lead to lower surface tension, which is helpful for the formation of fine droplets during C-API processes. When the percentage of acetonitrile in the solvent was higher than 50%, a better S/N was obtained. The temperature of dry gas around the glass capillary for ion transfer in the inlet of MS also slightly affected the MS results (Figure 5(C)). The temperature of the dry gas should be higher than 175 ℃ to obtain a better S/N. We further examined the effect of the flow rate controlled by the syringe pump on the C-API MS results. Figure 5(D) presents a plot of the S/N at m/z 530.8 versus the flow rate of sample infusion. While a low flow rate, such as 10 μLh?1, was sufficient to obtain the analyte ions, a higher flow rate (> 40 μL) can slightly improve the S/N at m/z 530.8. A higher flow rate for sample introduction could thus provide more analyte ions for MS detection. Furthermore, the distance between the capillary emitter and the orifice of the mass spectrometer could also affect the MS results. Figure 5(E) presents a plot of the S/N at m/z 530.8 versus the distance between the capillary emitter and the orifice of the mass spectrometer. Apparently, as the capillary emitter was placed closer to the orifice of MS, the S/N at m/z 530.8 became higher. The improvement in S/N is reasonable because the ionization process is mainly due to polarization induced by the high electric field of the mass spectrometer. As the distance between the capillary emitter and the mass spectrometer becomes shorter, polarization of the sample eluent becomes more apparent, leading to a higher S/N. At ~1 mm, optimized results could be obtained. We examined whether or not the length of a stainless steel tube extended from the orifice of the mass spectrometer could affect the ion intensity. The ion intensity obtained from the stainless steel tube with lengths between 2.5 cm and 30 cm did not change significantly. However, as the length of the tube was increased to ~60 cm, the signal declined dramatically (Figure 5(F)). It is probably because fewer gas phase ions survived during the longer distance of travel. However, when the length of the tube was shorter than 30 cm, the analyte ion intensity did not change significantly, which suggests the feasibility of adopting a metal tube in the setup as necessary.
We have demonstrated that a syringe pump connected to a tapered capillary as the C-API driving force can be readily used as a MS ion source for the ion formation of small to large molecules, including amino acids, peptides, and proteins. No external electric connection was applied to the capillary emitter, making this design very simple and straightforward. The C-API mass spectral profiles are similar to those obtained from ESI-MS. In the conventional ESI-MS setup, a syringe pump is one of the standard components. Since no external accessories were used to facilitate ion formation in this approach, the ion source can be greatly simplified by eliminating the voltage power supply and the conventional ESI emitter. In this way, the cost involved in fabricating the ion source can be greatly reduced. Furthermore, the ion signal obtained from the current C-API approach is quite stable since a given flow rate is applied during the analysis. The flow rate operated in this work can be lowered to nanoliter level per minute. Thus, the current approach should be potentially suitable to be combined with nanoflow liquid chromatography (nano-LC) simply using nano-LC pump as the driving force. When conducting peptide separation by nano-LC, the percentage of acetonitrile is generally lower than 40%. Our results showed that better ionization efficiency was achieved when the percentage of acetonitrile in the C-API solvent was higher than 50%. Thus, it seems that lower ionization efficiency may be obtained when using this current approach to combine with nanoLC. However, the flow rate used for examining the change of ion intensity when varying the C-API solvent composition was 50 μL/h, which was higher than the flow rate commonly used in nano-LC. Thus, it is possible that the ionization efficiency is still satisfactory when combining the current approach with nano-LC operated in a lower flow rate. However, further investigation should be conducted to validate the possibility. The main advantages of the proposed approach include ease of operation, simple design, low cost, low background, and low limit of detection. Potentially, this ionization method can be used as suitable interface for coupling separation techniques.

![C-API mass spectra of arginine ([M + H]+ = 175.3, 10 μM) obtained in positive ion mode and aspartic acid ([M-H]? = 132.0, 10 μM) obtained in negative ion mode. The analytes were prepared in acetonitrile/deionized water (1:1, v/v). The flow rate was set to 50 μLh?1.](http://oak.go.kr/repository/journal/12233/E1MPSV_2012_v3n4_87_f002.jpg)