Two well-known photochromic compounds, naphthoxazines and naphthopyrans, exhibit a thermally reversible color change, both in solution and when sequestered in a polymer matrix, when exposed to ultraviolet (UV) radiation.1 Upon exposure to UV radiation, these compounds are converted from colorless, close-ring states to colored, openring states.2-7
Prolonged exposure to UV radiation and oxygen tends to degrade photochromic dyes, leading to losses in photochromism.89 This lack of durability has limited the commercial applicability of most photochromic dyes. Typical photooxidation products result from ring-opening reactions. Some hypotheses involve the reaction of molecular oxygen with diradical species created during the opening of a C-O bond. This reaction mechanism has been suggested by Malatesta
All solvents were HPLC-grade and purchased from J.T. Baker (Phillipsburg, NJ, USA). Water was deionized with a Milli-Q water purification system (Millipore, Billerica, MA, USA). 6'-(2,3-Dihydro-1H-indol-1-yl)-1,3-dihydro-3,3- dimethyl-1-(2-methylpropyl)-
spiro[2H-indole-2,3'-[3H]naphth[2,1-b][1,4]oxazine] and 4-[4-[6-(4-morpholinyl)-3-phenyl-3H-naphtho[2,1-b]pyran-3 -yl]phenyl]-morpholine were obtained from LG Chem’s Research Park facility.
Chromatographic separation was performed using a Hewlett-Packard HPLC system (HP1100; Palo Alto, CA, USA). The HPLC column was a Capcellpak (4.6 mm ID × 50 mm L, 5 μm, hexadecyl-bonded silica; Shiseido, Tokyo, Japan). Components I and II of the mobile phase were deionized water and acetonitrile, respectively. Mobile phase solvents were filtered and degassed through a 0.45 μm membrane filter. A gradient elution was used, starting with a linear increase from 20% to 100% component II over 10 min. The mobile phase composition was then maintained at 100% component II for 15 min. The flow rate was 1.0 mL/min and a UV detector monitored the eluate absorbance at 254 nm.
Mass spectrometric analyses were performed on a LCQ (Finnigan, MAT, USA) and LTQ Orbitrap Elite (Thermo, Bremen, Germany) equipped with an atmospheric pressure chemical ionization (APCI) interface. Mass spectrometric parameters for the LCQ for APCI were as follows: vaporizer temperature 350℃, sheath gas flow rate 80 L/h, auxiliary gas flow 10 L/h, capillary temperature 150℃, tube lens offset 46 V, scan range
Photochromic solutions were prepared by dissolving compounds (I) or (II) in acetonitrile to approximately 10 mM. Photodegradation was performed with a UV condensation weathering device (ATLAS UV2000, 0.77W/m2 at 340 nm). Eight solutions were prepared with various UV exposure times (0 hr, 4 hr, 27 hr, 40 hr, 59 hr, 86 hr, 117 hr, and 241 hr).
Both of the photochromic compounds studied herein underwent significant UV-induced photodegradation in acetonitrile. The peak corresponding to compound (I) completely disappeared after 86 hr of UV exposure. The primary degradation product, evident in all of the compound (I) solutions, was eluted at 6.2 min. Table 1 gives mass data for the various degradation products, including proposed elemental compositions and mass deviations (difference between theoretical and measured mass). High-accuracy masses were obtained with the Orbitrap mass spectrometer. Based on these data, the photodegradation product responsible for the LC peak at 6.2 min was likely 3,3-dimethyl-1-(2-methylpropyl) oxindole. The photoproducts eluted at 10.1 and 10.3 min
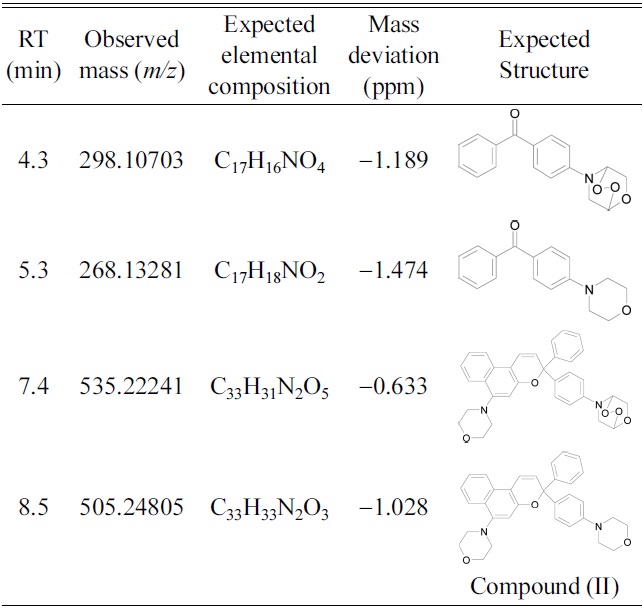
Retention times (RT), observed masses, elemental compositions, mass deviations and expected structure of degradation products of compound (I).
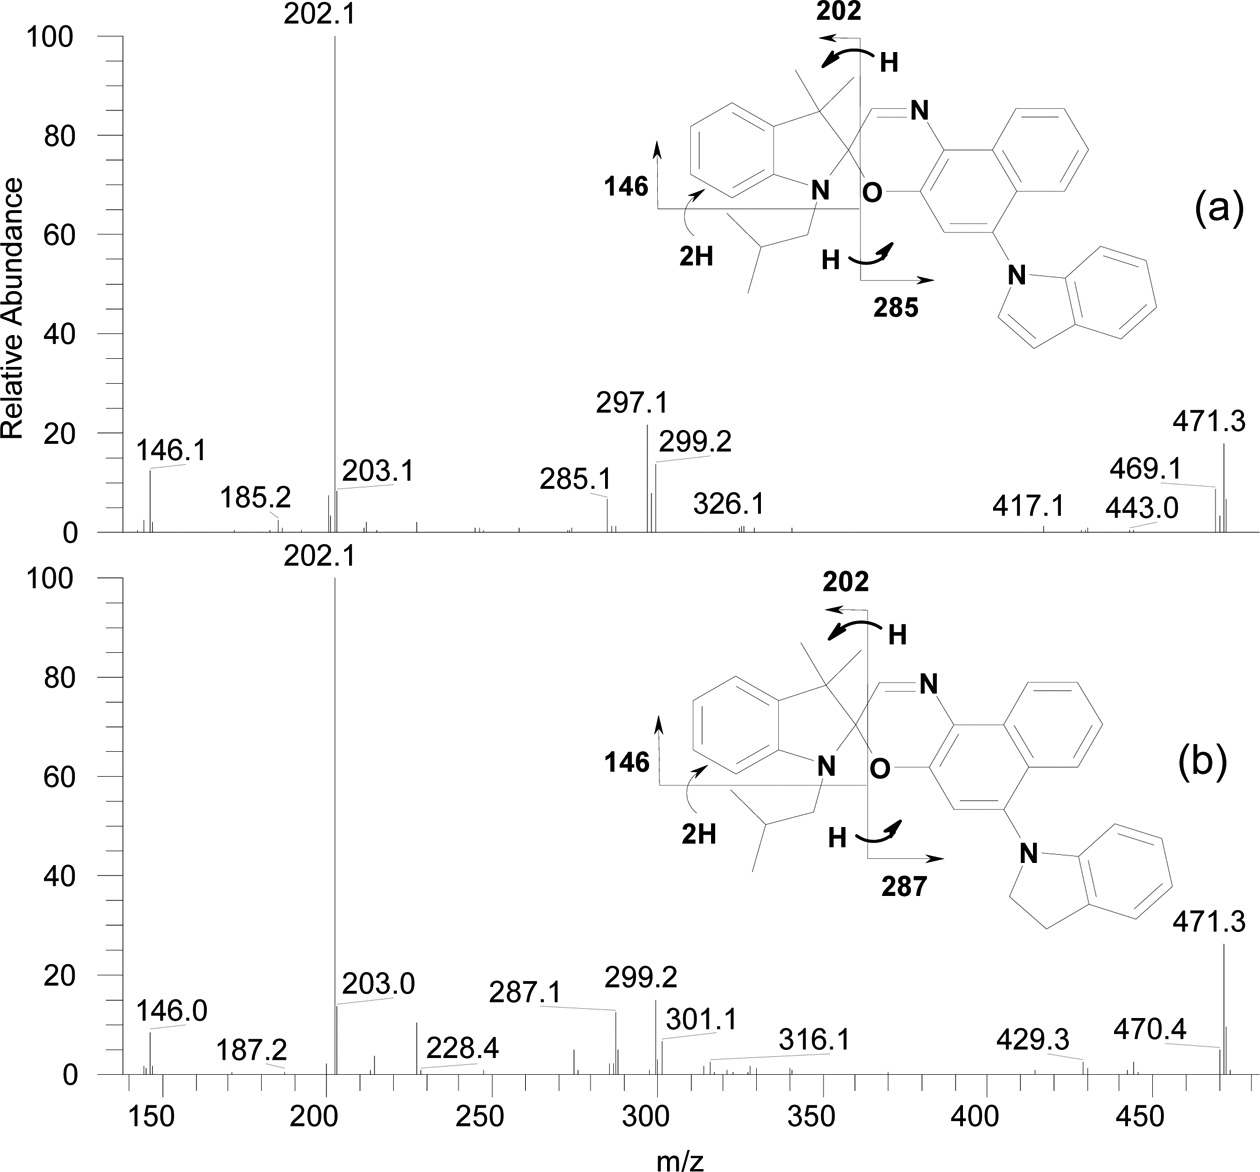
were likely naphthoxazole compounds that had reacted with cyanide ions donated by acetonitrile. Table 1 also shows proposed structures of the degradation products eluted at 4.7, 6.2, 10.1, 10.3, and 10.5 min. The structures are based on accurate masses and the fragment ions generated in MS/MS mode. Figure 1 shows the fragmentation pattern obtained from the compound eluted at 10.5 min. Almost all of the proposed degradation products are analogs of the photoproducts of the

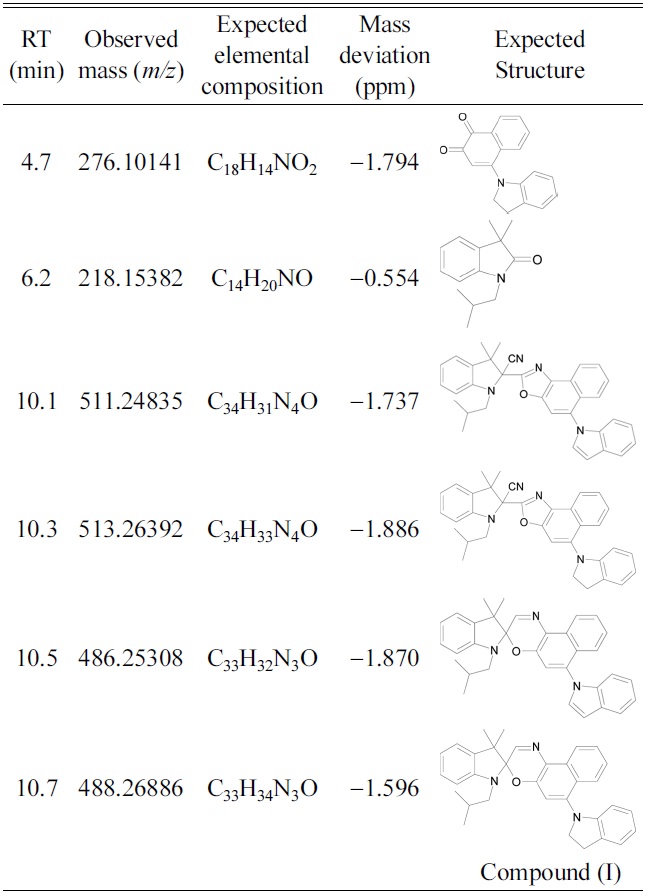
Retention times (RT), observed masses, elementalcompositions, mass deviations and expected structure ofdegradation products of compound (II).
unsubstituted compound (I). This confirms that degradation occurred by the reaction of oxygen with the open-ring form of compound (I).
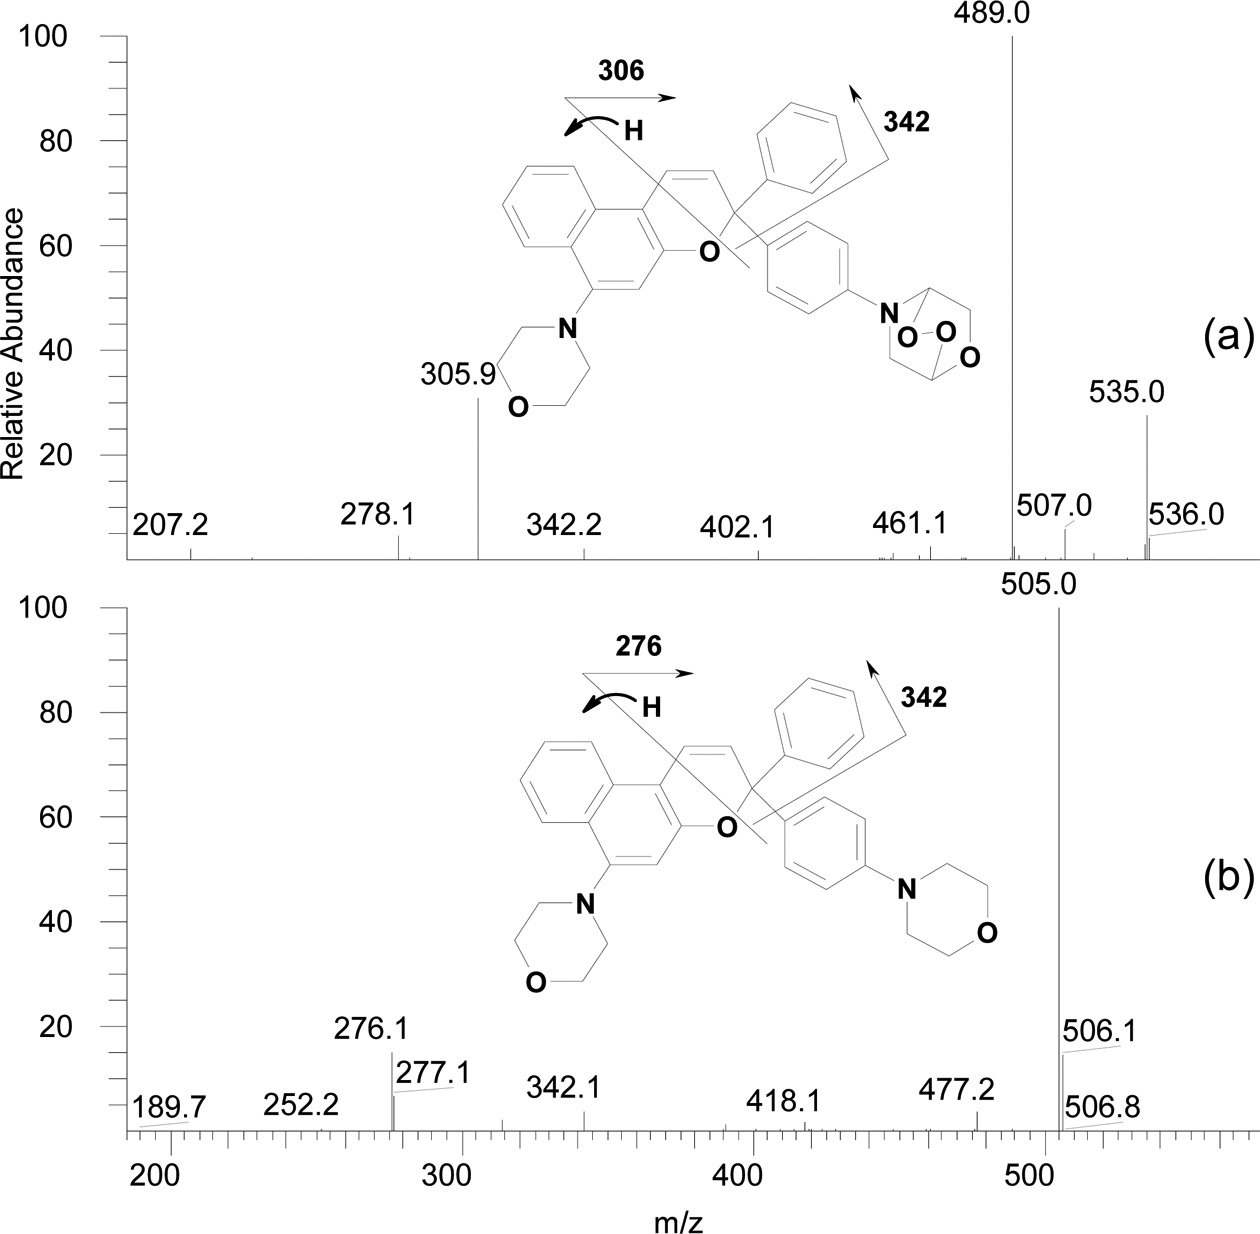
Compound (II) showed no significant signs of degradation until after 59 hr of exposure. Non-degraded compound (II) was evident even after 241 hr of exposure. Table 2 shows accurate masses and proposed structures of the degradation products of compound (II). Based on fragment ions generated in MS/MS mode, the degradation products were likely morpholinyl benzophenone, formed from the open-ring form of the initial naphthopyran, and morpholine endoperoxide compounds. Figure 2 shows the fragmentation pattern of the compound eluted at 7.4 min.
UV degradation of naphthopyran and naphthoxazine compounds yields oxidized products in acetonitrile. The main products of photodegradation of the naphthoxazine compound were analogues of the same unsubstituted compound. Photodegradation of the naphthopyran compound yielded benzophonone derivatives. Thus, the photooxidation mechanism of these photochromic dyes involves the reaction of oxygen with their open-ring forms. The naphthopyran compound was more resistant to photodegradation than the naphthoxazine compound.