Since optical coherence tomography (OCT) had been reported by the group of J. G. Fujimoto in 1991, many researchers have kept an eye on optical tomographic imaging by OCT due to its radiation-free high resolution imaging capability for tissues [1,2]. Radiation from medical imaging techniques such as X-ray computed tomography (CT) may induce cellular damage and increase the risk of cancer, although it is carefully controlled so as to keep annual radiation exposure low [3,4]. Moreover, radiation-free tomographic imaging has importance in order to study radiation effectiveness on normal and tumor tissues. Although OCT is one of the radiation free and optical tomographic imaging techniques, it has very shallow imaging depth of a few millimeters and its usefulness is restricted. Therefore, OCT has been most useful in imaging in ophthalmology because of the transparency of ocular tissues [2,5-9]. Recently, Ruggeri, et al. reported retinal tumor images of rodent
In this paper, we report an optical monitoring method for tumor growth in auricle tissue of an animal model using optical coherence tomography
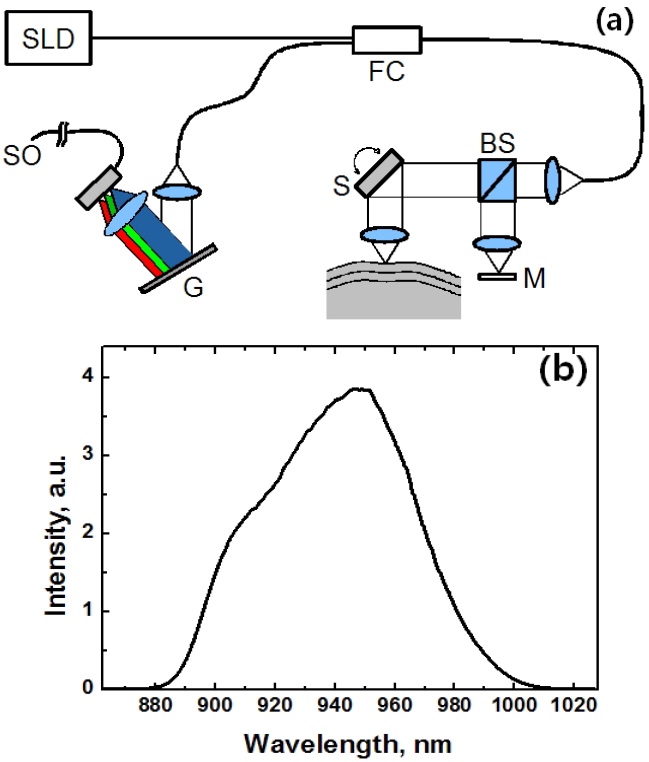
We took tomographic images of tumors in an animal model using a commercial spectral domain OCT (SD-OCT) system (OCP930SR, Thorlabs Inc. US). We used a superluminescent diode (SLD) as a light source at 950 nm wavelength to take high resolution tomographic images. Fig. 1 shows the schematic of the SD-OCT and the spectra of the SLD with the 3-dB bandwidth of 66 nm. The SD-OCT
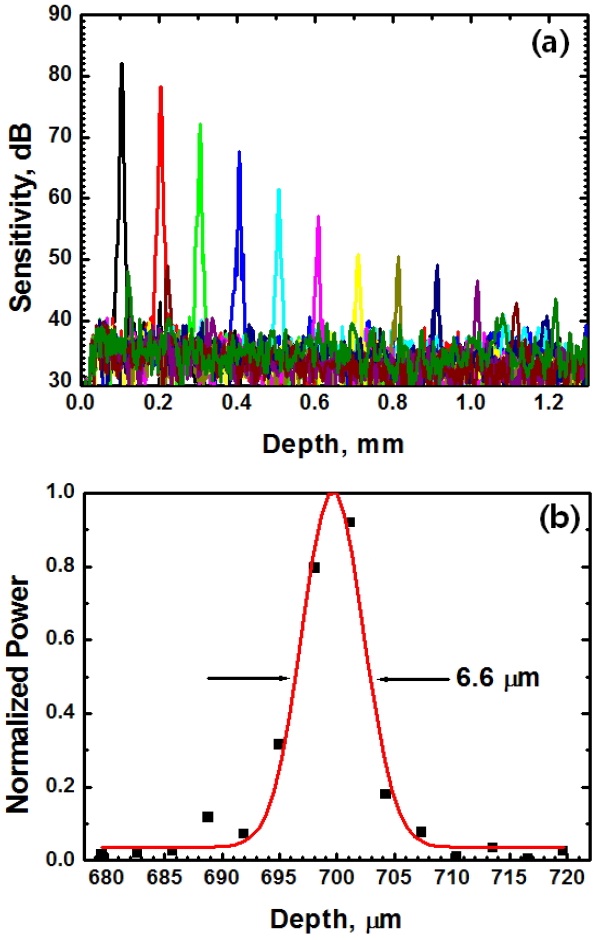
system consists of a beam splitter, a galvanometer scanner, a reference mirror, a fiber coupler, and a spectrometer. A-scan rate is approximately 5 kHz with lateral scanning range up to 8 mm with image size of 512 rows so as to have B-scan rate of 8 fps. Axial resolution of 6.6
We prepared the BALB/c nude mouse as an animal model for imaging a solid tumor. Three or more mice were prepared as the age of around 4 weeks and anesthetized with conventional avertin (Sigma) intraperitoneal injection of approximately 0.4 mL for
Committee.
The cancer cells of A-549 and PC-3 were cultured and subcutaneously injected into auricle tissues in BALB/c nude mice to generate the tumor. A-549 cells, adenocarcinomic human alveolar basal epithelial cells, are widely used as an
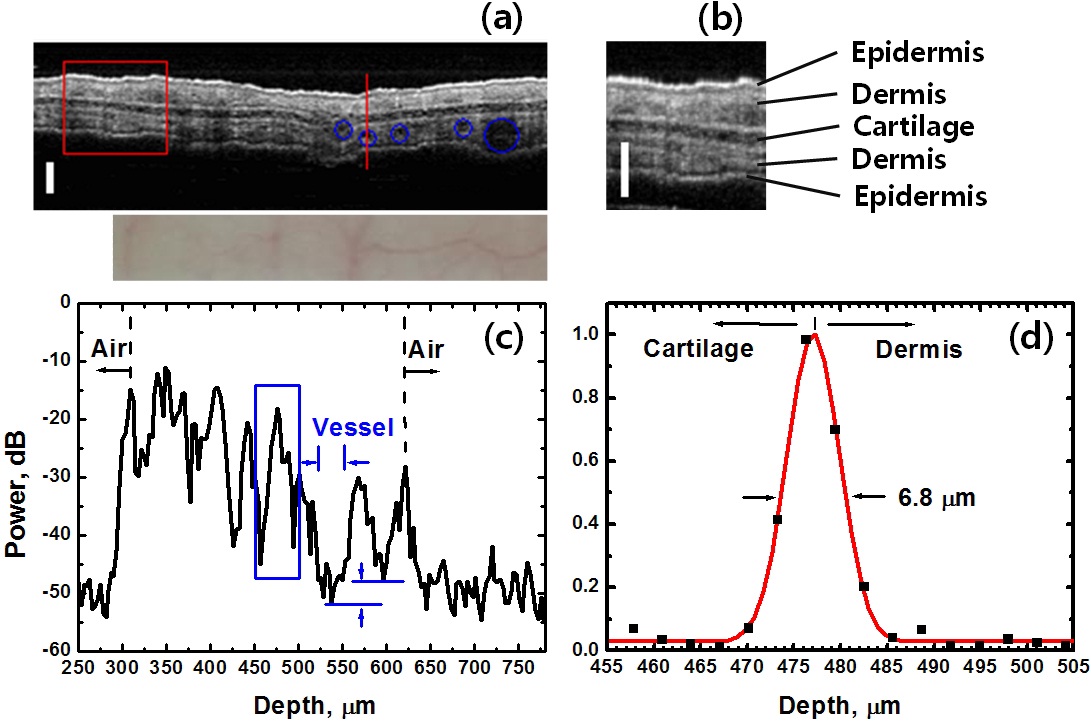
Due to thinness and transparency of an ear of a BALB/c nude mouse, an
dermis, and cartilage are clearly shown in an image obtained (Fig. 3(a)) and a magnified image (Fig. 3(b)). Embedded blood vessels that have been seen in the CCD images (lower Fig. 3(a)) are also shown as indicated with blue circles. A-scan data recorded across a blood vessel (along the red line) show local maxima of the power signals at the interfaces between tissue layers and air as shown in Fig. 3(c). The signal level in blood vessel was found out to be 3.9 dB lower than the minimum signal level in the other tissue regions. The area within blood vessel appears dark, while blood is flowing through the vessel
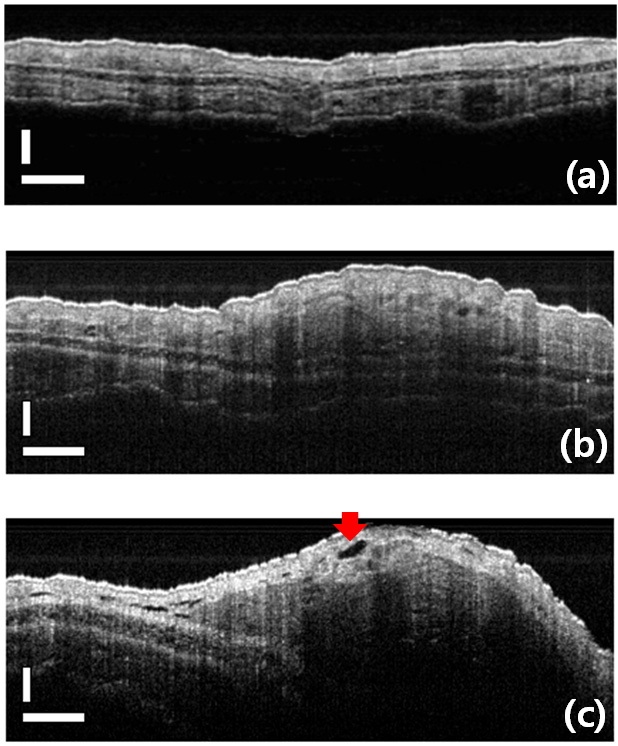
We observed tumor formation and growth around an injection region of PC-3 cells and obtained the images of tumor mass center and sparse circumferences. Similar results were obtained in the experiments with the cancer cells of A-549 as well. The tomographic images of cancerous regions were compared with the images of normal tissues as in Fig. 4. OCT images of an auricle region in BALB/c nude mice were taken
auricles are shown in the images on 3rd and 5th day from an injection, respectively (Figs. 4(b) and (c)). Tumor mass center and sparse circumferences around an injection region are shown as well. The tumor associated endothelial cells overlap one another and, as pointed by the red arrow, show a gap of significant size between them. Such a gap permits the seepage of plasma fluids into the interstitial spaces between the cancer cells, contributing to high hydrostatic pressure in these spaces [19].
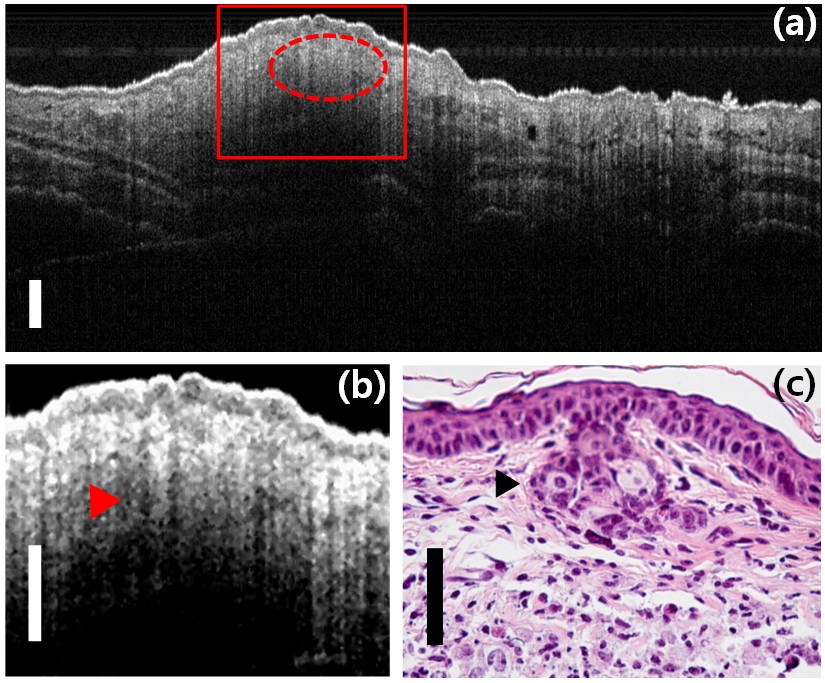
Fig. 5(a) shows an OCT image of the cancerous region on the 5th day from an inoculation of PC-3 cells. The magnified image of the red rectangle and the histological image are arranged side by side for comparison with each other. Tumor mass region is indicated with a dashed red line and pointed out by red and black arrows in Figs. 5(b) and (c), respectively. On the 5th day from an inoculation, histological images of tumor regions using cross-sectional slicing and hematoxylin & eosin (H&E) staining of specimens were taken in order to confirm the correlation with the high resolution OCT images taken previously.
The leakiness of tumor-associated microvasculature results in the continuous leaking of thrombin and fibrinogen molecules from the plasma into the parenchyma surrounding blood vessels. Tissue factor is a protein displayed on the surface of cancer cells and many other cell types. Thrombin from the plasma is activated upon contact with tissue factor and converts fibrinogen into fibrin. This may result in the extensive network of fibrin bundles seen as an oval interface (indicated by red and black arrows) at the border between actively growing cancer cells and the tumor stroma (shown in Figs. 5(b) and (c)). A typical behavior of invasive carcinoma cells is shown as a clear interface, in which a well organized cohort (i.e. an invasive front) of these cells invades near to the stroma [19].
In general, the proliferation of the endothelial cells is encouraged by other cells in both the epithelium and stroma in order to guarantee access by all of these cells to an adequate blood supply. Especially in cancer formation, many cells lack adequate access to oxygen and release angiogenic factors actively that stimulate the ingrowth of capillaries [20]. Fig. 5(b) has many dark spots and considerable difference in comparison with the image of normal tissues in Fig. 3(b). It shows the generation of many blood capillaries around the tumor mass as dark spots on the image that have the lowest signal level in A-scan data of tissue images as mentioned previously (Fig. 3(c)). Blood capillaries appearing as dark spots in OCT images could be much larger than the imaging resolution of 6.8
In order to quantify the overall amount of blood capillaries
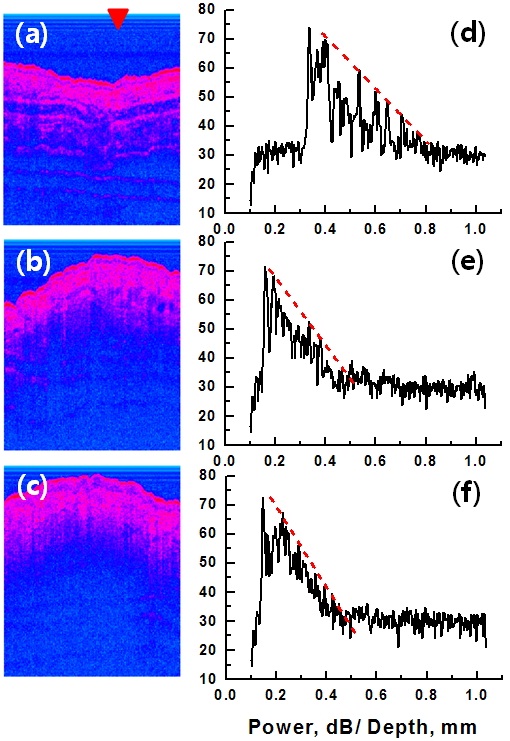
around the tumor mass, OCT images were analyzed in the aspect of light attenuation. OCT images and their A-scan data on the 1st (before inoculation), 3rd and 5th days are shown in Figs. 6(a)-(d), (b)-(e) and (c)-(f), respectively. The A-scan data were brought from the recorded OCT images of Figs. 6(a), (b) and (c) at the position pointed to by the red triangle. The light attenuation constant is proportional to a slope of the dashed red line that was linearly fitted to local maxima of signal appearing from tissue interfaces. The steeper the slope of the A-scan signal, the larger the optical attenuation constant in the measured tissues. The tumor region had a strong rate of light attenuation compared with the normal tissues as in Figs. 6(d), (e) and (f).
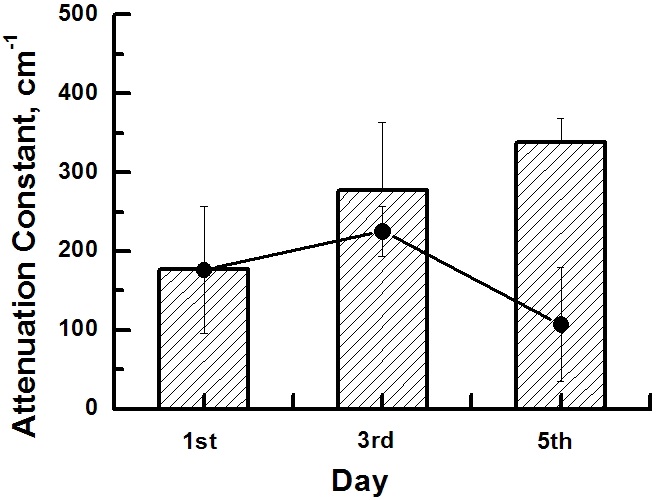
We estimated attenuation constants of the tissues by subtracting the sensitivity roll-off (i.e. instrumental roll-off) from the slopes of A-scan data and considering light path length as double that of the tissue thickness. Averaged attenuation constants of the normal tissue region are compared with those of the tumor tissue region in the histogram of Fig. 7. Filled circles represent averaged attenuation constants of the normal tissue region in the same OCT image on each day. On the 3rd day, the attenuation constant of the tumor tissues was 101 cm-1 larger than that of the same region before inoculation and 52 cm-1 larger than that of the surrounding normal tissues on the same day. The attenuation constant on the 5th day was 162 cm-1 and 231 cm-1 larger than those of the normal tissues in the same and surrounding regions, respectively. Optical attenuation in skin is mainly attributed to melanin absorption in the epidermis and blood scattering in the dermis. The epidermal attenuation constant, which is considerably variable according to melanin content, is about 80 cm-1 at 950 nm where the melanin content is a 10% volume fraction of melanosomes [21]. The effect of the epidermal layer on tissue attenuation is relatively restricted because of its thinness. The attenuation constant in whole blood, mainly due to light scattering by red blood cells, is known to be as large as about 670 cm-1 at 960 nm [22,23]. Therefore, due to dense vasculature, tumor tissues had more optical attenuation by a few hundred cm-1 than the normal tissues. Moreover, optical attenuation rate increase according to tumor growth is mainly attributed to angiogenesis in the tumor region.
In conclusion, OCT images of tumor mass in an animal model were investigated using SD-OCT having the axial resolution of 6.8