검색 전체 메뉴
PDF
맨 위로
OA 학술지
Contrast Enhancement of Laser Speckle Contrast Image in Deep Vasculature by Reduction of Tissue Scattering
  • 비영리 CC BY-NC
  • 비영리 CC BY-NC
ABSTRACT
Contrast Enhancement of Laser Speckle Contrast Image in Deep Vasculature by Reduction of Tissue Scattering
KEYWORD
Laser speckle imaging , Tissue optical clearing , Vasculature , Contrast enhancement
  • I. INTRODUCTION

    Monitoring of subcutaneous blood flow is of high importance in fundamental studies, clinical diagnoses, and intraoperative procedures because it provides critical information on the condition of biological tissues and the various disorders in human organs [1,2].

    Optical methods such as laser Doppler flowmetry (LDF) and laser Doppler imaging (LDI) have been widely used in clinics to measure tissue blood perfusion and to detect vasculature with minimal invasiveness [3]. LDF has been typically used to monitor relative changes in blood flow with temporal resolution. However, LDF is based on a point measurement method that measures only a specific site of the entire vasculature. Although LDI provides spatial information, it requires a long scanning time to obtain spatially resolved images of relative changes in blood flow. Therefore, its temporal resolution is insufficient to image the changes in blood flow. The trade-off between spatial and temporal resolutions limits the use of laser Doppler methods in many clinical and research applications [2,4-6].

    Laser speckle contrast image (LSCI) provides two-dimensional (2D) image of blood flow velocity in biological tissue and has been widely used because of its simplicity, real-time feedback, and negligible motion artifacts [3,5]. In addition, the LSCI provides a noninvasive full-field image and has no trade-off between spatial and temporal resolutions. The LSCI has been utilized for various studies such as peripheral arterial occlusive disease, blood flow in the cerebrum and cortex, retinal optic nerve disorders, blood flow in nearsurface tissues such as skin and mesenteric microcirculation, and in vivo dorsal skin fold microvasculature [1,7]. However, to the best of our knowledge, there is a paucity of imaging studies of the vasculature and blood flow in deep tissue layers because of tissue turbidity.

    Various optical and image processing methods have been proposed for enhancing the contrast of LSCI in subcutaneous blood flow measurements [1,8-13]. However, LSCI still suffers from low image contrast, although the limitation of laser penetration depth in tissue due to the light scattering property has been partially addressed. In this study, a physicochemical tissue optical clearing (PCTOC) method [14] that is effective in the reduction of light scattering in tissue was applied to enhance the contrast of LSCI of vasculature in deep tissue layers, which is not clearly observed by the naked eye.

    II. METHODS

       2.1. Principle of Laser Speckle Contrast Imaging

    Speckle is a random interference pattern produced by fluctuations in the spatial or temporal intensity of laser scattered from the illuminated surface. When the illuminated particles move, the interference pattern changes over time, and finally, a time-varying speckle pattern is generated. The LSCI is used to statistically analyze the intensity fluctuations of the time-varying speckle pattern and provides 2D velocity information about moving particles with spatial and temporal resolutions.

    The intensity variation is quantified by local speckle contrast and is defined as the ratio of the standard deviation to the mean intensity of the speckle image [15].

    image

    A window of N × N pixels is moved to compute the local speckle contrast along the image. The window size is typically chosen by considering the trade-off between statistical accuracy and spatial resolution. A small window size reduces the statistical accuracy, whereas a larger window size limits the spatial resolution. This study used a 5 × 5 pixel window.

    To ensure proper sampling for the LSCI, it is necessary that the size of a single speckle in the imaging plane approximately equals the size of a single pixel in the chargecoupled device (CCD) camera. The speckle size is determined as follows [3]:

    image

    where d is the speckle size, M is the magnification of the imaging system, λ is the wavelength of the laser, and f / # is the f-number of the camera lens. In this study, the appropriate speckle size was determined by adjusting f / #.

       2.2. Laser Speckle Contrast Imaging Modality

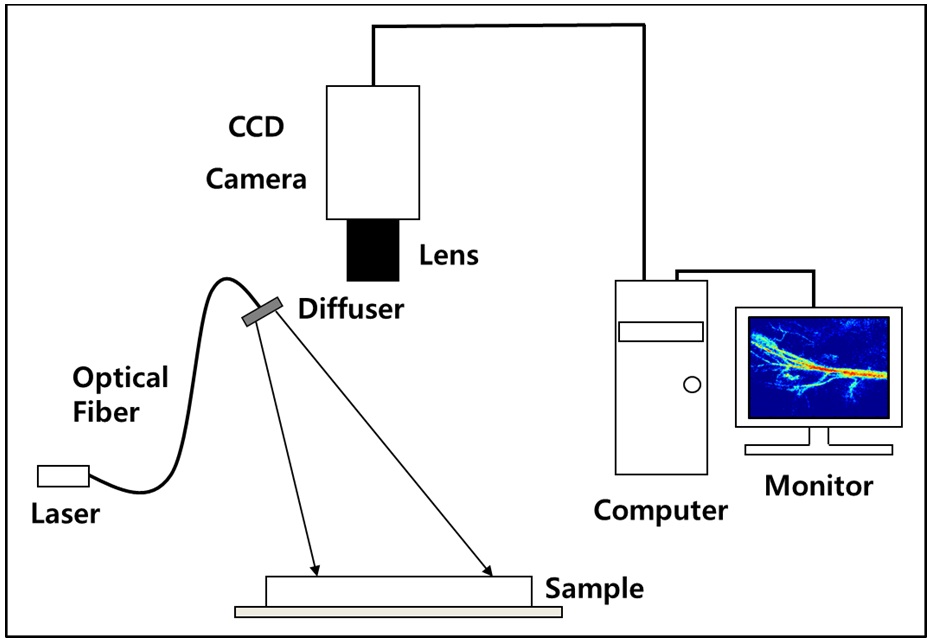
    Figure 1 shows the schematic diagram of the experimental setup. A diode laser (HL6512MG; 658 nm, 50 mW; Thorlabs, Newton, NJ, USA) was coupled into an optical fiber. A holographic diffuser was mounted in front of the optical fiber to evenly illuminate the region of interest (ROI). The ROI was imaged with a monochromatic progressive

    scan CCD camera (XC-HR57; Sony, Tokyo, Japan) with a resolution of 648 × 494 pixels. Ex and in vivo LSCIs were respectively obtained with following camera setups: a fixed focal length lens and a zoom lens; imaging areas of approximately 25 × 30 mm2 and 7 × 9 mm2; and exposure times of 10 ms and 4 ms. The exposure time was empirically determined based on preliminary experiments. Images were acquired at 30 Hz with a frame-grabber (DOMINO IOTA; Euresys, Angleur, Belgium).

       2.3. Sample Preparation

    ex vivo porcine skin samples were obtained from a local butcher shop and the experiment was performed within 2 days after obtaining the samples. The samples were prepared at a thickness of approximately 1.45 mm and a size of 3 × 4 cm2 by removing the subcutaneous fat layer.

    For the in vivo experiment, male ICR mice (n = 3) weighing 40 to 45 g were anesthetized with ketamine (1.5 ml/kg) and xylazine (0.5 ml/kg) intraperitoneally. Body temperature was constantly maintained using a small heating lamp during the experiment. The left femoral artery was selected for the LSCI because of its deep vasculature and the hair was shaved. The experimental protocol was approved by the Institutional Animal Care and Use Committees (IACUC) at Yonsei University, South Korea.

       2.4. PCTOC Method

    A PCTOC method [14], which combines the microneedling method and the topical application of glycerol, was applied to ex vivo and in vivo experiments before taking LSCIs. A microneedle roller (Clinical Resolution Laboratory, Inc; Los Angeles, CA, USA) was used to create artificial microchannels in the skin for trans-epidermal delivery of glycerol and, consequently, reduce the diffusion time of glycerol [14]. The microneedle roller was applied 50 times in the vertical, horizontal, and diagonal directions, and 70% glycerol was then topically applied to the skin surface.

       2.5. Experiment Design

    In the ex vivo experiment, a pumping system that consisted of a peristaltic pump and tubing was integrated into the laser speckle contrast imaging modality to circulate a 0.1% intralipid solution at speeds of 0 and 5 ml/sec. The ex vivo porcine skin samples were placed on the tubing and treated with the PCTOC. LSCIs were obtained before and 90 min after glycerol application. In the in vivo ICR mice experiment, LSCIs were obtained every 10 min up to 30 min after the application of the PCTOC and saline solution was then applied for 30 min to obtain skin recovery images. For quantitative analysis of LSCI, nonvasculature regions and both small and large vasculature regions were randomly selected and numbered as shown in the first image of Fig. 4(a).

       2.6. Quantitative Evaluation of LSIC

    The PCTOC enhances light penetration depth by reducing light scattering in tissue and therefore, revealing more vasculature in deep tissue layer. As a result, LSCI provides more clear blood flow information in vasculature. Such an effect was quantitatively evaluated by computing relative speckle index (RSI) from the ex vivo and in vivo LSCIs with a laboratory written MATLAB (Natick, MA, USA) program:

    image

    In the ex vivo experiment (Fig. 2(b)), MV0 and MVt indicate the average pixel values of three tubing regions before and 90 min after glycerol application, respectively. In the in vivo experiment (Fig. 4(b)), MV0 and MVt indicate the average pixel values of images before glycerol application and at elapsed time t, respectively. The identical ROI was selected for the analysis as a function of time. Greater RSI means faster blood flow velocity.

    III. RESULTS

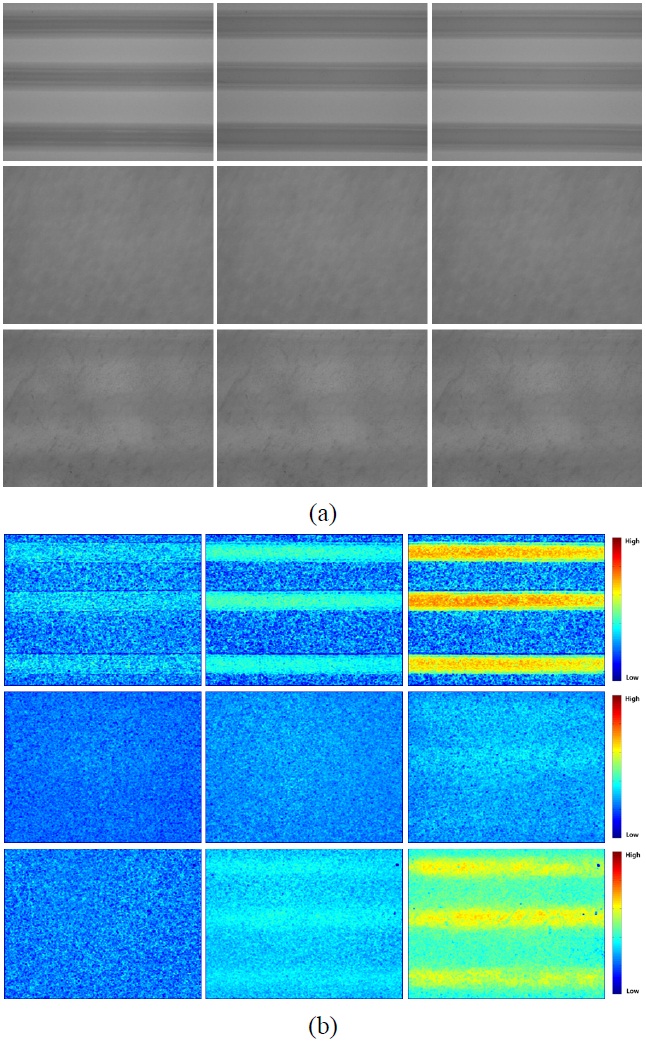
    Figure 2(a) shows the change in tissue turbidity that resulted from applying the PCTOC to ex vivo porcine skin samples. Only the tubing images (top images) shows highly distinguishable tubing structure from the surrounding regions. In the middle images, the tubing structure was not discernible, owing to tissue turbidity caused by the skin sample placed on the tubing. However, 90 min after glycerol application, the tissue turbidity was sufficiently reduced to observe the tubing structure under the skin sample (bottom images).

    Figure 2(b) shows the ex vivo LSCIs depending on the velocity of the intralipid solution and the PCTOC effects. The top image in Fig. 2(b) shows a clear LSCI of tubing without ex vivo porcine skin samples. However, the image contrast decreased after the skin sample was placed on the tubing (middle images). At 90 min after the application of the PCTOC, the LSCI (bottom images) shows similar image contrast to that of only tubing (top images).

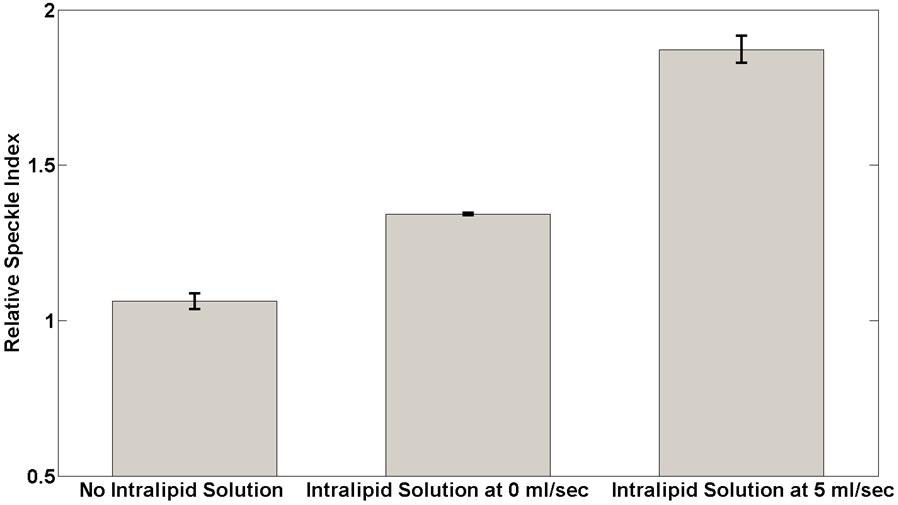
    Figure 3 shows quantitative analysis of RSI changes in the LSCI as calculated from the middle and bottom images in Fig. 2(b) using equation (3). The RSI increased after the application of the PCTOC and as a function of flow velocity of the intralipid solution. The RSI increased by 6.18, 34.18, and 87.15% for the cases without the intralipid solution inside the tubing, and with intralipid solution inside the tubing at 0 and 5 ml/sec, respectively.

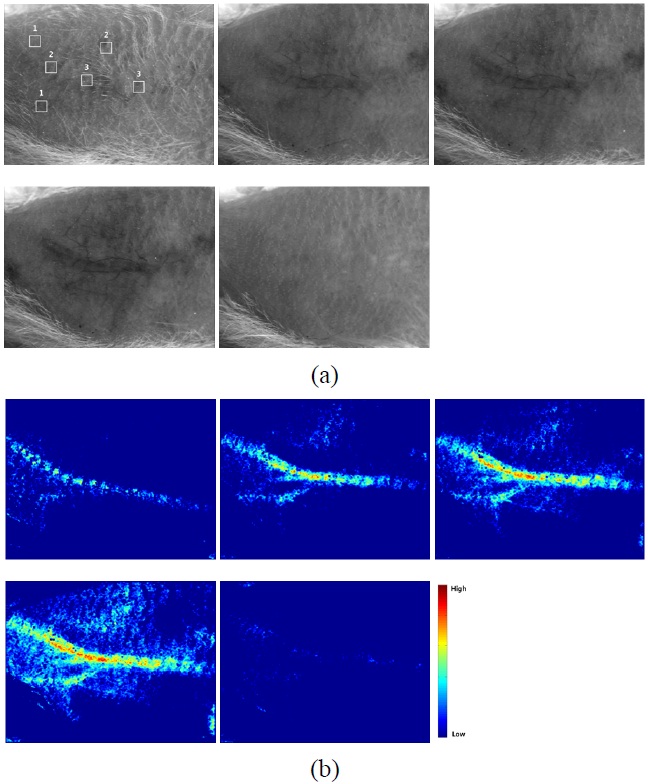
    The subcutaneous vasculature, which is not clearly visible to the naked eye, became visible after the application of the PCTOC (Fig. 4(a)). The vasculature was clearly observed 30 min after the application of the PCTOC and returned to normal 30 min after the application of the saline solution.

    Figure 4(b) shows the LSCIs of Fig. 4(a). The LSCI

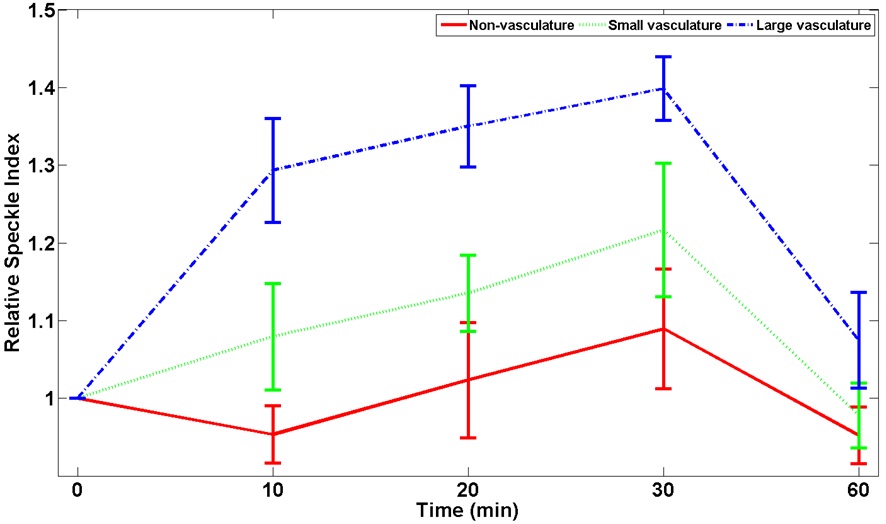
    increased as a function of time after the application of the PCTOC and decreased after the application of the saline solution. Fig. 5 shows the quantitative analysis of RSI as a function of time for nonvasculature, small, and large vasculature regions in three in vivo ICR mice. The RSI increased approximately by 4.8, 17.5, 39.9% in nonvasculature, small, and large vasculature regions, respectively.

    IV. DISCUSSION

    The PCTOC effects were evaluated by observing the tubing structure under the ex vivo porcine skin sample and the in vivo vasculature of an ICR mouse (Figs. 2(a) and 4(a)). A noticeable tissue optical clearing effect was observed 30 min after the application of the PCTOC in the in vivo experiment, indicating enhancement of the light penetration depth in the mouse skin. However, only glycerol application without microneedling treatment did not induce significant tissue optical clearing effects, probably owing to nonpermeability of glycerol in the mouse skin [14]. The microneedles produce multiple artificial microchannels in the skin and consequently increase the diffusion of glycerol through the perforated epidermis.

    Most of the previous studies focused on the observation of in vivo vasculature that is exposed by surgical procedures and that can be clearly observed by the naked eye, and the shallow in vivo capillaries. Herein, the LSCI combined with the PCTOC was applied to image relatively deep subcutaneous vasculature. The LSCI normally provides a highly perfused skin image owing to light scattering property. However, when the skin was treated with the PCTOC, the LSCI clearly showed the flow information of the intralipid solution in the tubing and the blood in the femoral artery (Figs. 2(b) and 4(b)).

    As shown in Figs. 2(b) and 3, the LSCI depends on the application of the intralipid solution. Without the application of the PCTOC, the LSCI did not adequately reflect the flow information of the intralipid solution in the tubing (middle images in Fig. 2(b)). However, the LSCI and RSI increased after the application of the PCTOC (bottom images in Figs. 2(b) and (3)). When the intralipid solution was inside the tubing, the LSCI somewhat increased even at 0 ml/sec after the application of the PCTOC. It may be because the stationary intralipid solution slowly moves and scatters the illuminating laser light. The tubing structures were distinguishable and the flow information of the intralipid solution can be verified due to the enhanced LSCI. The tubing region shown in the bottom images in Fig. 2(b) exhibits an LSCI similar to that of the top images, but the surrounding region of the tubing shows an increased LSCI (bottom center and right images). This may be owing to the reduction in the tissue turbidity by the PCTOC, which enhances the LSCI in not only the tubing region but also the surrounding region of the tubing.

    As shown in Fig. 4(b), the LSCI increased as a function of time and the femoral artery gradually exhibited faster blood flow, showing more regions of small and large vasculature, which indicates a reduction in tissue turbidity. The LSCI changed more rapidly in large vasculature than in small vasculature because more red blood cells may reflect better LSCI [3], and increased as a function of time after the application of the PCTOC because of a reduction in tissue turbidity. The nonvasculature region did not show significant changes, because no blood flow information was reflected to the LSCI. When saline solution was applied to a transparent skin region, the LSCI was recovered to a normal skin condition because the transparent skin may become turbid again by the saline solution [16].

    In general, subcutaneous blood flow, which is a dynamically fluctuating biological variable and has substantial spatial heterogeneity, is invasively monitored by performing open surgery to reveal vasculature [1,5,7,8,11]. However, it was successfully monitored in real time in the present study without open surgery by applying the PCTOC, which clearly reveals vasculature in deep tissue layers.

    V. CONCLUSION

    The LSCI combined with the PCTOC was greatly enhanced even in deep vasculature. The LSCI increased as a function of time after the application of the PCTOC and was properly recovered to initial conditions after the application of a saline solution. It is expected that similar results may be obtained using the suggested LSCI in in vivo human studies.

참고문헌
  • 1. Murari K., Li N., Rege A., Jia X., All A., Thakor N. (2007) “Contrast-enhanced imaging of cerebral vasculature with laser speckle” [Appl. Opt.] Vol.46 P.5340-5346 google cross ref
  • 2. Bray R. C., Forrester K. R., Reed J., Leonard C., Tulip J. (2006) “Endoscopic laser speckle imaging of tissue blood flow: applications in the human knee” [J. Orthop. Res.] Vol.24 P.1650-1659 google cross ref
  • 3. Forrester K. R., Tulip J., Leonard C., Stewart C., Bray R. C. (2004) “A laser speckle imaging technique for measuring tissue perfusion” [IEEE Trans. Biomed. Eng.] Vol.51 P.2074-2084 google cross ref
  • 4. Forrester K. R., Stewart C., Tulip J., Leonard C., Bray R. C. (2002) “Comparison of laser speckle and laser Doppler perfusion imaging: measurement in human skin and rabbit articular tissue” [Med. Biol. Eng. Comput.] Vol.40 P.687-697 google cross ref
  • 5. Yuan S., Devor A., Boas D. A., Dunn A. K. (2005) “Determination of optimal exposure time for imaging of blood flow changes with laser speckle contrast imaging” [Appl. Opt.] Vol.44 P.1823-1830 google cross ref
  • 6. Forrester K. R., Stewart C., Leonard C., Tulip J., Bray R. C. (2003) “Endoscopic laser imaging of tissue perfusion: new instrumentation and technique” [Lasers Surg. Med.] Vol.33 P.151-157 google cross ref
  • 7. Cheng H., Luo Q., Wang Z., Gong H., Chen S., Liang W., Zeng S. (2003) “Efficient characterization of regional mesenteric blood flow by use of laser speckle imaging” [Appl. Opt.] Vol.42 P.5759-5764 google cross ref
  • 8. Cheng H., Luo Q., Zeng S., Chen S., Cen J., Gong H. (2003) “Modified laser speckle imaging method with improved spatial resolution” [J. Biomed. Opt.] Vol.8 P.559-564 google cross ref
  • 9. Kirkpatrick S. J., Duncan D. D., Wells-Gray E. M. (2008) “Detrimental effects of speckle-pixel size matching in laser speckle contrast imaging” [Opt. Lett.] Vol.33 P.2886-2888 google cross ref
  • 10. Tom W. J., Ponticorvo A., Dunn A. K. (2008) “Efficient processing of laser speckle contrast images” [IEEE Trans. Med. Imaging] Vol.27 P.1728-1738 google cross ref
  • 11. Cheng H., Luo Q., Zeng S., Chen S., Luo W., Gong H. (2004) “Hyperosmotic chemical agent?s effect on in vivo cerebral blood flow revealed by laser speckle” [Appl. Opt.] Vol.43 P.5772-5777 google cross ref
  • 12. Ramirez-San-Juan J. C., Ramos-Garcia R., Guizar-Iturbide I., Martinez-Niconoff G., Choi B. (2008) “Impact of velocity distribution assumption on simplified laser speckle imaging equation” [Opt. Express] Vol.16 P.3197-3203 google cross ref
  • 13. Volker A., Zakharov P., Weber B., Buck F., Scheffold F. (2005) “Laser speckle imaging with an active noise reduction scheme” [Opt. Express] Vol.13 P.9782-9787 google cross ref
  • 14. Yoon J., Son T., Choi E. H., Choi B., Nelson J. S., Jung B. (2008) “Enhancement of optical skin clearing efficacy using a microneedle roller” [J. Biomed. Opt.] Vol.13 P.021103 google cross ref
  • 15. Choi B., Ramirez-San-Juan J. C., Lotfi J., Nelson J. S. (2006) “Linear response range characterization and in vivo application of laser speckle imaging of blood flow dynamics” [J. Biomed. Opt.] Vol.11 P.041129 google
  • 16. Vargas G., Readinger A., Dozier S. S., Welch A. J. (2003) “Morphological changes in blood vessels produced by hyperosmotic agents and measured by optical coherence tomography” [Photochem. Photobiol.] Vol.77 P.541-549 google cross ref
OAK XML 통계
이미지 / 테이블
  • [ FIG. 1. ]  Schematic diagram of laser speckle imaging modality.
    Schematic diagram of laser speckle imaging modality.
  • [ FIG. 2. ]  (a) White light images of the ex vivo experiment. Top: tubing-only images, middle: tubing image under ex vivo porcine skin sample, bottom: tubing images under ex vivo porcine skin sample 90 min after the application of the physicochemical tissue optical clearing (PCTOC). The left, center, and right images in each row indicate the cases of no intralipid solution in the tubing, intralipid solution in the tubing at 0 ml/sec, and at 5 ml/sec, respectively. (b) Laser speckle contrast images of (a).
    (a) White light images of the ex vivo experiment. Top: tubing-only images, middle: tubing image under ex vivo porcine skin sample, bottom: tubing images under ex vivo porcine skin sample 90 min after the application of the physicochemical tissue optical clearing (PCTOC). The left, center, and right images in each row indicate the cases of no intralipid solution in the tubing, intralipid solution in the tubing at 0 ml/sec, and at 5 ml/sec, respectively. (b) Laser speckle contrast images of (a).
  • [ FIG. 3. ]  Relative speckle index of the ex vivo experiment that is computed from the middle and bottom laser speckle contrast images (LSCI) in Fig. 2b using equation (3).
    Relative speckle index of the ex vivo experiment that is computed from the middle and bottom laser speckle contrast images (LSCI) in Fig. 2b using equation (3).
  • [ FIG. 4. ]  (a) The images from left to right indicate white light images of in vivo ICR mouse obtained at 0, 10, 20, and 30 min after the application of the physicochemical tissue optical clearing (PCTOC), and 30 min after the application of the saline solution at the end of PCTOC application. Regions 1, 2, and 3 indicate nonvasculature, small, and large vasculature regions. (b) Laser speckle contrast images (LSCI) of (a).
    (a) The images from left to right indicate white light images of in vivo ICR mouse obtained at 0, 10, 20, and 30 min after the application of the physicochemical tissue optical clearing (PCTOC), and 30 min after the application of the saline solution at the end of PCTOC application. Regions 1, 2, and 3 indicate nonvasculature, small, and large vasculature regions. (b) Laser speckle contrast images (LSCI) of (a).
  • [ FIG. 5. ]  Relative speckle index in nonvasculature, small, and large vasculature regions of three in vivo ICR mice.
    Relative speckle index in nonvasculature, small, and large vasculature regions of three in vivo ICR mice.
(우)06579 서울시 서초구 반포대로 201(반포동)
Tel. 02-537-6389 | Fax. 02-590-0571 | 문의 : oak2014@korea.kr
Copyright(c) National Library of Korea. All rights reserved.