Recently, solid-state lighting based on white light-emitting diodes (LEDs) has attracted great interest as a high-energyefficiency and environment-friendly lighting technology [1-4]. Now, the luminous efficiency (LE) of white LEDs far exceeds that of incandescent and fluorescent lamps, which enables the white LEDs to be used in various lighting applications such as back lights in liquid-crystal displays, automobile lamps, and general illumination. By further increasing the luminous efficiency and lowering the production cost, the white LEDs are expected to widely replace current light bulbs in the near future.
Currently, most white LEDs are manufactured as a phosphorconversion type, which consists of a GaN/InGaN-based blue LED and a yellow phosphor excited by the blue LED. In this phosphor-conversion white LED, part of blue light emitted from the blue LED chip is absorbed in the phosphor and converted into yellow light from the phosphor. The unabsorbed blue light is transmitted out of the phosphor. By properly mixing the yellow light of the phosphor and the transmitted blue light, white light with moderate chromaticity coordinates and correlated color temperature (CCT) can be produced. During the last several years, there has been rapid progress in the luminous efficiency of the phosphorconversion white LEDs. The luminous efficiency (LE) of commercially available white LEDs can be higher than 120 lm/W, and that of R&D LED samples has been reported to be as high as 180 lm/W [5].
However, there has been lack of study on the theoretical analysis of LE in the phosphor-conversion white LEDs. The analysis of LE in the phosphor-conversion white LED is not so simple compared with that in the multi-chip-based white LEDs owing to the conversion processes in phosphors. Although the theoretical limit of LE in phosphor-conversion white LEDs has been believed to be 260~300 lm/W [5], theoretical models to obtain the limit theoretical value of LE have not been clearly presented. In this paper, we rigorously analyze LE of phosphor-conversion white LEDs based on the photometric study of white light. The analytical model is used to find the theoretical limit of LE using the measured spectrum of the phosphor-conversion white LED. It will be shown that the presented model can be used to obtain some information on the efficiency of the measured white LED such as the radiative conversion efficiency of the phosphor and the wall-plug efficiency (WPE) of the blue LED chip used in the phosphor-conversion white LED.
LE of an LED,
where
For phosphor-conversion white LEDs, the luminous flux is express as

where

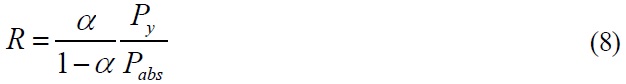
We denote

Consequently, LE is written as
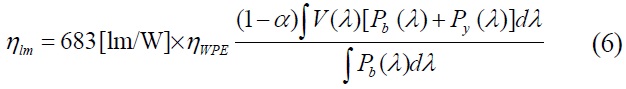
Eq. (6) relates LE of the phosphor-conversion white LED with WPE of the blue LED chip inside the white LED. Since
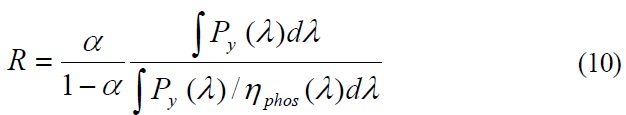
Here, we introduce a quantity,
By using Eq. (5),

where
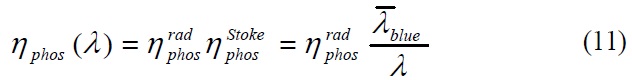
where

is the radiative efficiency of a phosphor which is assumed to be independent of emission wavelength and

is the average wavelength of the blue light spectrum. Then,
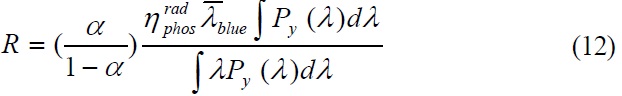
Eq. (12) implies that
can be determined once
are obtained experimentally. However, in order to obtain
is assumed to be 100%, the lowest limit of
The theoretical analysis of the LE in phosphor-conversion white LEDs presented in this section will be applied to the experimentally measured results of a specific white LED in the following sections.
Characteristics of a commercial phosphor-conversion white LED sample were measured by using an LED characterization system with a calibrated integrating sphere. A packaged LED white sample was soldered on a metal printed circuit board (PCB) which was mounted on a heat sink. The temperature of the metal PCB was maintained at 25 ℃ by a temperature control system with a thermo-electric cooler. Then, electro-optical characteristics were measured by applying current and voltage to the LED.
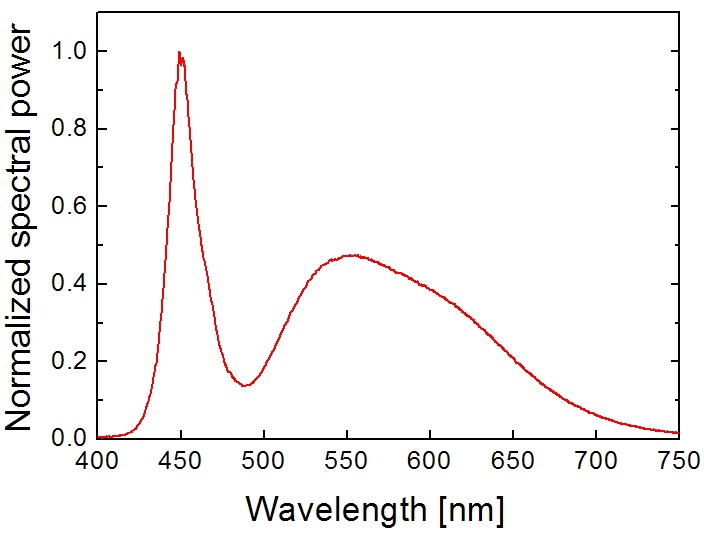
Photometric properties of the white LED were measured under continuous-wave operation up to 350 mA. Fig. 1 shows the measured spectrum of the white LED when injection current is 350 mA. Typical spectral shape of the phosphorconversion
white LED with a blue LED and a yellow phosphor is observed. In this sample, the peak wavelength of blue light from the InGaN LED chip and yellow light from the phosphor exist around 450 and 555 nm, respectively.
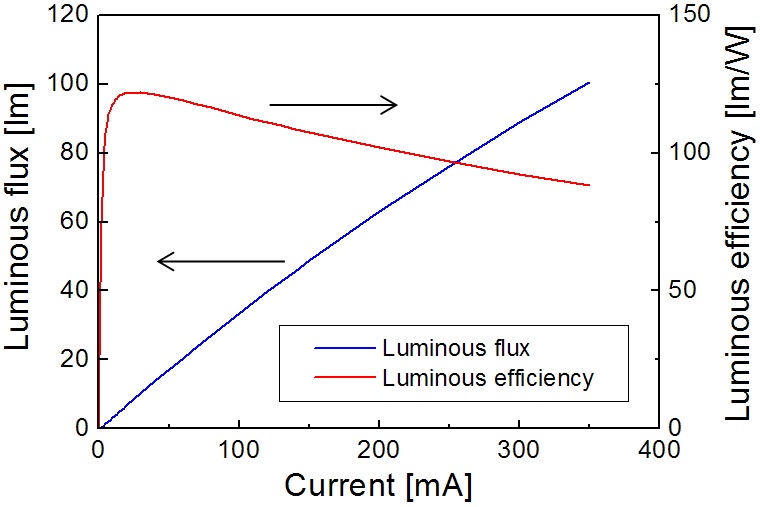
Figure 2 shows the luminous flux and LE of the LED as current increases. The luminous flux increases linearly with injection current and it reaches ~100 lm at 350 mA. The peak value of LE is ~122 lm/W at 30 mA. However, LE decreases gradually with increasing current when current is larger than 30 mA, and it is reduced to ~88 lm at 350 mA. This decrease in LE of the white LED results mainly from the “efficiency droop” phenomena of the blue LED chip [6-8].
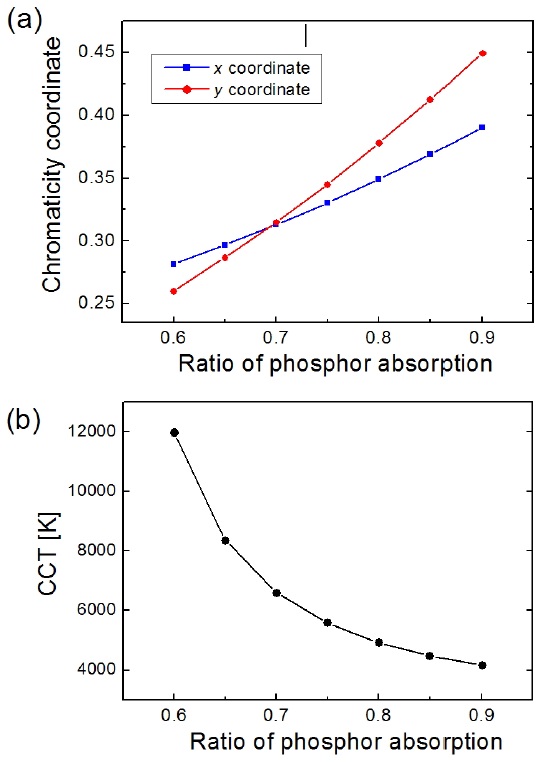
Colorimetric characteristics of the measured white LED were also evaluated based on the standard by Commission International de I’Eclairage (CIE). The chromaticity coordinates in the CIE
The theoretical limit of LE of the measured phosphorconversion white LED is calculated from Eqs. (6) and (12) using the spectrum in Fig. 1. Assuming that the radiative efficiency of the phosphor,
is 100%, the lowest limit of

the ratio of phosphor absorption,

Therefore, the maximum LE of the measured white LED will be 261 lm/W assuming that both WPE of the blue LED chip and the radiative efficiency of the yellow phosphor are 100%. By using the measured LE of the white LED in Fig. 2, the lower limit of WPE of the blue LED chip can be deduced from Eq. (13). The peak value of LE at 30 mA was 122 lm/W, which corresponds to WPE of >46.8%. That is, the maximum WPE of the blue LED chip inside the measured white LED is higher than 46.8%. The LE at 350 mA was measured to be 88 lm/W, which corresponds to WPE of >33.7%. Accurate values of WPE can be obtained when the radiative efficiency of the phosphor,
is known. Conversely, if the WPE of the blue LED chip is known, the radiative efficiency of the phosphor could be determined.
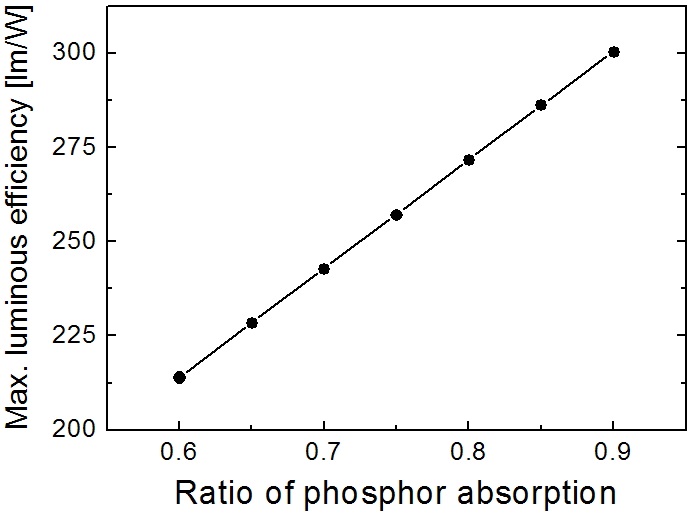
Eq. (13) implies that the theoretical limit of LE in the measured phosphor-conversion white LED is 261 lm/W. The theoretical maximum LE can be increased further by optimizing the spectrum of the white LED because LE is strongly influenced by the spectral distribution of emitted light. Eq. (3) implies that good overlap of the yellow light spectrum with the eye sensitivity function is important for increasing LE. In addition, relative output power of the blue and the yellow light also plays an important role in LE. In order to see the effect of the relative ratio of the blue and the yellow light, LE is calculated as a function
of the ratio of phosphor absorption,
Figure 3 shows the theoretical limit of LE as a function of
However,
The LE of the phosphor-conversion white LED was analyzed based on the photometric study of white light. The investigated white LED consists of a GaN-based blue LED chip and a yellow phosphor. We developed a theoretical model describing the relation between LE of a white LED, WPE of a blue LED chip, and the ratio of phosphor absorption of blue light. When the model was applied to a commercial phosphor-conversion white LED, the theoretical limit of LE was obtained to be 261 lm/W and the lower bound of WPE in the blue LED chip was found to be ~34% for LE of 88 lm/W at 350 mA. The theoretical model developed in this work is expected to be used advantageously for optimizing LE and color properties of phosphor-conversion white LEDs.