Liquid crystal panels (LCPs) are optoelectronic devices that can modulate the state of light. They are used for many practical applications including flat panel display, holography and optical information processing because of their inherent ability to spatially modulate a light beam in a programmable manner [1-4]. Twisted nematic (TN) type LCP spatial light modulators (SLMs) are good for intensity modulation and parallel aligned LCP SLMs are suitable for phase modulation. Some application areas of SLMs such as ultra-short laser pulse control require phase modulation [5,6]. However parallel aligned LCP SLMs are expensive, while TN-LCP SLMs are relatively low-cost and easily available. This is why much effort has been made to use TN-LCP SLMs for many applications [7,8].
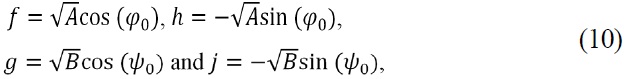
For programmable operation of a TN-LCP spatial light modulator (SLM), the Jones matrix of the TN-LCP needs to be determined accurately. However, manufacturers do not usually provide that information, and the user must determine the matrix. According to the literature, the TN-LCP can be considered as a stack of thin slices acting as homogeneous uniaxial crystals [9]. The Jones matrix of a homogeneous uniaxial crystal slice can be written as a function of its ordinary and extraordinary indices of refraction as well as the orientation angle of the liquid crystal molecules [9]. The Jones matrix of the whole TN-LCP can be described as the product of the individual Jones matrices of each homogeneous uniaxial crystal slice [10]. According to the approximation, the Jones matrix of the whole TN-LCP can be written as

Here

and
In this paper, we demonstrated a polarimetric method for unambiguous determination of signs of the Jones matrix elements. By measuring the transmittance with an optical system of polarizer-LCP-analyzer, we obtained the set of the unitary matrix elements. In addition, by measuring the transmittance after inserting a quarter wave plate in the system, we obtained another set of unitary matrix elements. By comparing two sets of unitary matrix elements, we could determine the unitary matrix elements accurately without the sign ambiguity.
Our method has some advantages with respect to other previous similar methods. First, our method improved the accuracy. In particular, polarizer and analyzer rotate in the same and opposite directions with 1degree angular increment from 0° to 180°, so Jones matrix elements were obtained from fitting a trigonometric function with many data points. Also, our method uses only two rotating elements (polarizer and analyzer) and except for the rotation of the polarizers the alignments of all the other optical elements were not disturbed during the measurement, which can reduce potential errors due to realignment.
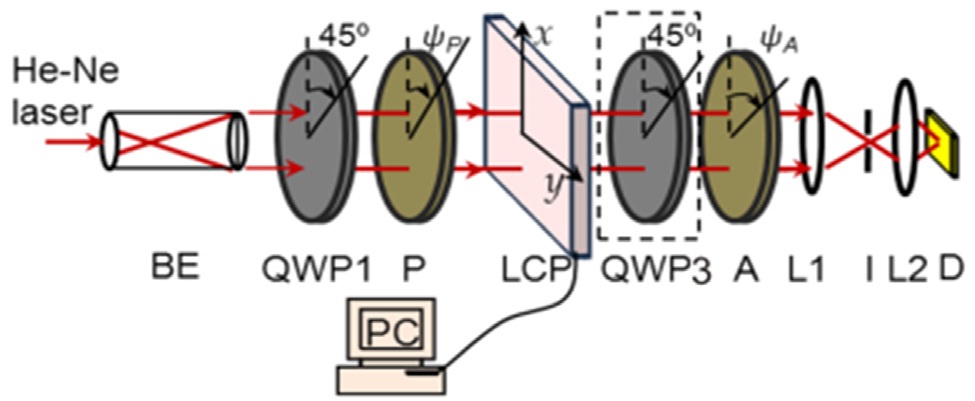
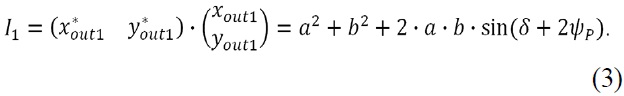
The polarimetric method to determine the Jones matrix is based on the transmittance measurement of the optical system. Let us first explain how to calculate the transmittance of the optical system. Our whole optical system consists of a He-Ne laser light source, a quarter wave plate (QWP1), polarizer (P), TN-LCP, analyzer (A) and a silicon photo-diode detector as shown in Fig. 1.
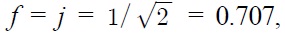
First we considered the transmittance intensity of the optical system consists of a light source, a quarter-wave plate (QWP1) and a polarizer. The laser light source was linearly polarized, so the QWP1 was used to make the linearly polarized light into the circularly polarized light. The circularly polarized light was the input beam of the polarizer. The azimuth angle of the polarizer was defined as
Here
The laser light was almost linearly polarized in the vertical (
We calculated the transmittance intensity of the whole optical system consists of a light source, a quarter-wave plate (QWP1), a polarizer, a TN-LCP and an analyzer. The TN-LCP was placed between a polarizer and an analyzer whose azimuth angles were
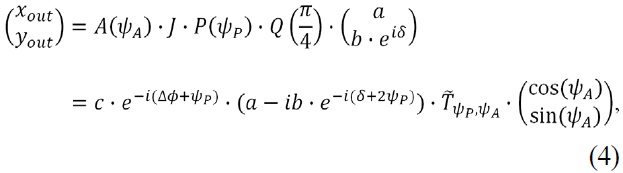
2.3. Definition of the Transmittance of the Optical System Composed of TN-LCP and Analyzer
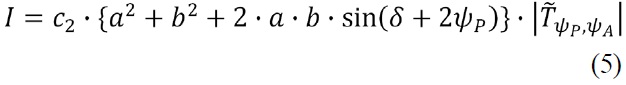
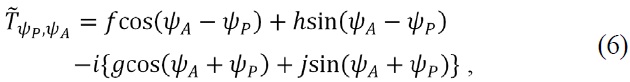
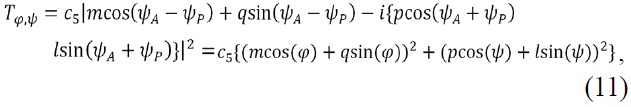
We defined the transmittance of the optical system composed of TN-LCP and analyzer,

Here
The optical system used in our study was shown in Fig. 1. The light source was a linearly polarized He-Ne laser. The laser beam was expanded by using the beam expander (BE) and then was sent to the quarter wave plate (QWP1). The quarter-wave plate made the linearly polarized light circularly polarized. The circularly polarized beam was directed to a rotating linear polarizer (P) and then was sent to the sample. The polarization state of the transmitted beam was investigated with an analyzer (A) and an additional quarter wave plate (QWP3). The intensity of the beam passed through the analyzer was measured with the photodiode (D). A quarter-wave plate (QWP2) and a TN-LCP SLM (Holoeye LC2002, SONY LCX016AL-6) were used as samples.
The transmittance of the optical system (sample + analyzer) depends only on the sum (

Here C is a constant.
4.1. Determination of the Jones Matrix Elements of a Quarter-wave Plate
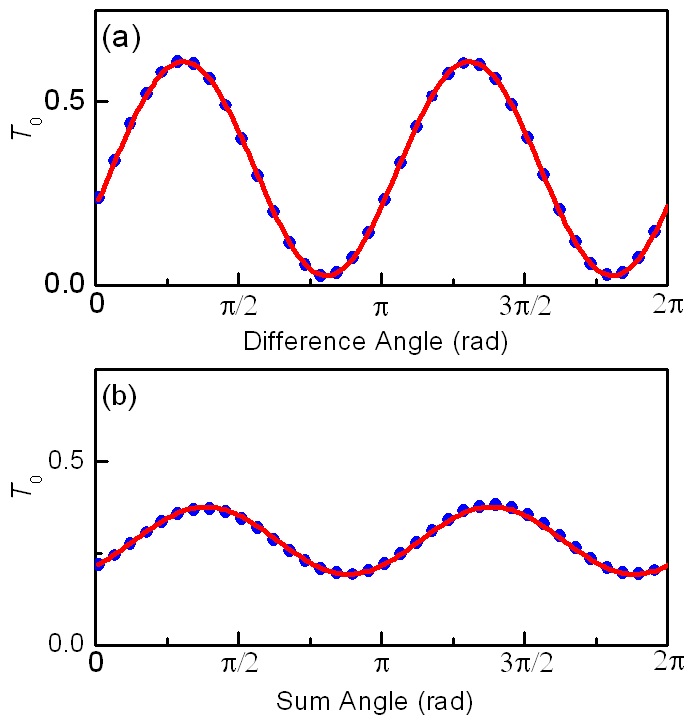
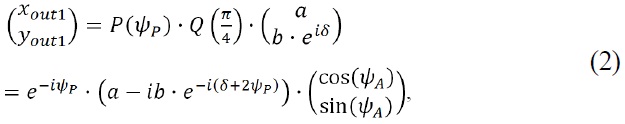
To check the validity of our method, the Jones matrix elements of a quarter wave plate (QWP2) is experimentally determined and compared with the theoretical one. The fast axis of the QWP2 is set to make 45º with the

from Eq. (1), where
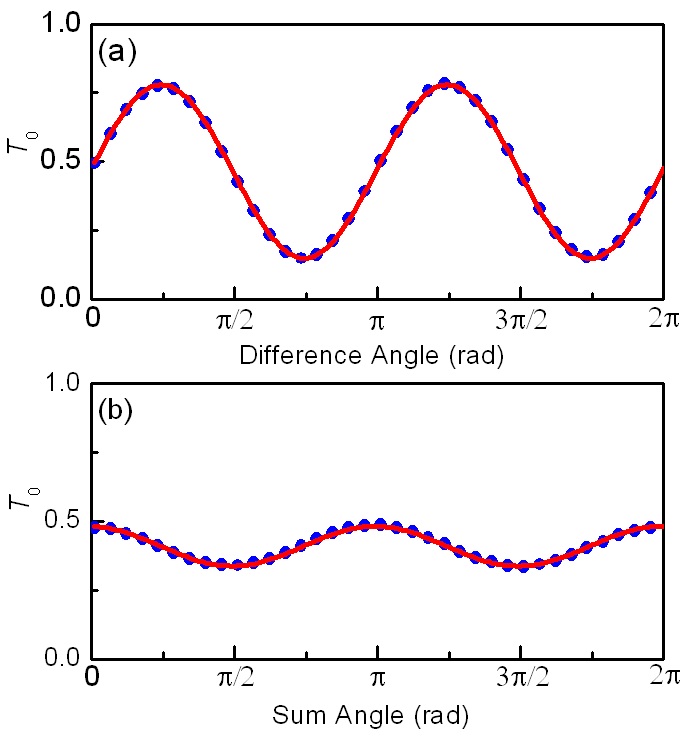
The transmittance
cosine function, the information about
Similarly, the analyzer and the polarizer are rotated in the same direction with the same angle increment so that the ‘difference angle (
It should be noted however that, the relative signs of
To eliminate the sign ambiguity, an additional quarter-wave plate (QWP3) was inserted between the quarter-wave plate (QWP2) and the analyzer. The fast axis of QWP3 was aligned 45° with respect to the x axis. Including the contribution of the QWP3, the transmittance became a function of
Here

Also the sum of the squares of the new elements should
satisfy
To determine
The sign of the
4.2. Determination of the Jones Matrix Elements of a TN-LCP Spatial Light Modulator
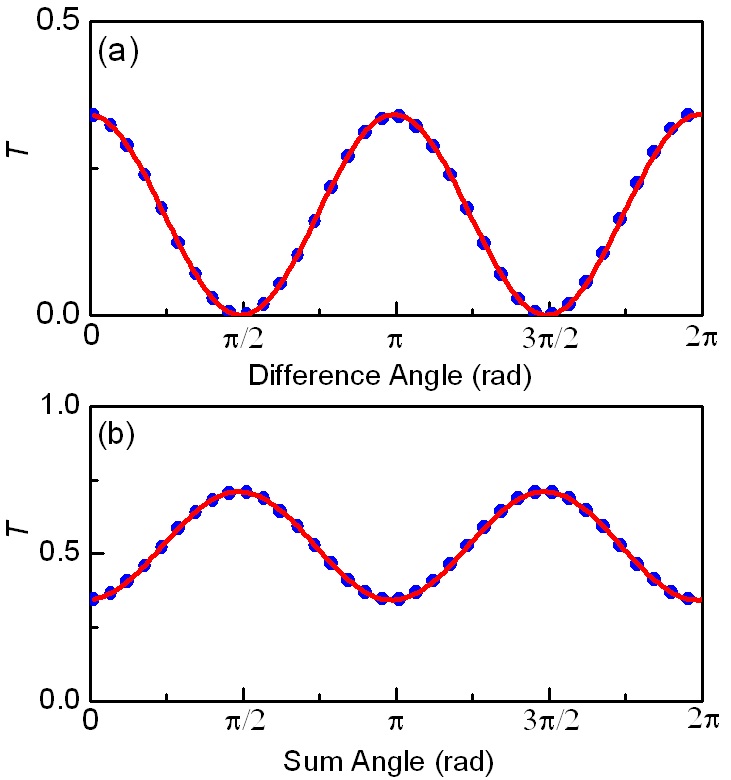
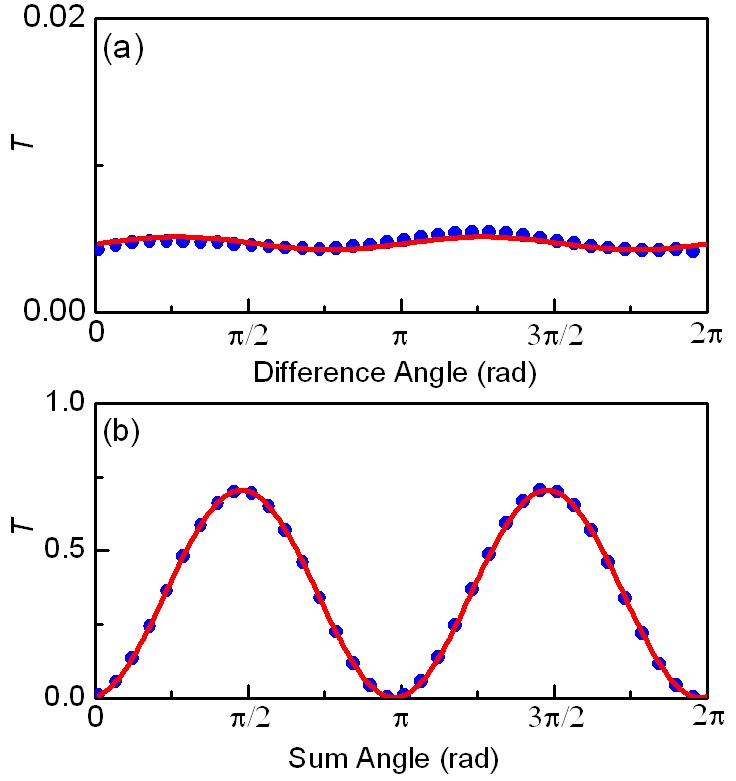
The same method was used to determine the Jones matrix elements of a programmable TN-LCP SLM. A programmable TN-LCP SLM was installed between the polarizer and analyzer as shown in Fig. 1. The TN-LCP can change the intensity and the phase of the input beam as the grey level is controlled by an external device. The corrected transmittances
one of the grey levels (grey level 192 of our LCP device). As demonstrated for the quarter-wave plate (QWP2) case, the absolute values of the
To determine the signs of the Jones matrix elements, additional set of data were measured. Fig. 5 shows the sum angle (
The sign of the
4.3. Corrections for the Transmittance Measurement
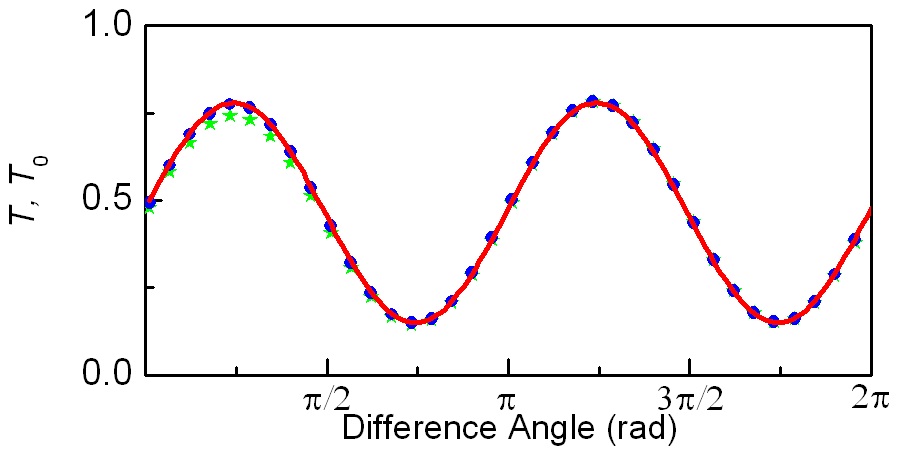
There is discrepancy between the theoretical transmittances described by Eqs. (8) and (11) and the measured transmittance. Such discrepancy is negligible for the quarter-wave (QWP2), but is not negligible for the TN-LCP. Fig. 6 shows the measured transmittance (
The intensity loss occurred at the TN-LCP is the most
dominant reason of the discrepancy. The intensity loss can be caused by many factors including absorption, scattering or reflection. However, the intensity loss does not affect the fitting process significantly in our method.
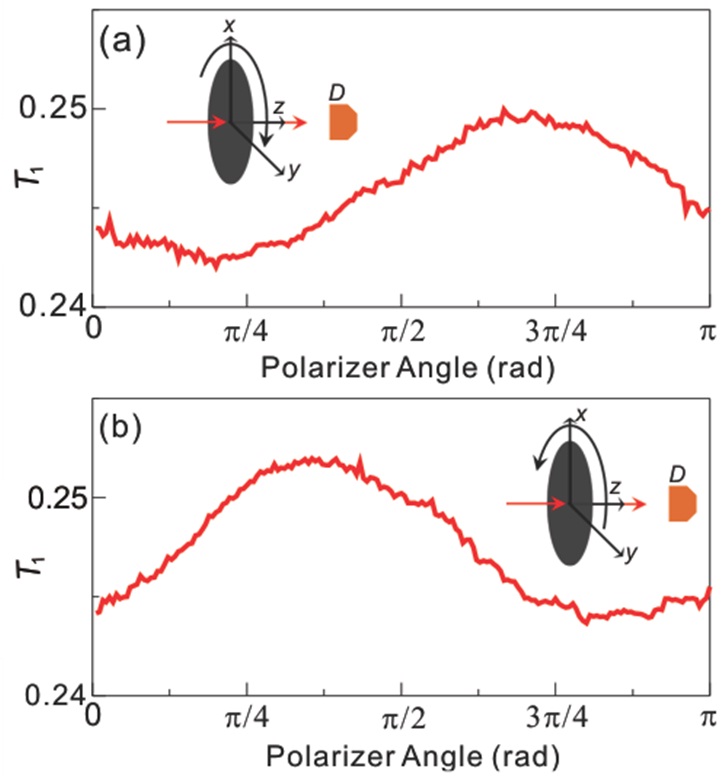
Figure 7 shows the polarizer angle dependence of the transmittance of the TN-LCP (
The final transmittance (
A polarimetric method was developed for determining the Jones matrix element without the sign ambiguity. The credibility of the method was checked by comparing the theoretical and experimental Jones matrix elements of a quarter-wave plate. The method was used to determine the Jones matrix elements of a twisted nematic liquid crystal panel (TN-LCP) successfully. The proposed method can be used to determine the Jones matrix elements of any other transparent optical materials.