Measurement of phoria is a routine test in optometric examination and plays an important part in the diagnosis of patient symptoms such as blur, headache, eyestrain, or diplopia and in the management of accommodation vergence disorders [1,2]. Clinically accurate and repeatable measurement of phoria is critical when diagnosing and managing such conditions [2]. There are numerous methods used clinically to measure a phoria. For measurement of phoria, binocular fusion has to be eliminated. The basis of these methods was as follows: by occlusion of one eye, by displacement of a single image using a prism, by distortion of a single image, or by the use of dissimilar targets [3]. The tests on the basis of these methods are called the cover test, the von Graefe method, the Maddox rod test, the Thorington method, a modified Thorington test, stereoscopes, and the Howell phoria card method. Most methods of phoria measurement are subjective. The variability, reliability and repeatability of phoria tests have been published in the magnitude of prism diopters by each method [4-9]. Variability in results of phoria tests was attributed to possible examiner bias, test technique variations, inadequate accommodative control, and subject response skill [10]. The ideal test should have good reliability and validity and should be simple to administer [11].
We tried to ascertain another test which is fast, accurate and can be applicable to online or mobile testing. We have found a new test that can quantify the phoria without a prism or a special lens. A dichromatic color filter and a new phoria card which can be seen as dissimilar targets based on color composite image were used. The key point of this new test is to be able to self-test with an auto-flashed presentation via a programmed display. The purpose of this study was to assess repeatability and reliability of a new phoria test as compared to established phoria tests and to assess the possibility of mobile or online application using the auto-flashed version of a new phoria test.
One hundred nine undergraduate optometry students (Korean, average age 23.8 ± 1.8 years; 73 males and 36 females) volunteered to participate in this study. Each subject provided informed consent to participate in this study based on oral explanation. The study was conducted in adherence to the tenets of the Declaration of Helsinki. Subjects had monocular visual acuity of at least 0.9 with best correction, normal stereopsis, and no physical problems. Preliminary tests were individually completed in one week.
Two faculty members from the Dept. of Optometry at Kangwon National University performed the phoria measurement procedure. Each examiner evaluated the phoria at near distance (40 cm or 33 cm) using four different methods: von Graefe method, Howell card test, modified Thorington test, and RBP card test. For the analysis of inter-examiner difference, the first examiner performed the four methods in order then the second examiner immediately repeated the procedure to evaluate phoria. After 24 hours from the first test, the two examiners measured the same subjects again by the same procedure for an analysis of test-retest difference.
To assess the possibility of mobile or online application for the auto-flashed presentation of a new phoria test, 26 new subjects (Korean, average age 24.3 ± 3.0 years; 19 males and 7 females) were tested. The subjects measured near phoria by themselves using the auto-flashed presentation on the monitor. All conditions for subjects and measurement were the same as the prior testing. A description of the procedure was presented well before the tests; each test was performed two times at 24 hour intervals. Test-retest repeatability and intraclass correlation coefficient were evaluated.
2.1. Von Graefe Method ? Continuous Presentation
A 6 Δ base-up was placed over the left eye and a 12 Δ base-in was placed over the right eye in the subject seated behind the phoropter. A vertical arrow target was held at 40 cm from the subjects by the examiner. Subjects were instructed to keep the target clear at all times. If subjects didn’t see target dissociation vertically, the examiner adjusted the Risley prism over the left eye until dissociation occurred. The examiner then checked the relative direction of the upper target to the lower one, right or left. The horizontal prism over the right eye was moved slowly until the subject said that two targets were aligned vertically. At this point, prism power and base direction were recorded.
2.2. Howell Card Test ? Flashed Presentation
The Howell near phoria card was held at 33 cm from the subjects by the examiner. An 8 Δ base-up was placed over the subject’s left eye using a trial frame. The examiner placed the occluder over the left eye and subjects were instructed to keep the downward-pointing arrow clear at all times. When the occluder was removed, subjects were asked to instantaneously report what number the top arrow pointed to on the bottom line. The arrow pointing to an odd number on a yellow background indicated an esophoria while an even number on the blue background indicated exophoria.
2.3. Modified Thorington Test ? Flashed Presentation
The MIM card (Bernell Muscle Imbalance Measure card) was used for this method. The MIM card was held at 40 cm from the subjects by the examiner. The card consists of horizontal and vertical scales of numbers graduated by 1 Δ at 40 cm. There is a hole at the intersection of vertical and horizontal scales through which a penlight is shown to the subject. A red Maddox rod with striations horizontally was placed over the subject’s left eye using a trial frame. The penlight through the hole shows a red vertical line by the Maddox. The examiner placed the occluder over the left eye and subjects were instructed to keep the numbers clear at all times. When the occluder was removed, subjects were asked to instantaneously report the number on the red line passed. A red line passing on the left of the penlight indicated an esophoria and on the right of the penlight indicated exophoria.
2.4. RBP Card Test ? Flashed Presentation
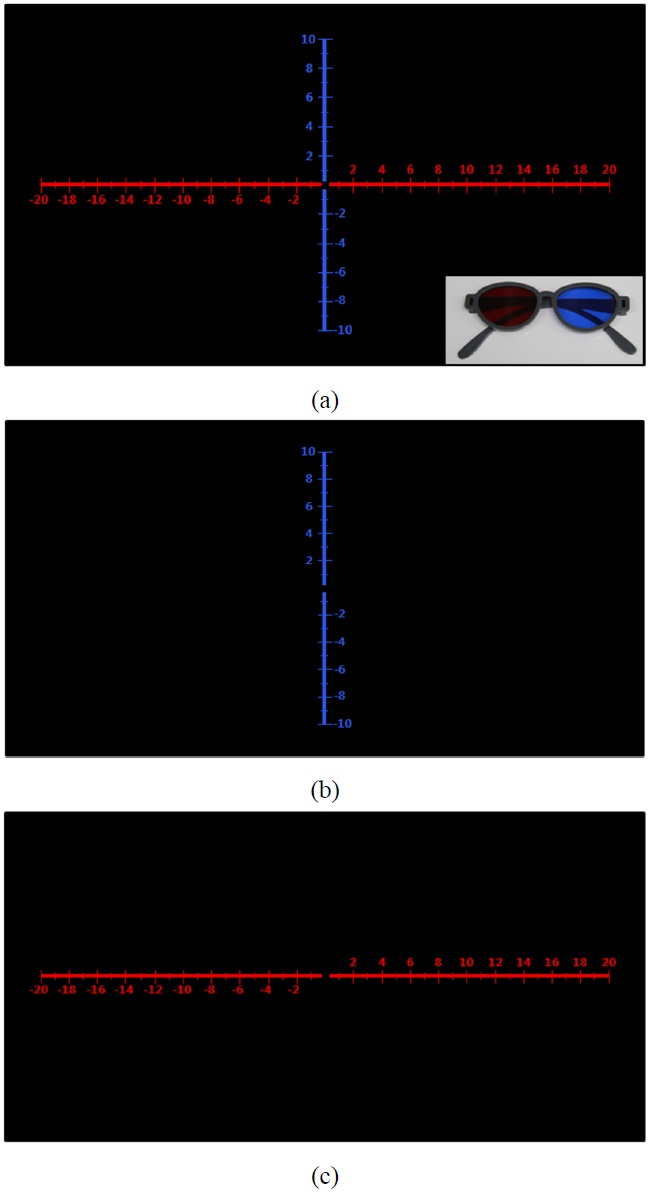
The new dichromatic phoria card for this test was named the red and blue phoria card (RBP card). The RBP card consists of a red horizontal line and a blue vertical line with scales of numbers graduated by 1 Δ at 40 cm on a black background (Fig. 1). The intersection of blue and red lines was zero. On the right of the red line and top of the blue line positive numbers were printed, and on the left of the red line and the bottom of the blue line negative numbers were printed. Wearing a blue filter over the eyes, the red horizontal line on the card was hardly distinguishable from the black background but the blue vertical line was clearly visible. Conversely, wearing a red filter over the eyes, the blue vertical line on the card was hardly distinguishable from the black background but the red horizontal line was clearly visible. The RBP card was held at 40 cm from the subjects by the examiner. Subjects wore red (right) and blue (left) filter glasses, a red line was shown in the subject’s right eye and a blue line was shown in the left eye. The examiner placed the occluder over the right eye and subjects were instructed to keep the numbers of the blue line clear at all times. While the examiner performed an alternating cover technique continuously (1 cycle per second) subjects were asked to instantaneously report the number on the red line at the point of intersection with the blue line. The blue line intersected on the positive

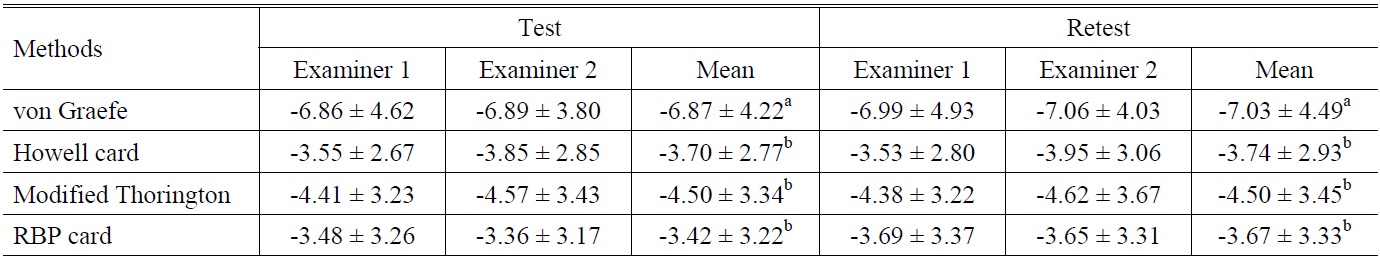
Mean ± standard deviation for the phoria tests for each examiner and the mean of the two examiners (n=109)
number of the red line indicated an exophoria while intersection on the negative number of the red line indicated esophoria.
2.5. RBP Card Test ? Auto-flashed Presentation
The auto-flashed version of a RBP card was made by PowerPoint 2007 (Microsoft Co., Redmond, USA), which displayed a blue vertical line and a red horizontal line alternately (1 cycle per second) on a computer monitor. The procedure of the test was equal to RBP card-flashed presentation with the exception of the examiner’s alternating cover technique.
Data analysis was performed with MedCalcTM (Med-Calc Software, Maria Kerke, Belgium) using a Bland and Altman plot [13] to assess the level of agreement between examiners and between test-retest. The mean difference, the standard deviation (S.D.), and the 95% limits of agreement (the lower and upper limits of agreement = ±1.96 × S.D. of mean difference) were determined. The reliability of averages of k ratings was estimated by intraclass correlation coefficient (ICC). Descriptive statistic, paired t-test, and one-way ANOVA test were performed in a 95% confidence level with SPSS for windows (SPSS Inc., Chicago, USA).
For each examiner, mean and standard deviation for each phoria test are given in Table 1. Positive and negative values represent esophoria and exophoria respectively. The mean by the von Graefe method was significantly the highest exophoria (p<0.05), then followed by the modified Thorington test, Howell card test, and RBP card test. The range of mean exophoria was between 6.87 Δ / 7.03 Δ (test / retest) by the von Graefe method and 3.42 Δ / 3.67 Δ by RBP card test with all tests. Inter-examiner difference was not significant statistically in each method.
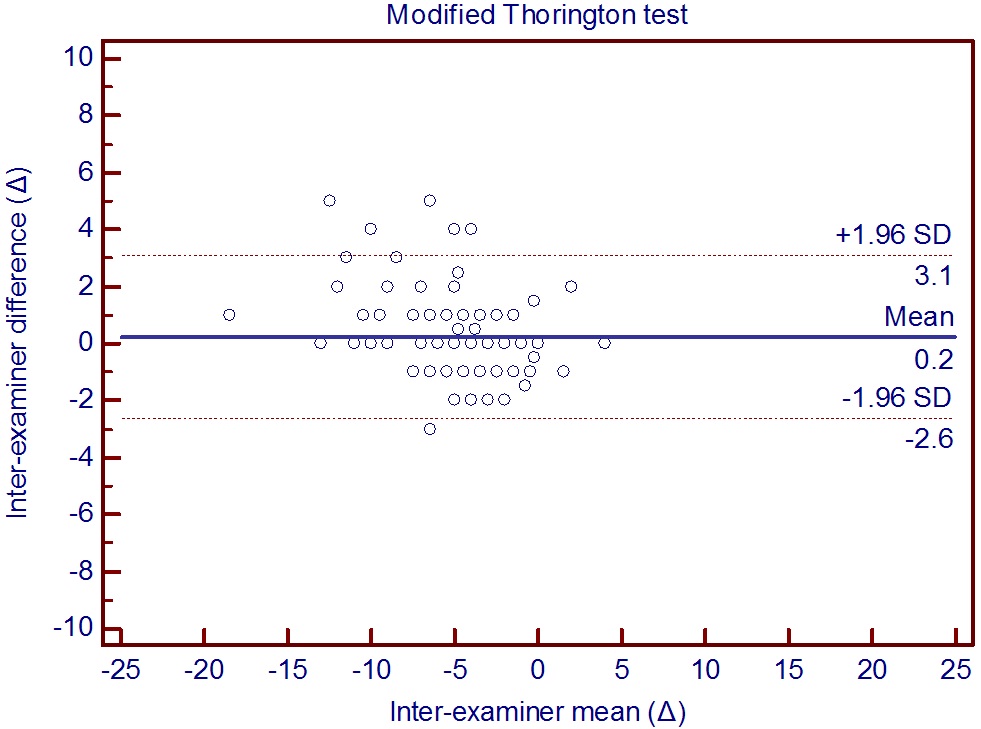
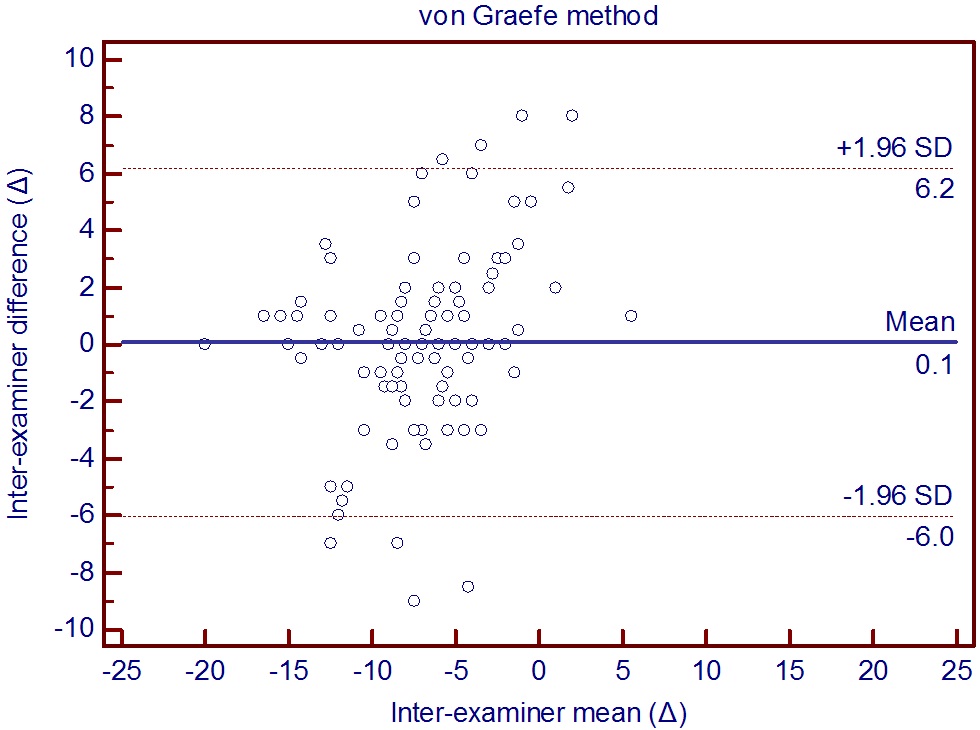
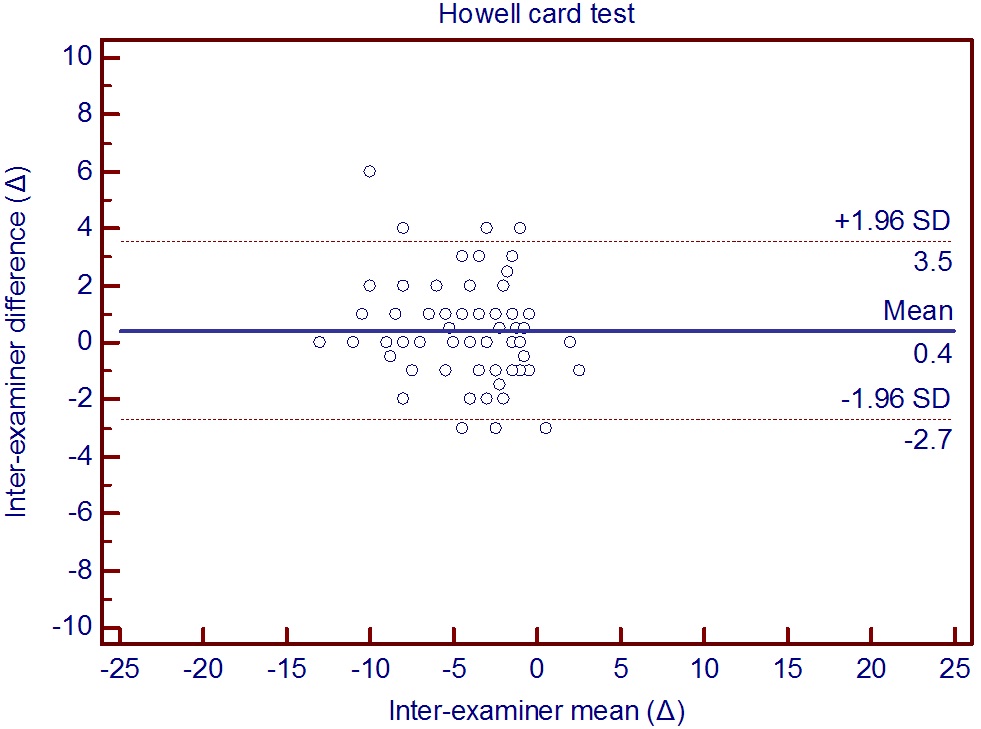
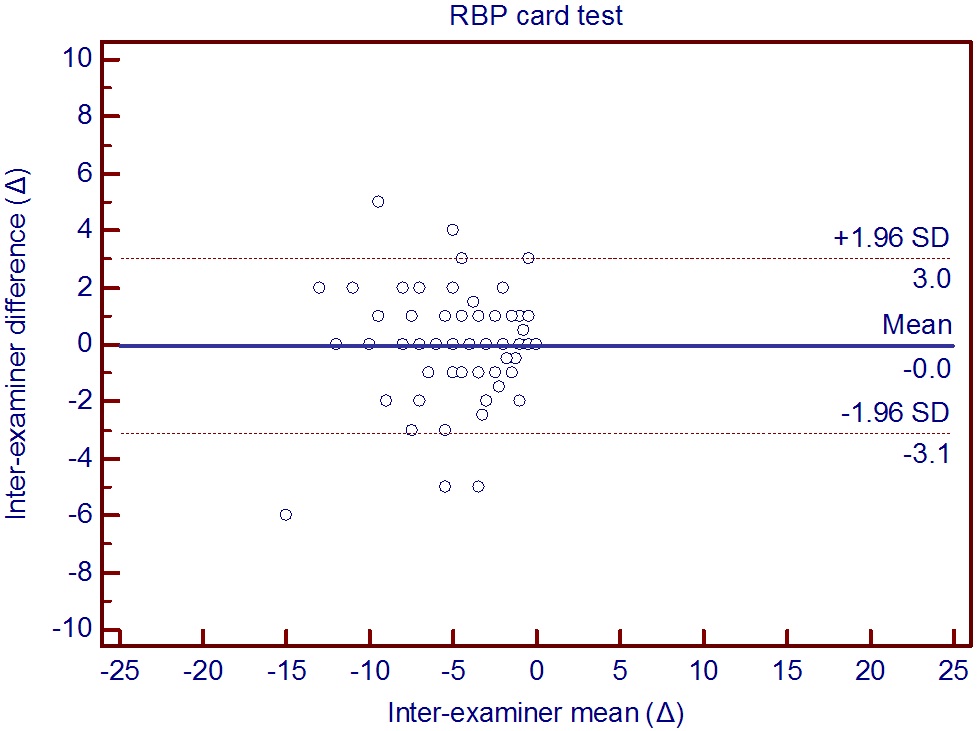
Bland and Altman recommended calculating the mean difference and 95% limits of agreement between examiners as the most appropriate indication of inter-examiner test repeatability. Mean difference comparisons are represented in the scatterplots of Fig. 2 through 5. The figures were constructed by plotting the mean phoria of two examiners for each subject against the difference between the examiner results. Horizontal lines are drawn at the mean difference, and the dashed lines show 95% limits of agreement. The agreement limits were narrowest for the modified Thorington test calculated as ±2.9 Δ while the von Graefe method calculated as ±6.1 Δ had the widest agreement limits. The agreement limits of the RBP card test and the Howell card test were ±3.1 Δ.
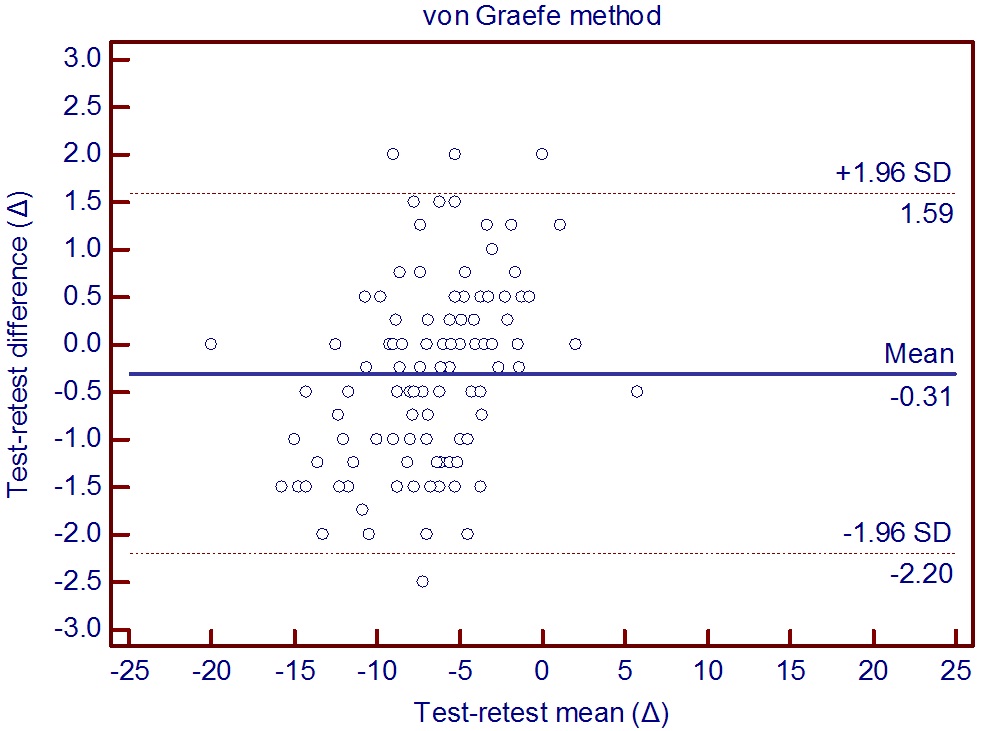
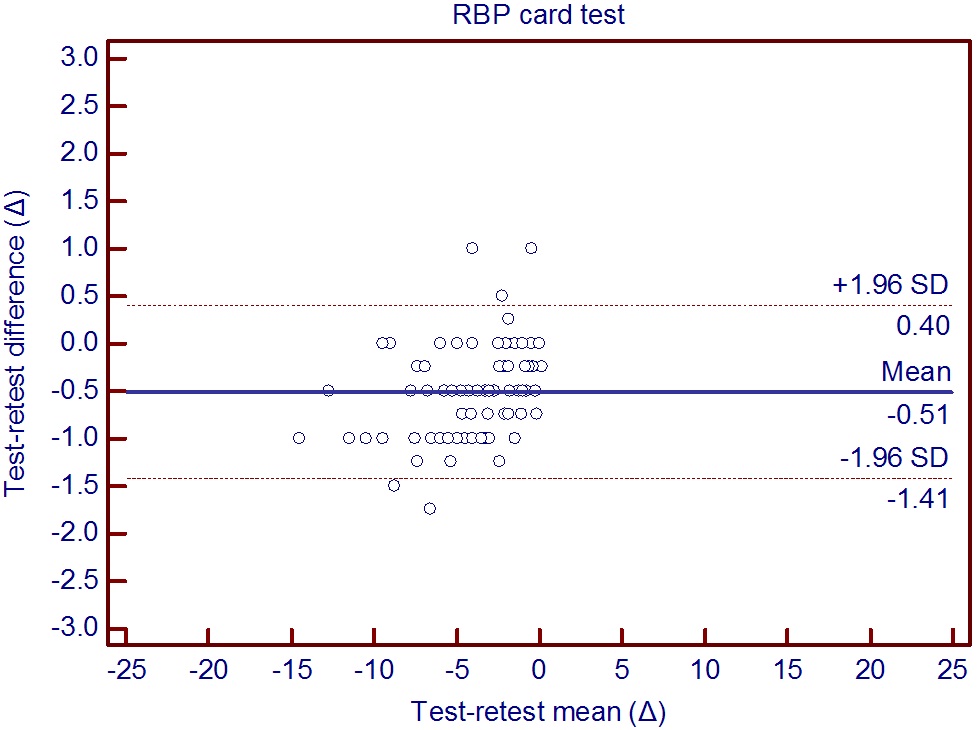
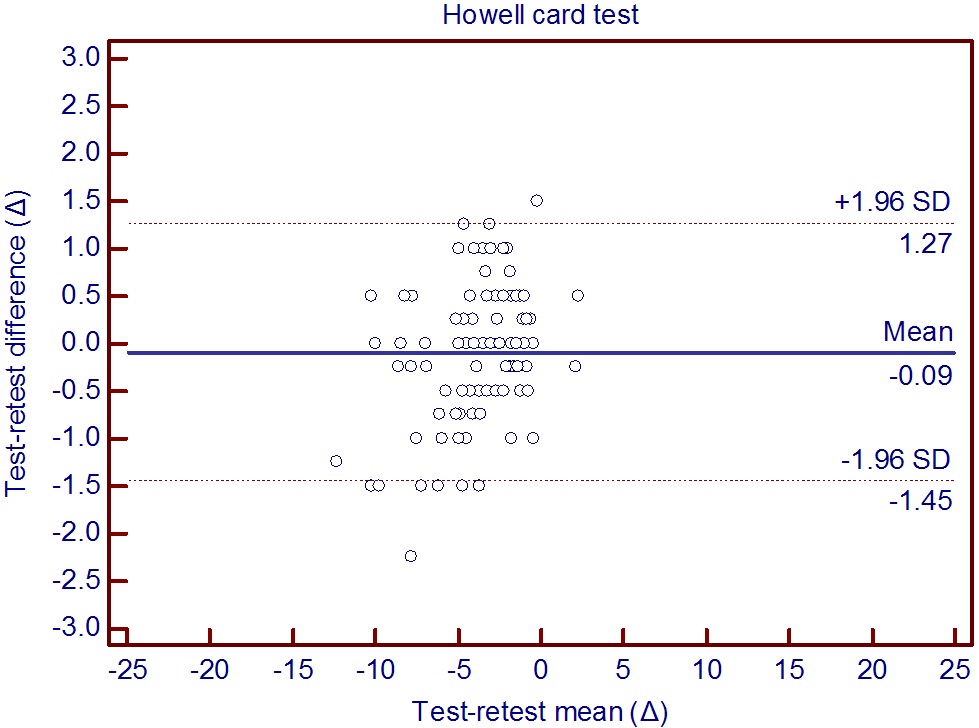
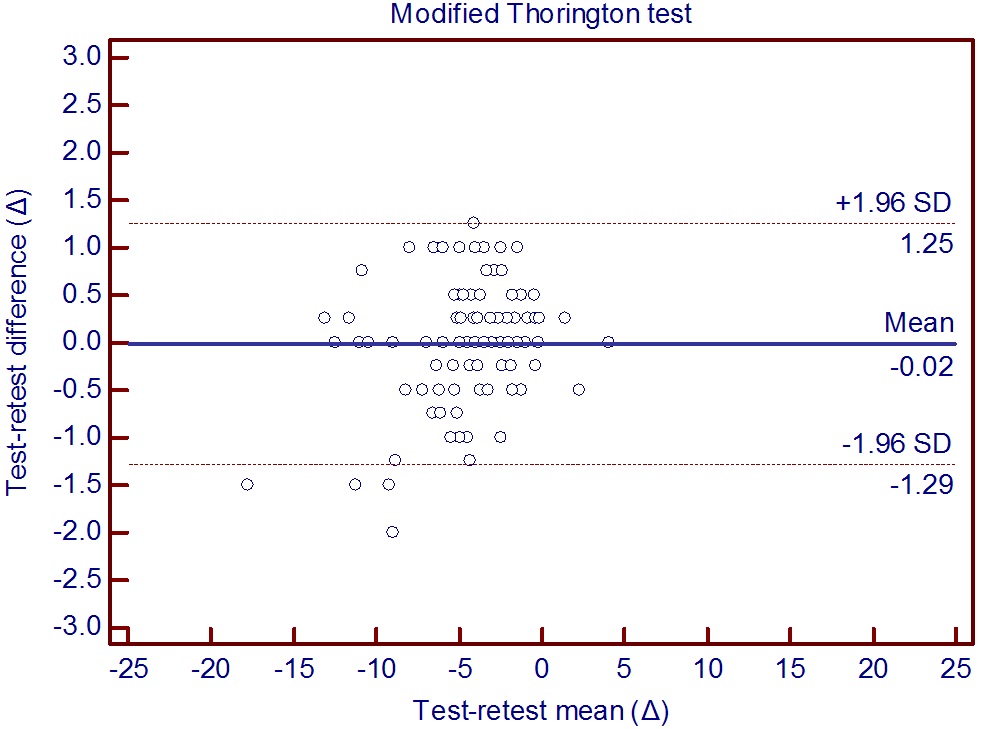
Figures 6 through 9 show the mean difference comparisons of test-retest repeatability in phoria. The test and
retest were performed by the same examiners and by the same procedure to the same subjects. Horizontal lines are drawn at the mean difference, and the dashed lines show 95% limits of agreement. The agreement limits were narrowest for the RBP card test calculated as ±0.91 Δ while the von Graefe method calculated as ±1.90 Δ had the widest agreement limits. The agreement limits of the modified Thorington test was ±1.27 Δ and the Howell card test was ±1.36 Δ.
Table 2 shows mean and standard deviation of phoria measurements, the reliability by ICC, and test-retest repeatability for the flashed presentation and the auto-flashed
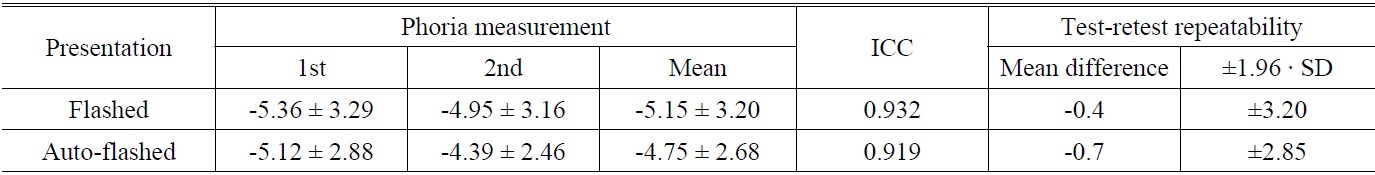
Mean ± standard deviation, ICC, and test-retest repeatability for flashed and auto-flashed presentation of RBP card test (n=26)
presentation of the RBP card test. The mean of the auto-flashed presentation was 4.75 Δ and the flashed presentation was 5.15 Δ. The ICC of the auto-flashed
presentation (0.919) was smaller than those of the flashed presentation (0.932), but the agreement limits of the auto -flashed presentation (±2.85 Δ) was narrower than those of the flashed presentation (±3.20 Δ).
Studies on the reliability and repeatability of measuring dissociated phoria have been conducted and methods of measuring dissociated phoria were varied and the results of reliability and repeatability were slightly different according to the researchers [1,6-11,14-19]. The reliability and repeatability of phoria measuring methods may be affected by several factors. Examiner and patient bias, instrument calibration, inconsistent testing technique or testing environment will result in variations among measurements [20,21]. The reliability of the near modified Thorington test is greater than those of the near von Graefe method according to results from Hirsch and Bing [11] and from Morris [22]. Morris suggested that the reliability of the von Graefe method is greater than those of the Maddox rod test. The 95% limits of agreement were 2.0 Δ or less for the near modified Thorington test, 2.5 to 3.3 Δ for the near von Graefe test, and 1.8 Δ to 4.6 Δ for the near Maddox rod test. Wong et al. [1] have documented that the Howell phoria card continuous presentation and the MIM card (both continuous and flashed presentations) had significantly less validity in inter-examiner differences than the Howell phoria card flashed presentation and the von Graefe method. In results of inter-examiner repeatability of the heterophoria test from Rainey et al. [10], the modified Thorington test had the highest inter-examiner correlation, and the smallest 95% limits of agreement, suggesting it was the most repeatable of the methods evaluated. The subjective cover test also had a high correlation and a small 95% limits of agreement range [10]. The repeatability of the distance Howell card test is greater than that of the distance von Graefe method and distance modified Thorington test [11].
This experimental result was similar to that of a previously published study [17], the von Graefe method had the highest mean phoria and the RBP card test had the smallest mean phoria. The von Graefe method had the highest mean deviation and the Howell card test had the smallest mean deviation. The variation in inter-examiner repeatability, the 95% limits of agreement (upper limit/ lower limit), exhibited the widest variation for the von Graefe method (+6.2/-6.0) and showed the narrowest variation for the modified Thorington test (+3.1/-2.6). In the Howell card test (+3.5/-2.7) and the RBP card test (+3.0/-3.1), the variation of two tests was similar practically. The variation in test-retest repeatability, the 95% limits of agreement showed the widest variation for the von Graefe method (+1.6/-2.2) and the narrowest variation for the RBP card test (+0.4/-1.4). The modified Thorington test (+1.3/-1.3) was narrower than the Howell card test (+1.3/-1.5) in the variation. Results, in the 95% limits of agreement, show that the RBP card test is considered a repeatable method for phoria measurement and is a useful method clinically.
No current mobile or online applications available at this time provide any testing for phoria measurements. In the case of the RBP card test, if the alternating cover technique can be achieved without examiners, subjects can measure their phoria themselves by just wearing a red/blue filter, unlike the case of that the von Graefe method and the Howell card test require a prism lens and the modified Thorington test requires a Maddox rod for phoria measurement. The auto-flashed version of the RBP test showed flashed presentation automatically on a computer monitor not executed by an examiner but by the program. The mean of phoria measurement using the auto-flashed presentation was 0.4 Δ smaller than those of the flashed presentation test. With coefficients greater than 0.90, the reliability of phoria measurement is generally good [19]. Results that the ICC of average measures was 0.919 and the 95% limits of agreement was +2.1/-3.6 for the auto-flashed presentation of the test indicate the possibility of phoria testing in a mobile application or online using a RBP card.
A phoria test in optometric examination plays an important part in the diagnosis of patient symptoms such as blur, headache, eyestrain, or diplopia. In this study, a new phoria test using a flashed presentation with a RBP card was assessed as having a high repeatability and the auto-flashed version made by PowerPoint showed high reliability. Clinically, the new phoria test is a useful method and has potential application in mobile or online phoria measurement.