검색 전체 메뉴
PDF
맨 위로
OA 학술지
Refinements for the amplification and sequencing of red algal DNA barcode and RedToL phylogenetic markers: a summary of current primers, profiles and strategies
  • 비영리 CC BY-NC
  • 비영리 CC BY-NC
ABSTRACT
Refinements for the amplification and sequencing of red algal DNA barcode and RedToL phylogenetic markers: a summary of current primers, profiles and strategies
KEYWORD
DNA barcode , Florideophyceae , molecular markers , phylogeny , polymerase chain reaction , primers , RedToL
  • INTRODUCTION

    There can be little question that molecular techniques have radically altered the face of phycological research especially in the fields of biodiversity and systematics (Maggs et al. 2007). Whereas in the early years researchers focused strongly on two commonly used markers, viz., the plastid rbcL (Freshwater et al. 1994) and the nuclear small subunit rDNA (Bird et al. 1992, Ragan et al. 1994, Saunders and Kraft 1994), a number of alternative markers have been developed for use with red algae from the population to the highest taxonomic levels (see Maggs et al. 2007, Table 6.1, for a list). Of particular importance in this regard have been the recent large-scale DNA barcoding (iBOL: http://ibol.org) (Saunders 2005) and Red Algal Tree of Life initiatives (RedToL: http://dblab.rutgers.edu/ redtol/) (Vis et al. 2010). Both of these projects target a broader and more comprehensive taxonomic sampling than previous initiatives, challenging researchers to develop more universal amplification strategies for markers (e.g., Saunders and McDevit 2012). Not even widely used markers such as the nuclear SSU and large subunit rDNA (Harper and Saunders 2001b) or the plastid rbcL (Freshwater et al. 1994) have weathered these global initiatives without the need for refinement.

    In this review, we focus strictly on the primers, profiles and strategies for the PCR amplification of markers currently in use in our lab (for a review of current collection and DNA extraction protocols see Saunders and McDevit 2012). Being partners in both the DNA barcode and Red-

    ToL initiatives, we have been heavily involved in marker development and refinement to meet their respective objectives. As a result, numerous changes have been introduced to “tried and true” markers in an effort to improve universality.

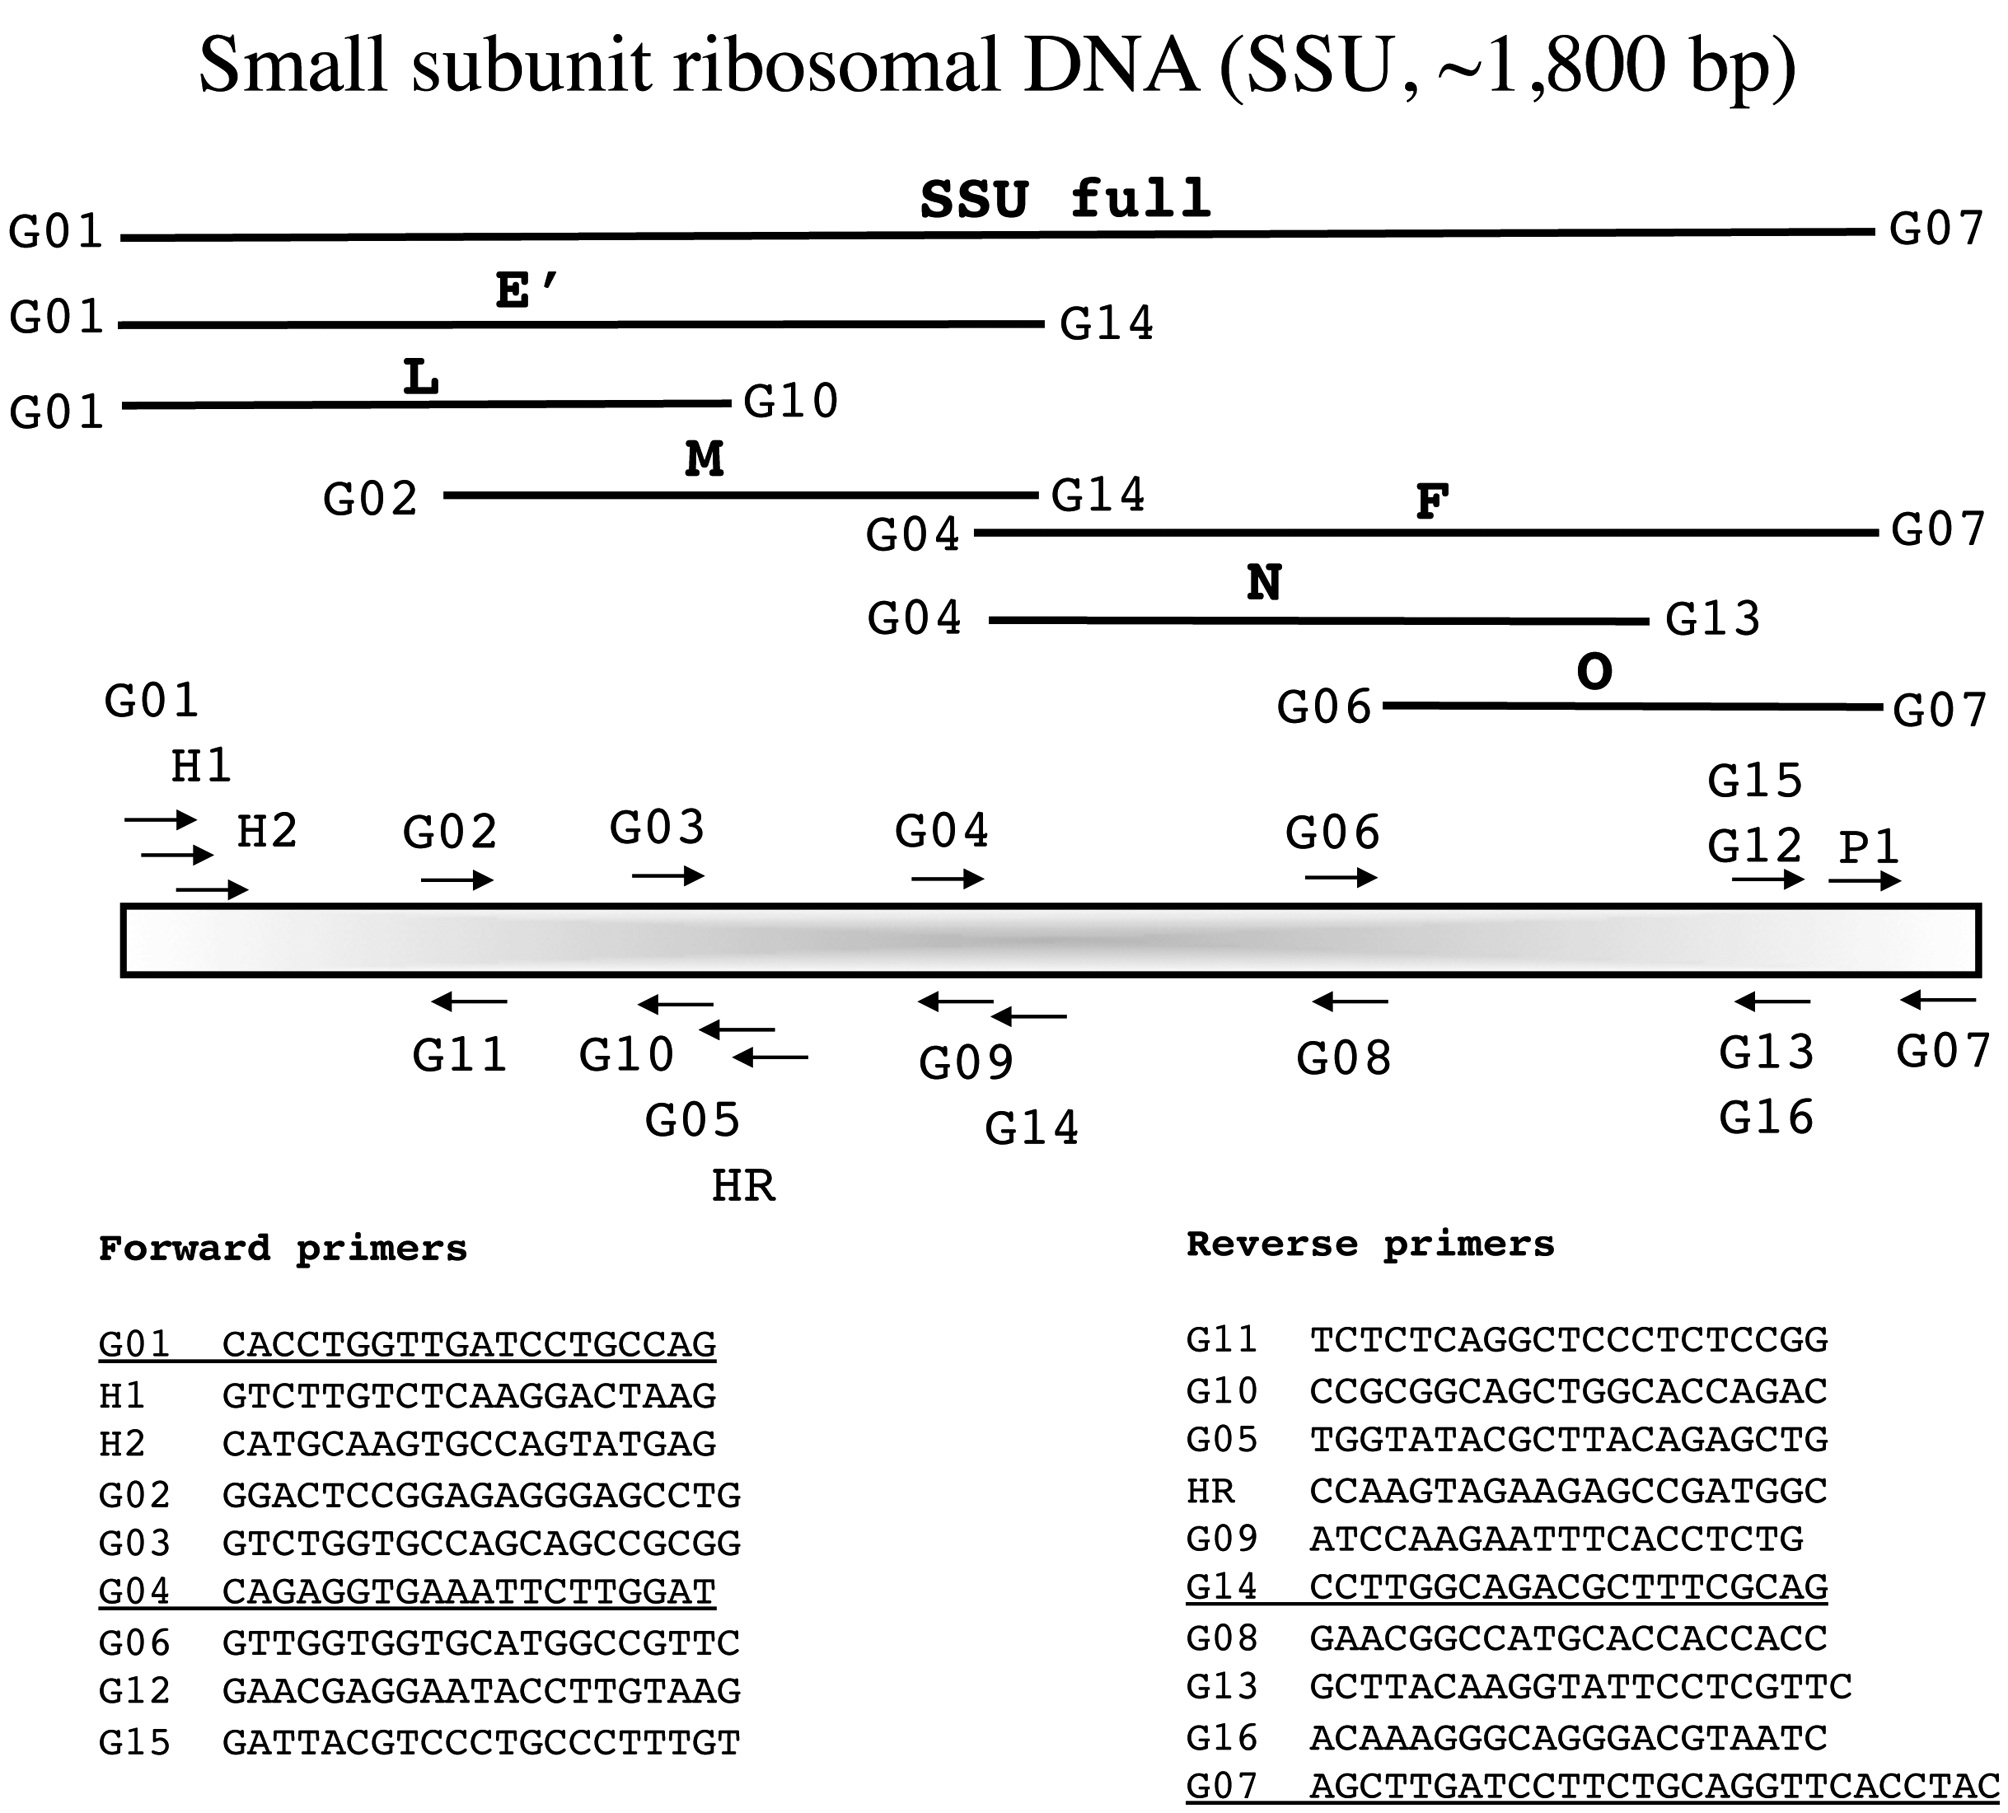
    In the following section each marker has a brief summary with a corresponding figure. We have tried to adhere to the same format for all figures?from top to bottom (examples refer to Fig. 1): marker name (e.g., small subunit ribosomal DNA), acronym (e.g., SSU), and approximate size (e.g., ~1,800 bp); a schematic of the fragment(s) typically amplified for each marker, their corresponding acronym / name and the primers used to amplify them when more than one fragment is an option (e.g., E', a fragment corresponding to the 5' end of the SSU is amplified with G01 and G14); a schematic showing the relative location of all primers along the marker (gene regions presented as wider boxes than adjacent spacers); and finally a listing of the actual PCR / sequencing primers. The typical primers used for PCR amplification are underlined for each marker, while M13 linkers and sequencing primers are indicated in bold italics type.

    NUCLEAR MARKERS

      >  Small subunit ribosomal DNA (SSU, ~1,800 bp)

    The SSU was widely used in early studies of red algal phylogenetics (e.g., Bird et al. 1992, Ragan et al. 1994, Saunders and Kraft 1994) and is still useful for exploring deeper relationships (e.g., West et al. 2008) with Harper and Saunders (2001b, Fig. 2a) providing a summary of PCR primers and profiles to that time. In the past it was typical to amplify this gene as four (L, M, N, O) fragments, but with improvements in PCR reagents over the years we now routinely amplify this gene as two fragments (E′, F) or as a single product (SSU full) (Fig. 1). The primers listed here remain unchanged from Harper and Saunders (2001b) and the specialty primers still serve the same purposes, viz., H1 or H2 replace G01 and HR replaces G10 for members of the Hildenbrandiales, in which fungal contamination (symbionts) is an issue, while G05 is a replacement for G10 in taxa for which the latter fails to give readable sequence data (Harper and Saunders 2001b). We no longer use all four internals to generate sequence data for the E’ fragment and simply use one of the forward (G02 or G03) and one of the reverse (G10 or G11) primers (Fig. 1). Similarly, for the F fragment we typically acquire internal sequence data only for G06 and G08, data for G12 (G15) and G13 (G16) usually not necessary to generate full bidirectional reads (Fig. 1).

    Amplification profile: 94℃ for 4 min; 38 cycles of 94℃for 30 s, 55℃ annealing for 30 s, 72℃ extension for 1 min 30 s; followed by 72℃ final extension for 7 min.

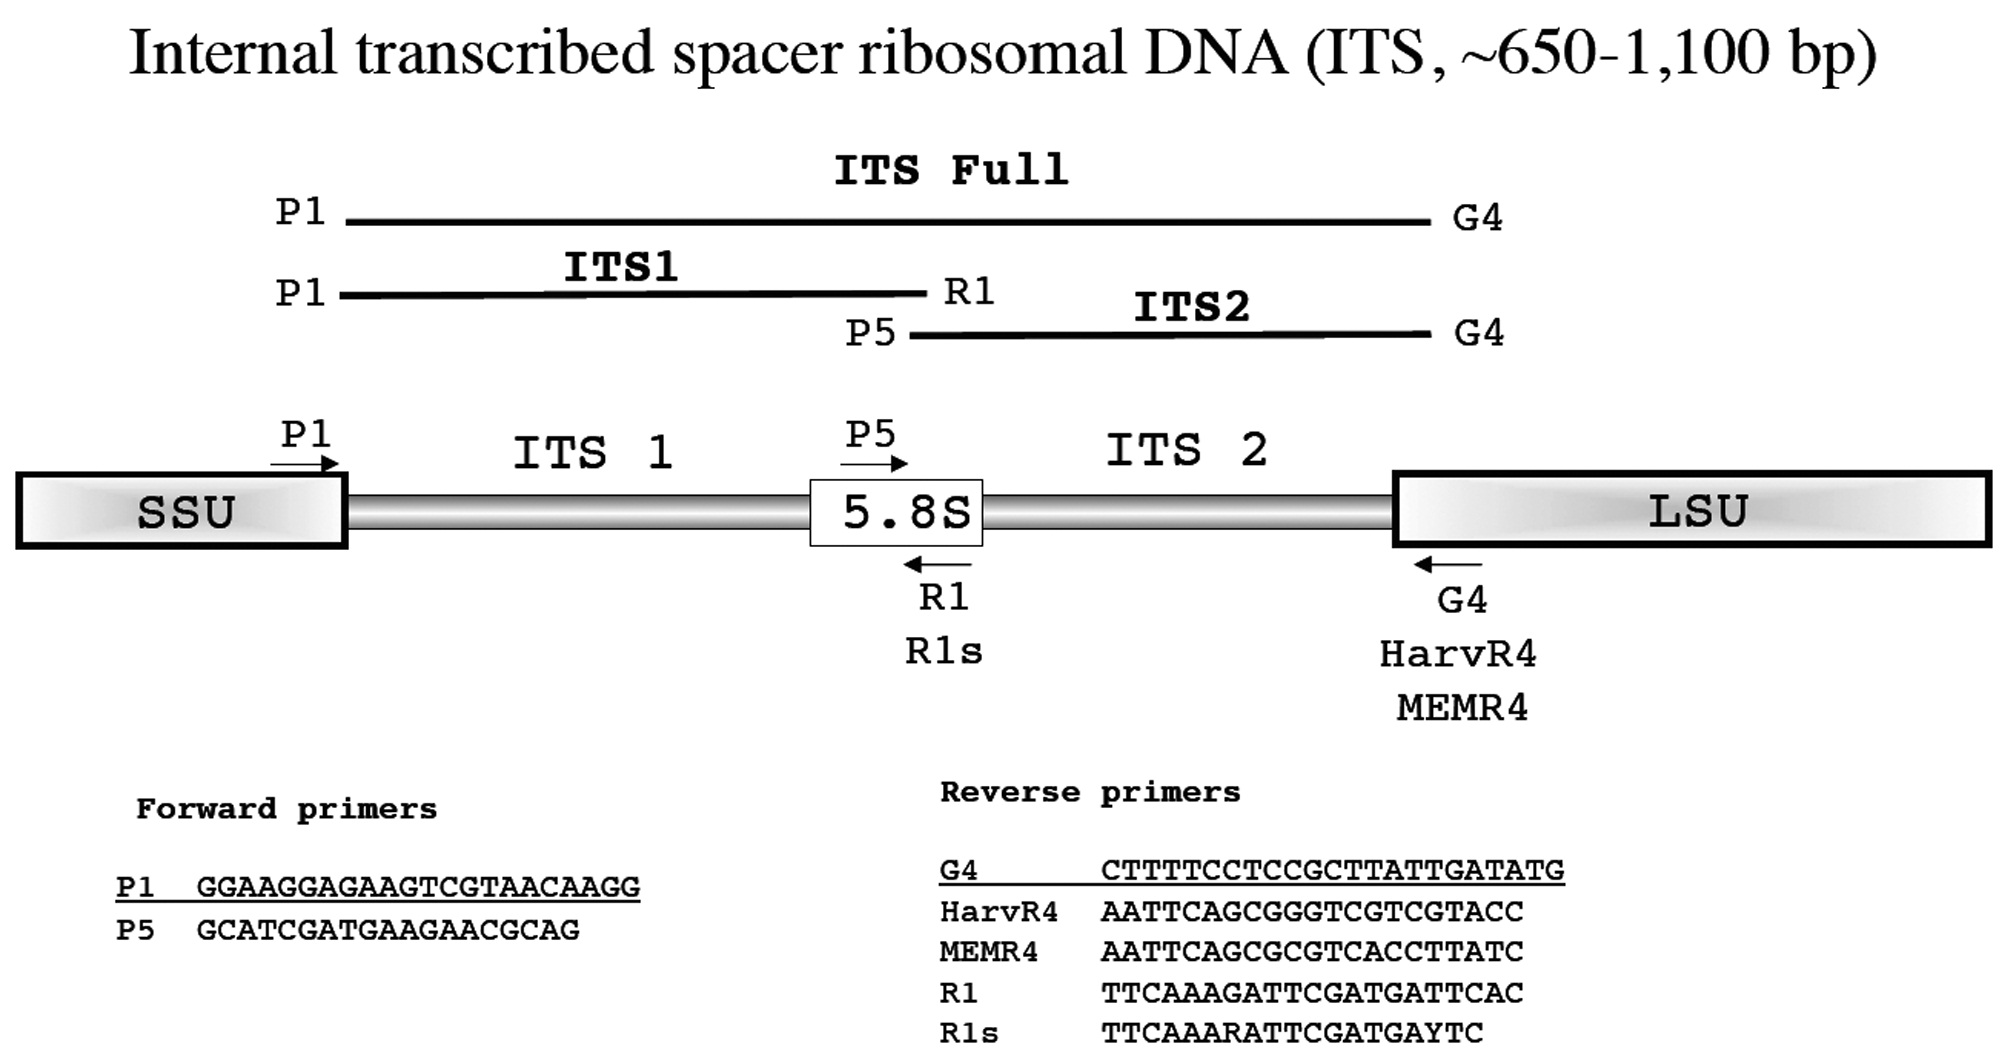
      >  Internal transcribed spacer ribosomal DNA (ITS, ~650-1,100 bp)

    First investigated for red algae by Steane et al. (1991), the ITS marker is useful for species discrimination and detecting hybridization, in some cases population level analyses, and for resolving relationships among closely related taxa. Our default methodological reference for ITS amplification is Tai et al. (2001) or, more recently, Saunders and McDevit (2012) with our overall scheme first summarized in Harper and Saunders (2001b, Fig. 2c, and references therein). We amplify the ITS typically as a single fragment with the standard primers P1 and G4 (Fig. 2), although it is easy to amplify the ITS1 (P1 and R1) or ITS2 (P5 and G4) individually. We have encountered problems in using R1 with some taxa (Corallinales) (see Hind and Saunders 2013) and have developed a slightly degenerate (more universal) version of this primer (R1s) (Fig. 2). Moving forward this modified primer will likely be used in routine applications. The primers P1 and G4 are relatively universal and work on a wide variety of eukaryotes, which can be useful when trying to generate ITS data from divergent lineages, but detrimental for use in species prone to biological infestation. For example, recently we had trouble acquiring clean ITS data for Membranoptera spp. (Wynne and Saunders 2012) necessitating development of the more specific MEMR4 to replace G4 and similarly HarvR4 for Neosiphonia (Savoie and Saunders unpublished). It is not unusual to have to develop primers to meet particular needs, a practice that occurs routinely in our laboratory (e.g., Druehl et al. 2005).

    Amplification profile: 94℃ for 2 min; 38 cycles of 94℃for 30 s, 50℃ annealing for 45 s, 72℃ extension for 2 min; followed by 72℃ final extension for 5 min.

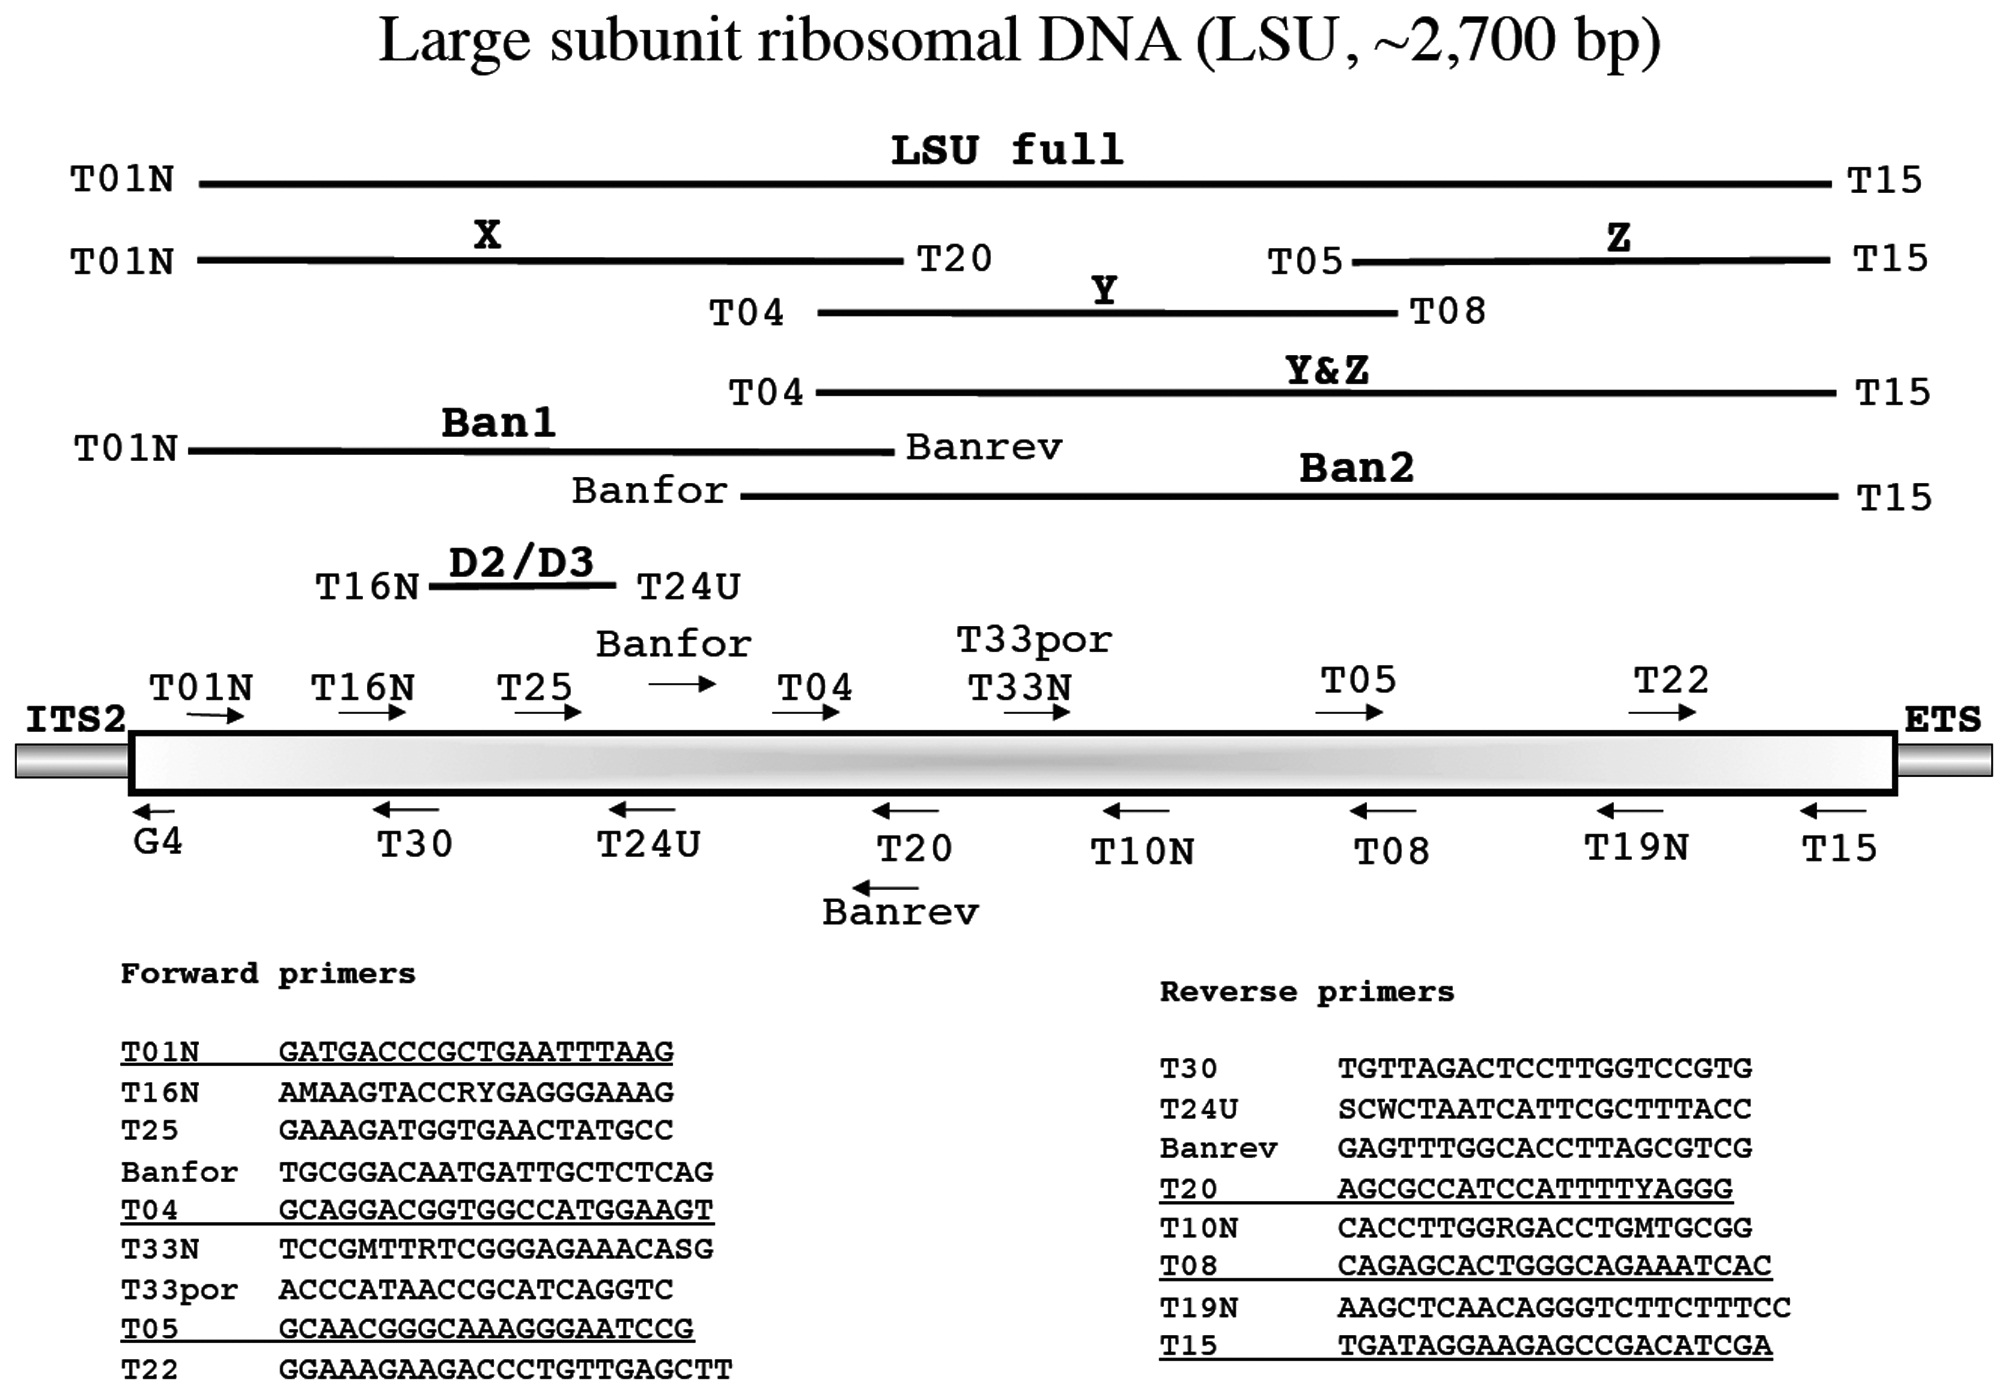
      >  Large subunit ribosomal DNA (LSU, ~2,700 bp)

    Freshwater and Bailey (1998) first used the LSU as a phylogenetic tool for red algae while Harper and Saunders (2001a) refined the marker by extending the portion of the gene that was amplified (summarized in Harper and Saunders 2001b, Fig. 2b). There have been a number of refinements since that time that have yet to be summarized in a review of this nature. Harper and Saunders

    (2001a) typically amplified the LSU as three fragments (X, Y, Z) (Fig. 3), but in recent years we commonly combine the Y and Z fragments into a single amplicon (Y & Z, primers T04 and T15) (Fig. 3) and at times even amplify the entire fragment as a single amplicon (LSU full, primers T01N and T15) (Fig. 3). Occasionally a fragment is from a contaminant rather than target and we circumvent this problem by using other primer combinations (e.g., if Y brings up a contaminant rather than target we may try T25-T08 or T04-T19N or T04-T10N plus T33NT08, etc.). More substantially, there have been a few key improvements to the primers in use since the publication of this system. The following fundamental changes to the scheme of Harper and Saunders (2001a) have been implemented over the years in a variety of manuscripts: T01N replacing T01; T10N replacing T10; T16N replacing T16; T19N replacing T19; T20 replacing T13 and T13N; T24U replacing T24; and T33N replacing T14 and T33 (Fig. 3). In all cases these primers, at times by slight changes in position and / or addition of degeneracy, have proven more universal in amplification and sequencing of LSU data from a variety of red algae than their predecessors. In addition, Le Gall and Saunders (2007) uncovered that an LSU generated for the Bangiales (Harper and Saunders 2001a) was in fact from a contaminant. They devised a strategy for these taxa amplifying the LSU as two overlapping fragments with TO1N-Banrev and Banfor-T15 (Ban1 and Ban2, respectively) (Fig. 3). Not included here are a series of specific primers to enable sequencing through a relatively large insert in the Z fragment of some Nemaliales (Huisman et al. 2004) and to amplify specifically the LSU of representative Palmariaceae and Rhodophysemataceae from mixed host plus epi-endophyte DNA extractions (Clayden and Saunders 2010). We also include the D2/D3 region being promoted as a secondary DNA barcode marker and indicate the location and primers for this fragment (Saunders and McDevit 2012).

    Amplification profile: 94℃ for 5 min; 38 cycles of 94℃for 30 s, 50℃ annealing for 30 s, 72℃ extension for 2 min; followed by 72℃ final extension for 7 min.

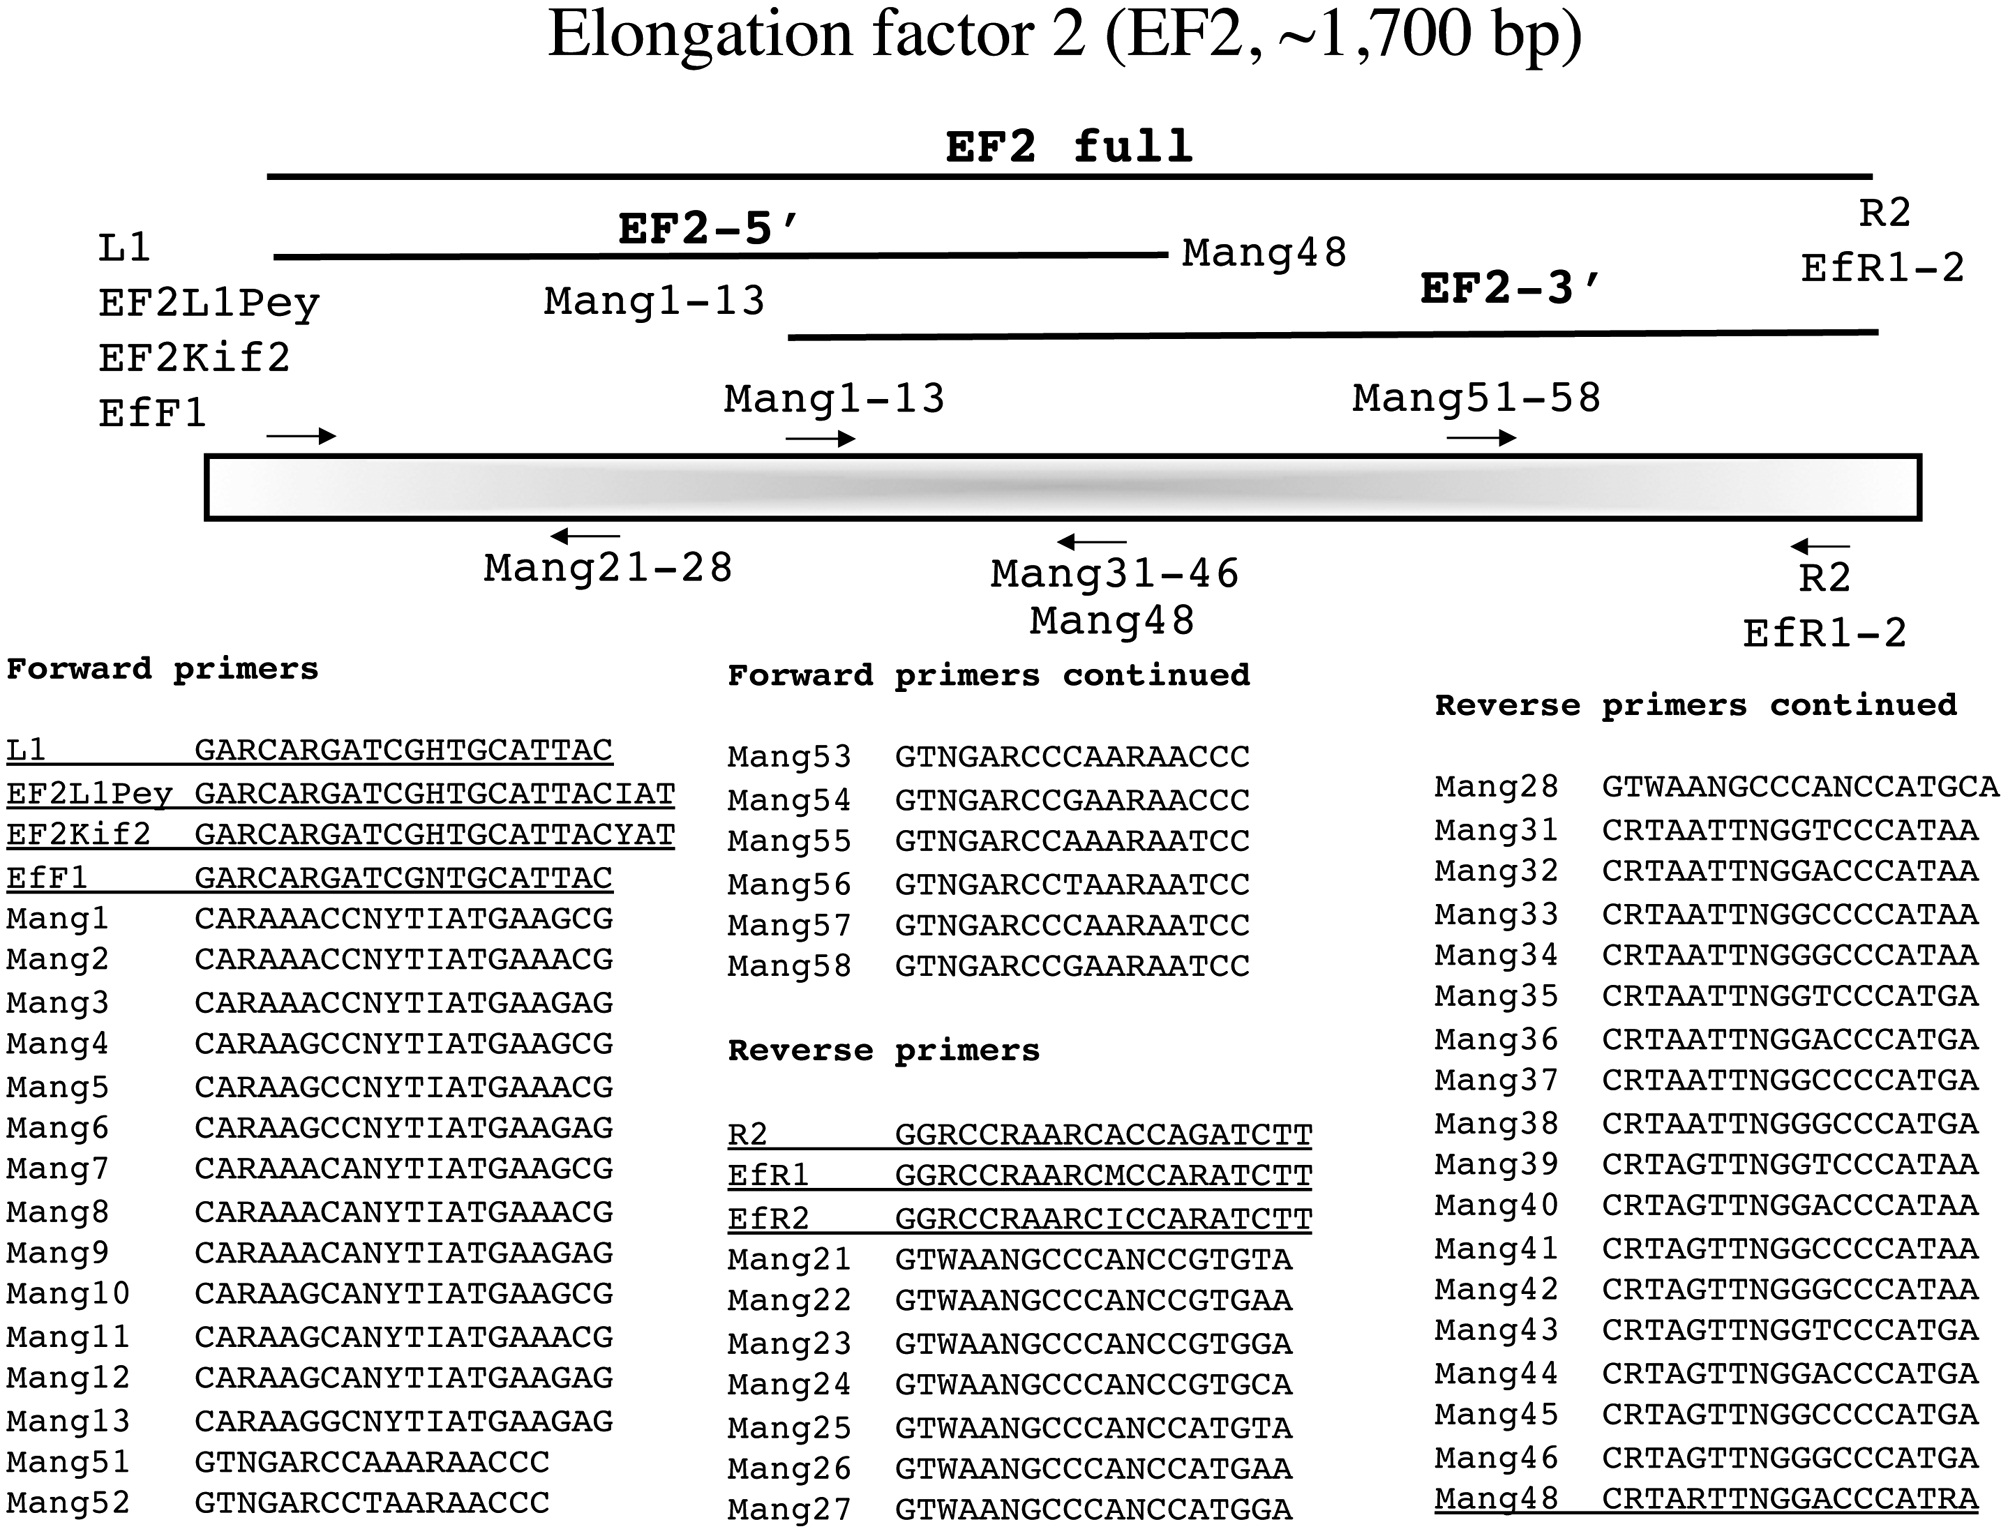
      >  Elongation factor 2 (EF2, ~1,700 bp)

    Le Gall and Saunders (2007) championed EF2 as a phylogenetic marker for red algae in a survey of Florideophyceae. In that study this region was amplified as a single product ~1,700 bp in length or as two shorter overlapping fragments (Le Gall and Saunders 2007, Fig. 1). In pursuing this marker for additional taxa we have had mixed success for both amplification with their external PCR, as well as for sequencing with their internal primers, and it is not uncommon for species within a genus to require different primers. This has resulted in numerous, ongoing modifications to the original system. We currently amplify the entire fragment trialing combinations of external forward and reverse PCR primers to find the combination that works best for a sample (Fig. 4). Typically the original L1 or the modified EF2L1Pey work in combination with R2 or the modified EfR1 (trial progression for an isolate moves from L1-R2 then EF2L1Pey-EfR1 then Ef2Kif2- EfR1). Recently we have attempted to acquire EF2 from difficult taxa by amplifying the various forward primers against the internal reverse primer Mang48 to acquire an EF2-5' fragment (Fig. 4). We then sequence with the external PCR primers and use those data to identify the best internal forward primer from the Mang1-13 series to use against our external reverse PCR primers to amplify the EF2-3' fragment (Fig. 4). In all cases, we sequence with the PCR primers and use those data to select the best internal sequencing primers from the forward series Mang1-13 and Mang51-58 and from the reverse series Mang21-28 and Mang31-46 (Fig. 4).

    Amplification profile for full fragment: 94℃ for 4 min; 38 cycles of 94℃ for 1 min, 50℃ annealing for 1 min, 72℃extension for 2 min; followed by 72℃ final extension for 7 min.

    Amplification profile for two subfragments: 94℃ for 4 min; 38 cycles of 94℃ for 1 min, 58℃ annealing for 1 min, 72℃ extension for 2 min; followed by 72℃ final extension for 7 min.

    PLASTID MARKERS

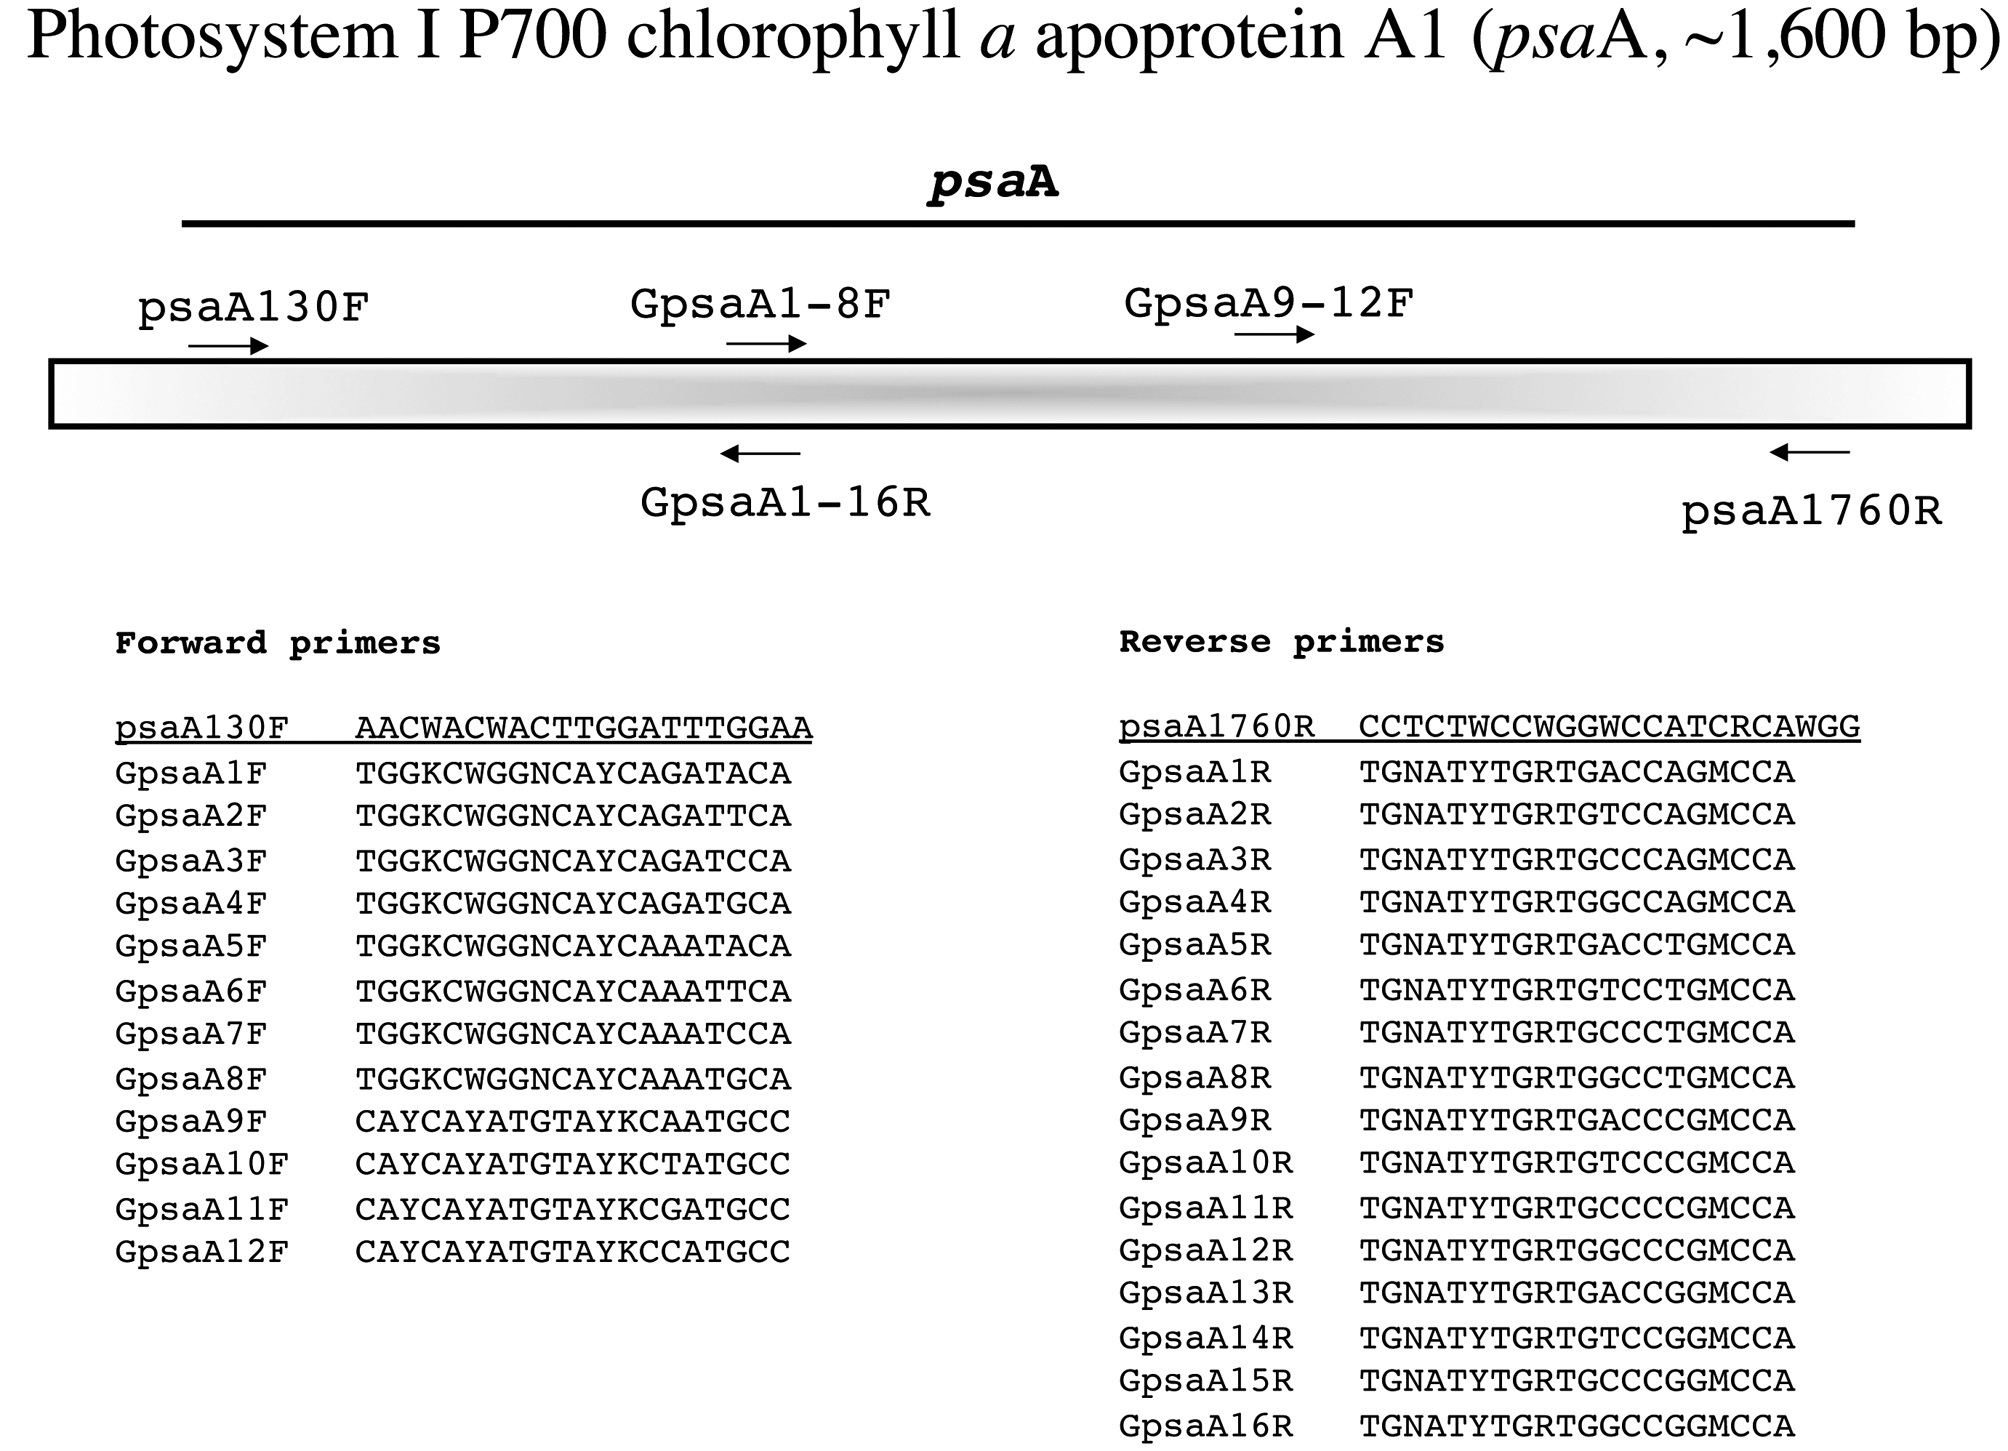
      >  Photosystem I P700 chlorophyll a apoprotein A1 (psaA, ~1,600 bp)

    Yoon et al. (2002) devised an amplification strategy for psaA and we use their external PCR primers to amplify this marker as a single fragment (Fig. 5). These primers have not worked for all taxonomic groups that we have trialed and further primer development is necessary. Owing to the highly variable nature of this marker, we have again developed a series of internal forward, GpsaA1-8F and GpsaA9-12F, and reverse, GpsaA1-16R, primers that we select after consideration of sequence data from the external PCR primers (Fig. 5).

    Amplification profile: 94℃ for 2 min; 5 cycles of 94℃for 30 s, 45℃ annealing for 30 s, 72℃ extension for 1 min; then 35 cycles of 94℃ for 30 s, 46.5℃ annealing for 30 s,

    72℃ extension for 1 min; followed by 72℃ final extension for 7 min.

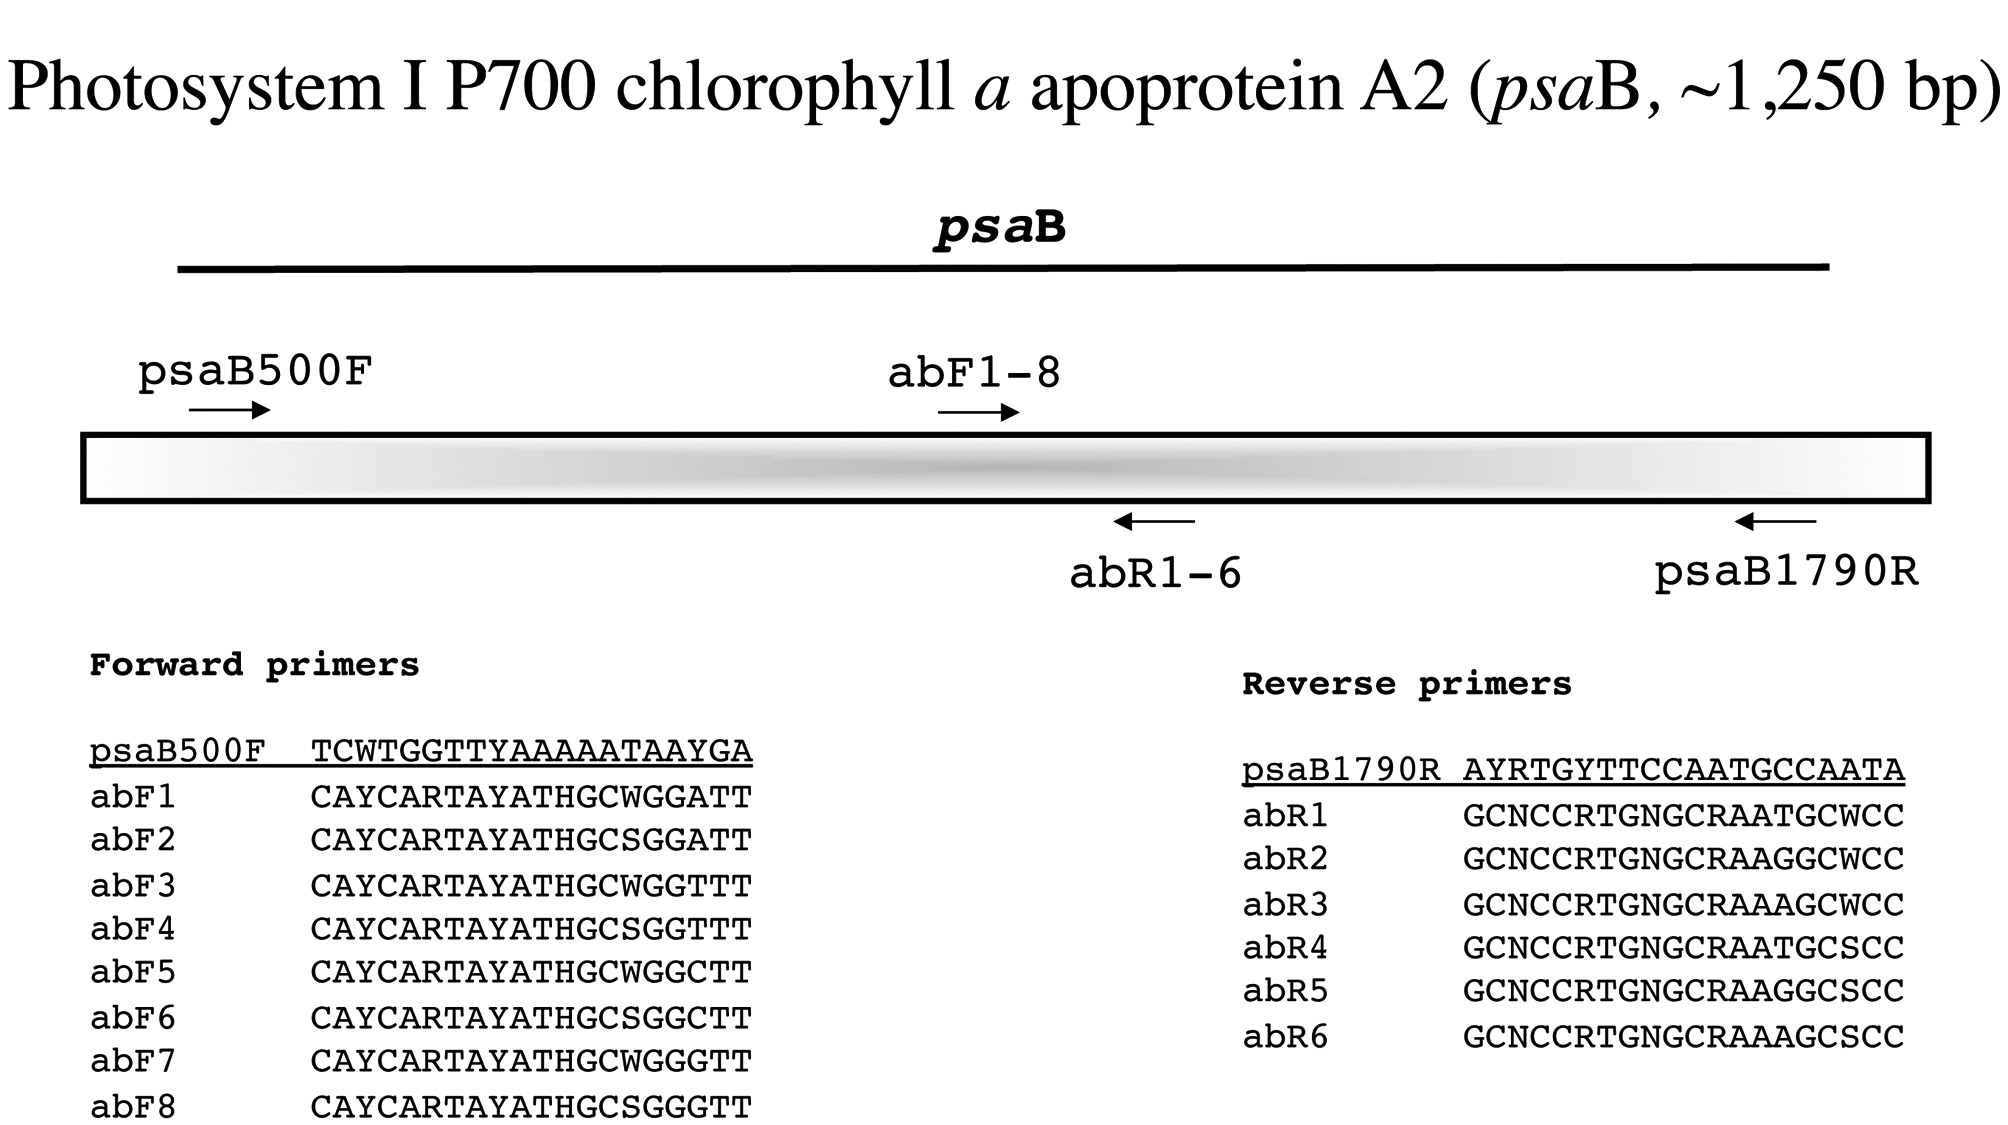
      >  Photosystem I P700 chlorophyll a apoprotein A2 (psaB, ~1,250 bp)

    For this marker the external PCR primers are from Yoon et al. (2004) and again we amplify it as a single fragment (Fig. 6). As with the previous markers, we generate se-quence with the PCR primers and then identify the best internal forward and reverse primers from our newly developed series abF1-8 and abR1-6, respectively (Fig. 6).

    Amplification profile: 94℃ for 2 min; 5 cycles of 94℃for 30 s, 45℃ annealing for 30 s, 72℃ extension for 1 min; then 35 cycles of 94℃ for 30 s, 46.5℃ annealing for 30 s, 72℃ extension for 1 min; followed by 72℃ final extension for 7 min.

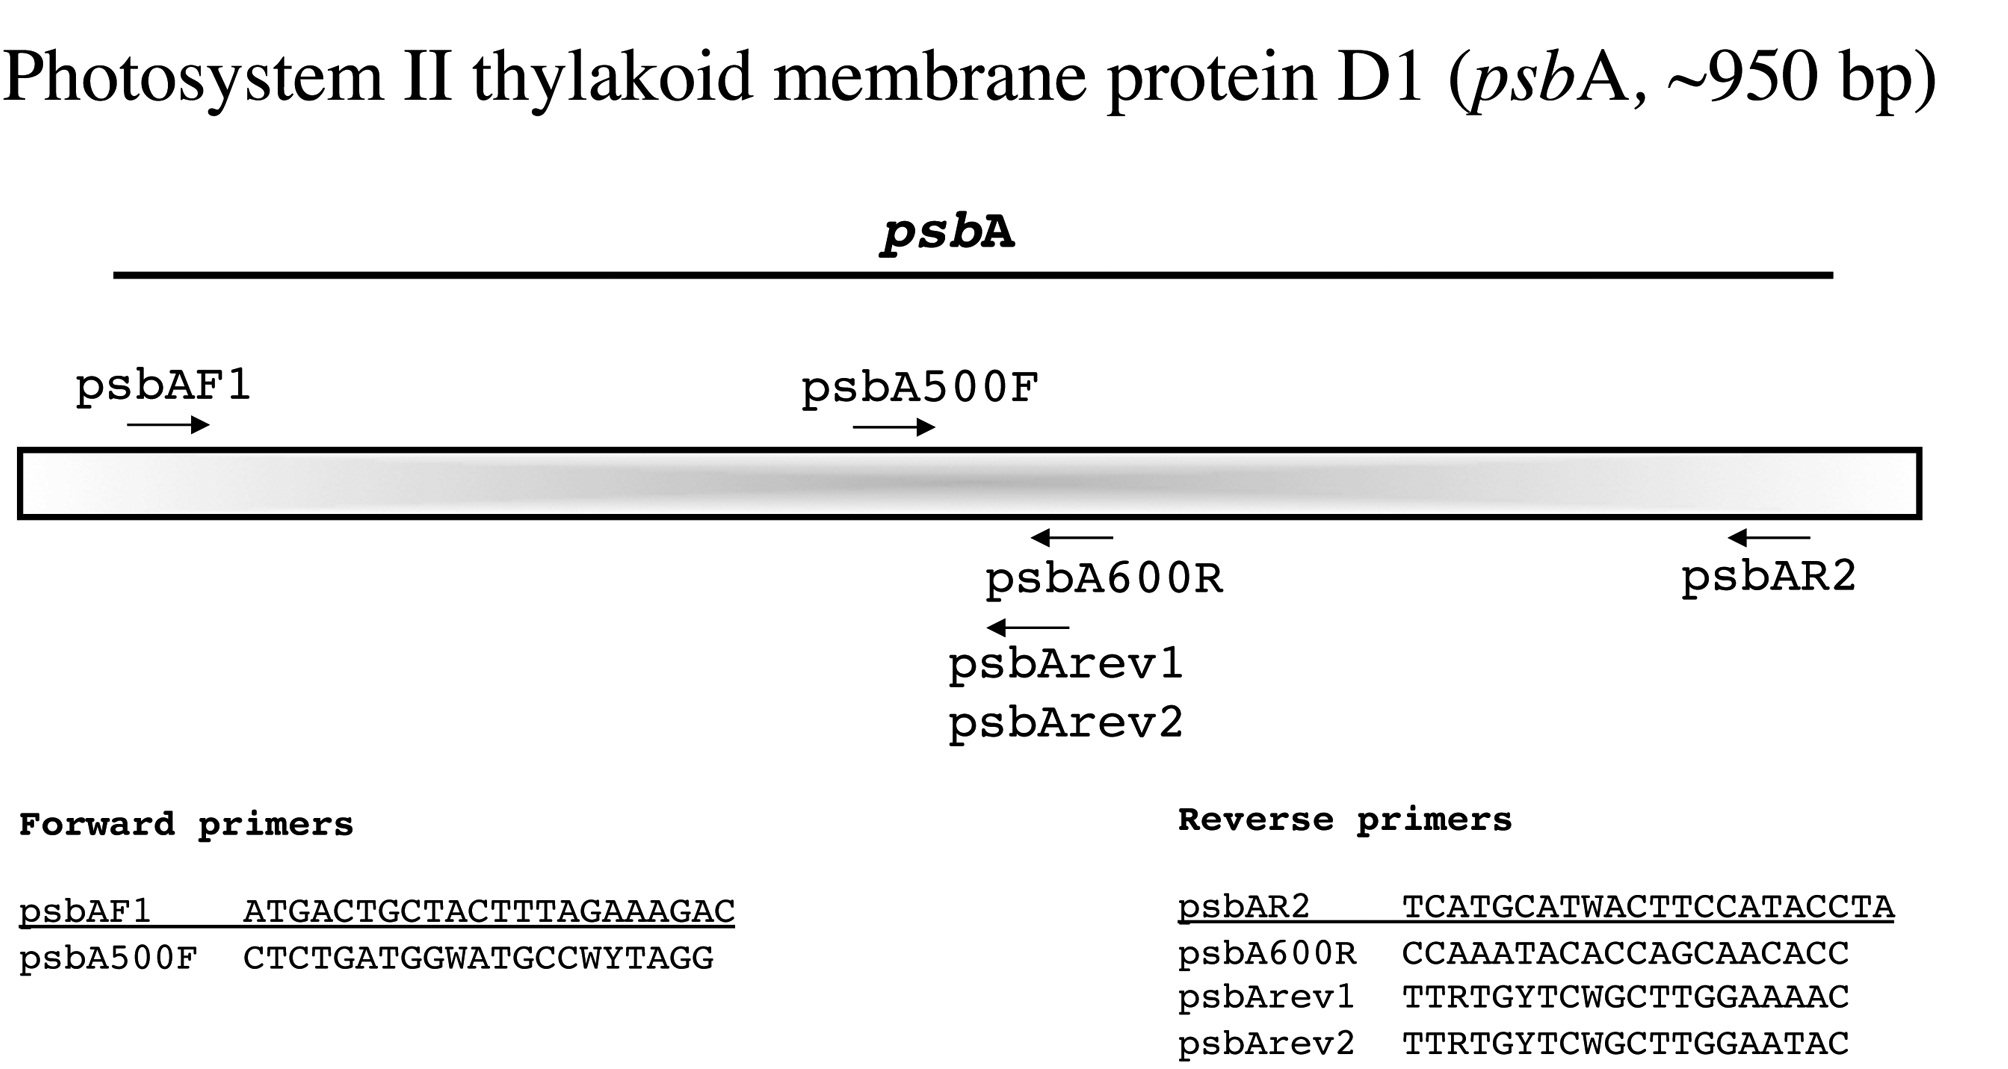
      >  Photosystem II thylakoid membrane protein D1 (psbA, ~950 bp)

    This is an easy marker to amplify with the two external PCR primers developed by Yoon et al. (2002) and works broadly among florideophyte algae (Fig. 7). While their (loc. cit.) internal forward sequencing primer psbA500F also works widely, we have had poor sequence for some taxa using the internal reverse primer psbA600R. We thus sequence with external primers first and then pick the best internal reverse option among psbA600R and the newly designed psbArev1 and psbArev2.

    Amplification profile: 94℃ for 2 min; 5 cycles of 94℃for 30 s, 45℃ annealing for 30 s, 72℃ extension for 1 min; then 35 cycles of 94℃ for 30 s, 46.5℃ annealing for 30 s, 72℃ extension for 1 min; followed by 72℃ final extension for 7 min.

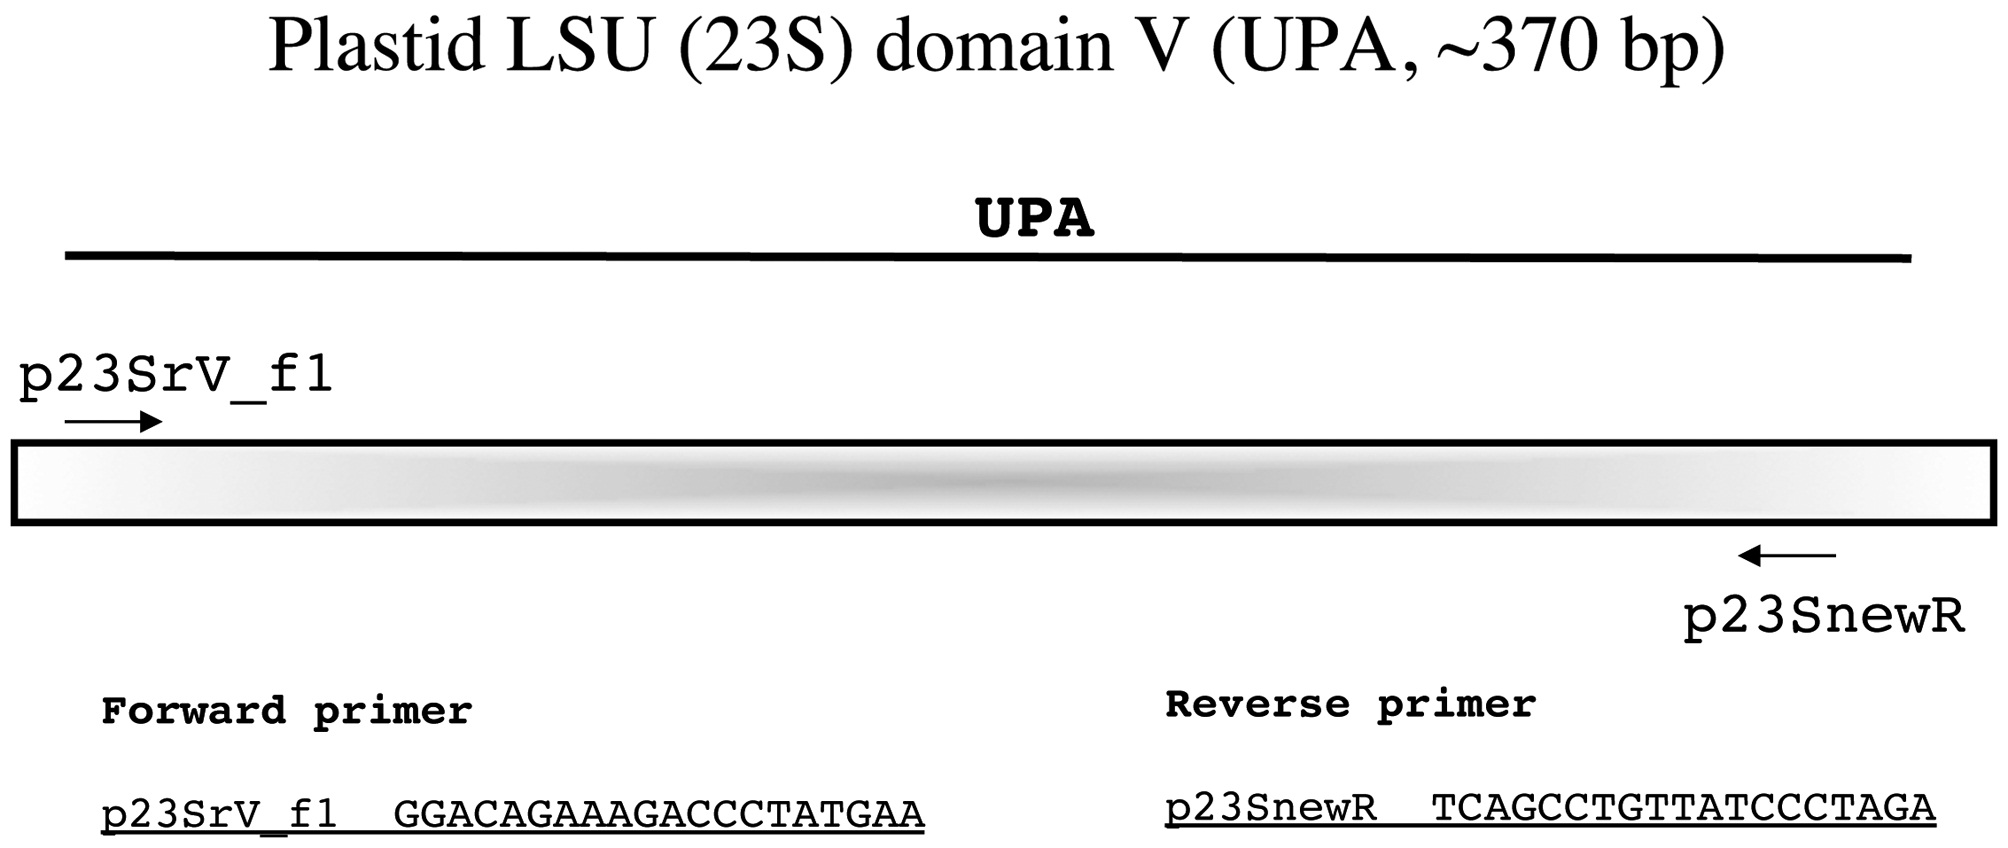
      >  Plastid LSU (23S) domain V (UPA, ~370 bp)

    Sherwood and Presting (2007) championed UPA as a universal barcode marker for the algae noting that a single primer pair can reliably recover sequences from a broad taxonomic range including green, red, and brown marine macroalgae, diatoms, and even cyanobacteria. Whereas we have had strong success with their forward primer p23SrV_f1, the reverse primer p23SrV_r1 can result in messy sequence data for some florideophytes. Clarkston and Saunders (2010) reasoned that a repeat near the 3' end of this primer (AGAG) was the cause of this problem and dropped the final nucleotide in designing the modified primer p23SnewR (Fig. 8). We have found this an easily amplified marker from a wide variety of florideophytes with this modification. Being a short marker, no internal primers are necessary to generate full bidirectional reads (Fig. 8).

    Amplification profile: 94℃ for 2 min; 35 cycles of 94℃for 20 s, 55℃ annealing for 30 s, 72℃ extension for 30 s; followed by 72℃ final extension for 10 min.

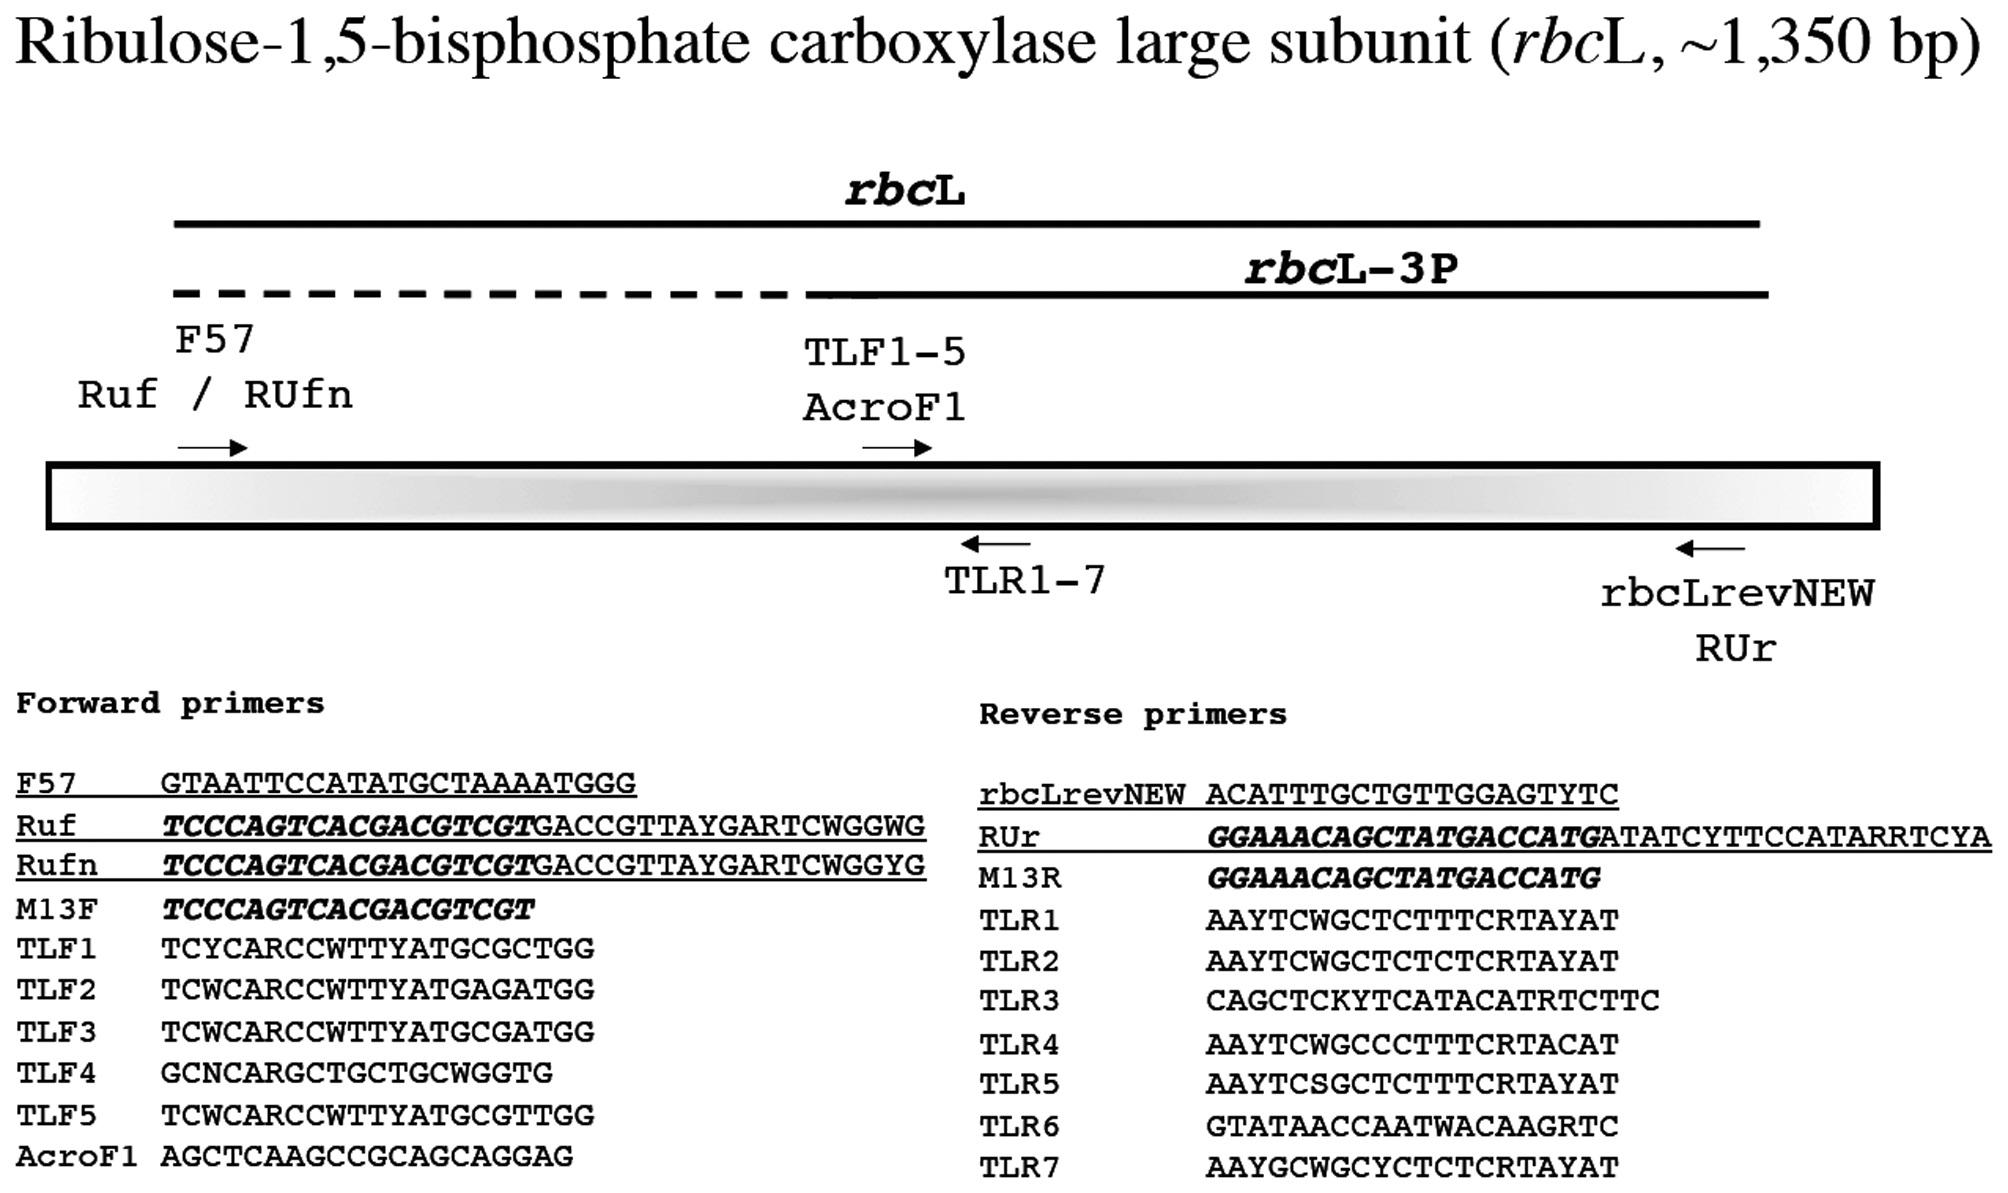
      >  Ribulose-1,5-bisphosphate carboxylase large subunit (rbcL, ~1,350 bp)

    This marker is widely used in florideophyte phylogenetic and barcoding studies and was first applied broadly to these algae by Freshwater et al. (1994). We still routinely use the forward PCR primer F57 (Freshwater and Rueness 1994), but also trial the M13-linked Ruf and RUfn for problematic taxa (Fig. 9). These last two primers are linked with one of the available M13 variants (note that the M13 variant here is different from that included below for COI-5P, but either should work; just make sure the M13 variants used for sequencing are a match for those employed in your primer). Thus sequencing employs only the linker portion of the primer when these are used in PCR (Fig. 9). We have also developed an M13 linked reverse primer (RUr), but typically find that our modification of Vis and Sheath’s (1999) rbcL R' (rbcLrevNEW) works for most red algae (Fig. 9). A key innovation here is to generate sequence data from the PCR primers and then identify the best internal primers from the forward and reverse series TLF1-5 (plus ACROF1) and TLR1-7, respectively (Fig. 9). This approach results in clean and full bidirectional reads for this marker allowing for the generation of quality sequences.

    We are using rbcL-3P (~785 bp) as a secondary DNA barcode marker (Fig. 9), however, owing to the lack of an internal “universal” primer, we amplify the entire fragment, sequence with the external reverse PCR primer and then use those data to identify the best internal forward primer (ACROF1, TLF1-5) to give a bidirectional read for only the 3' end of the marker.

    Amplification profile: 95℃ for 2 min; 35 cycles of 93℃for 1 min, 47℃ annealing for 1 min, 72℃ extension for 2 min; followed by 72℃ final extension for 2 min.

    MITOCHONDRIAL MARKERS

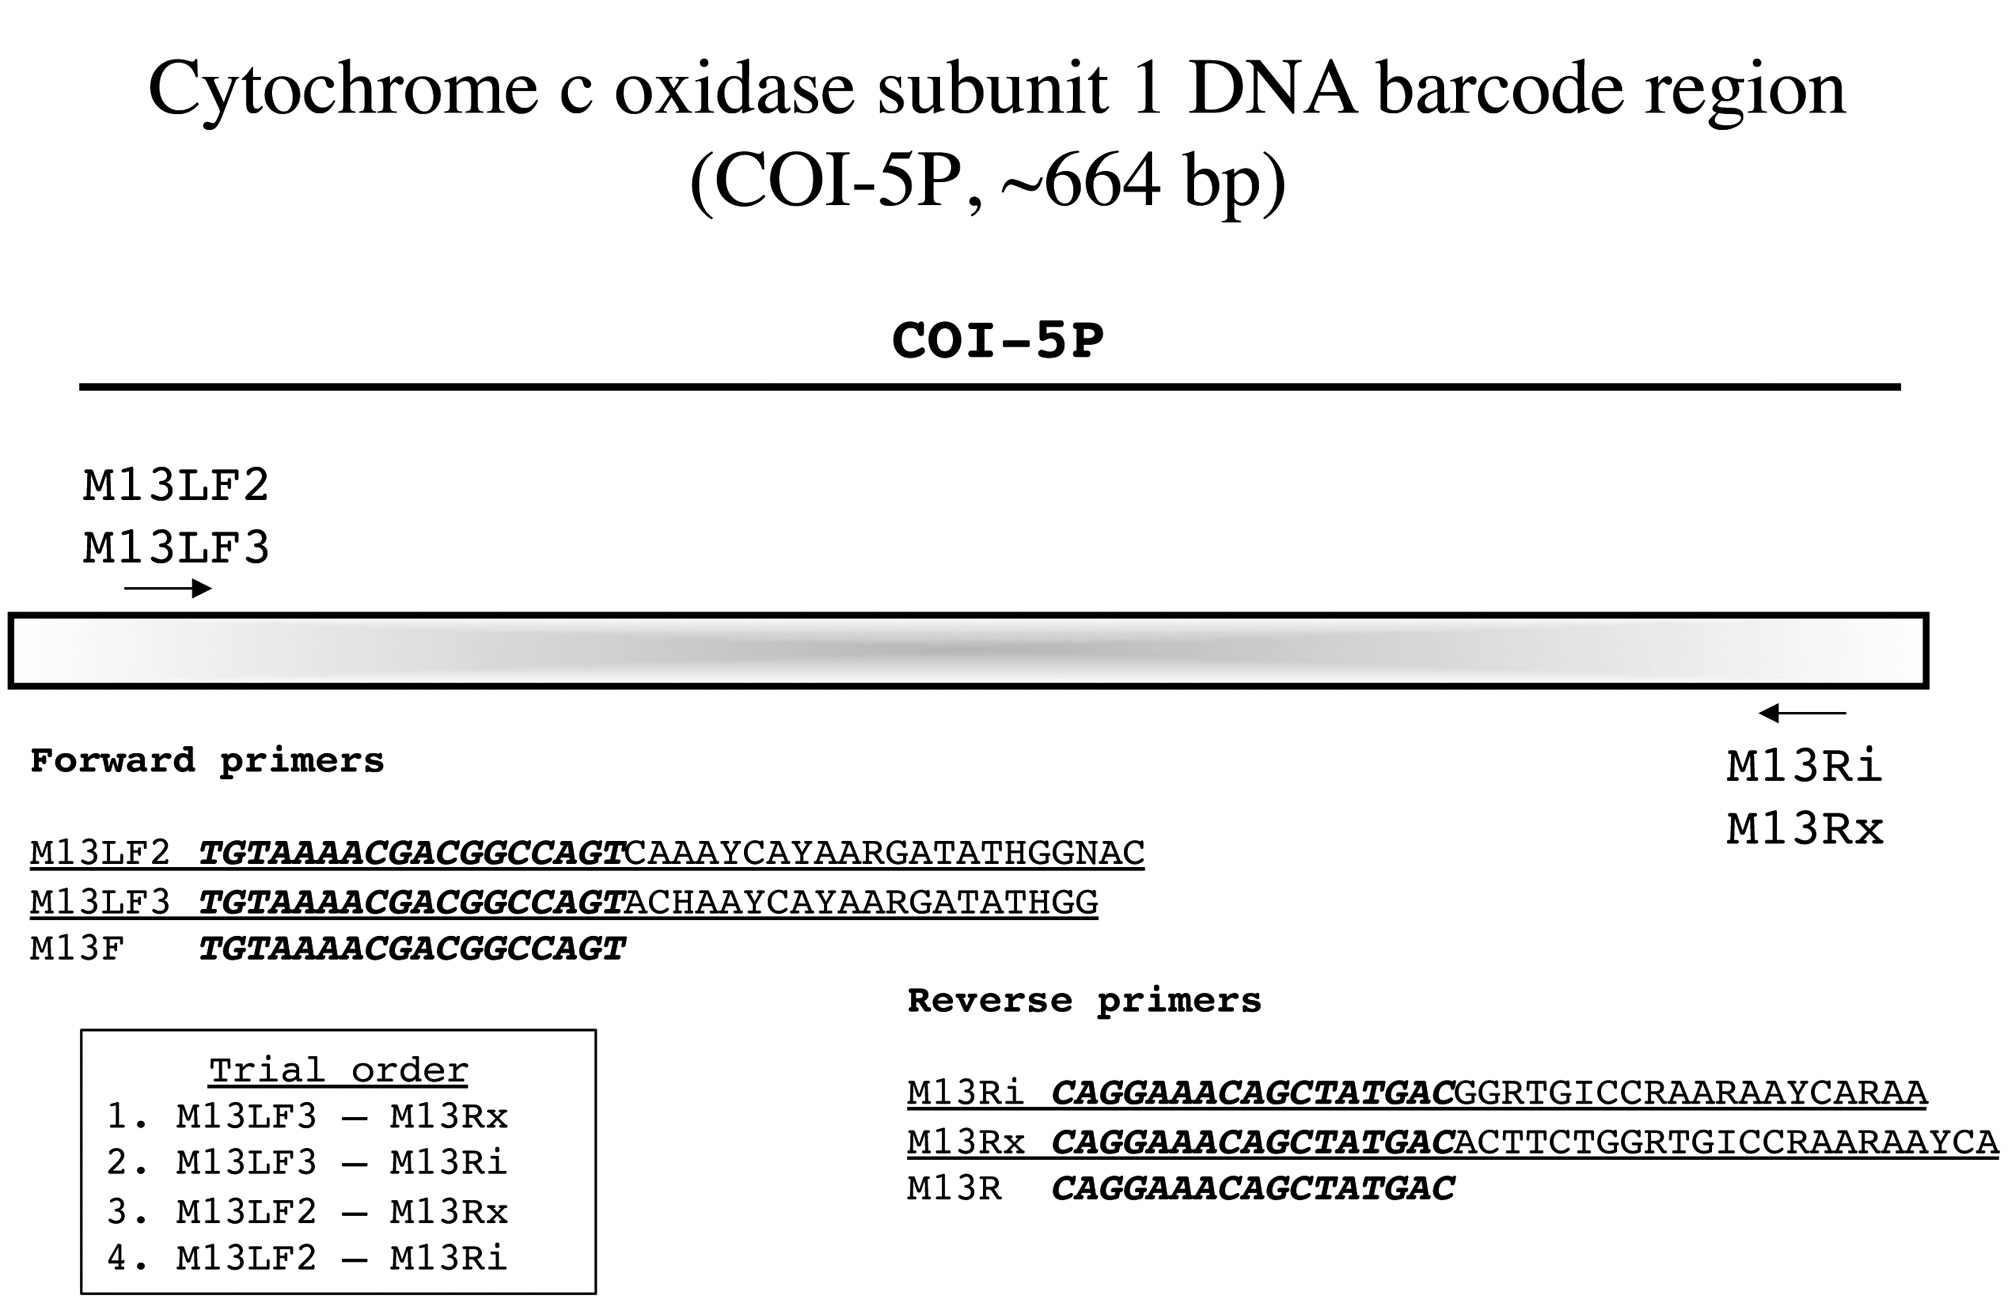
      >  Cytochrome c oxidase subunit 1 DNA barcode region (COI-5P, ~ 664 bp)

    Saunders and McDevit (2012) have recently reviewed the DNA barcode marker COI-5P in detail, but cautioned that primer advances were constantly being developed. So it is that an update is already due, largely improving on their earlier primers by adding variants of M13 linkers to the standard primers (Fig. 10). We now have two forward and two reverse primers that in varied combinations generate PCR product for most red algae. Owing to the short length of this fragment, bidirectional reads are accomplished without the need for internal primers (Fig. 10).

    Amplification profile: 94℃ for 2 min; 5 cycles of 94℃ for 30 s, 45℃ annealing for 30 s, 72℃ extension for 1 min;

    then 35 cycles of 94℃ for 30 s, 46.5℃ annealing for 30 s, 72℃ extension for 1 min; followed by 72℃ final extension for 7 min.

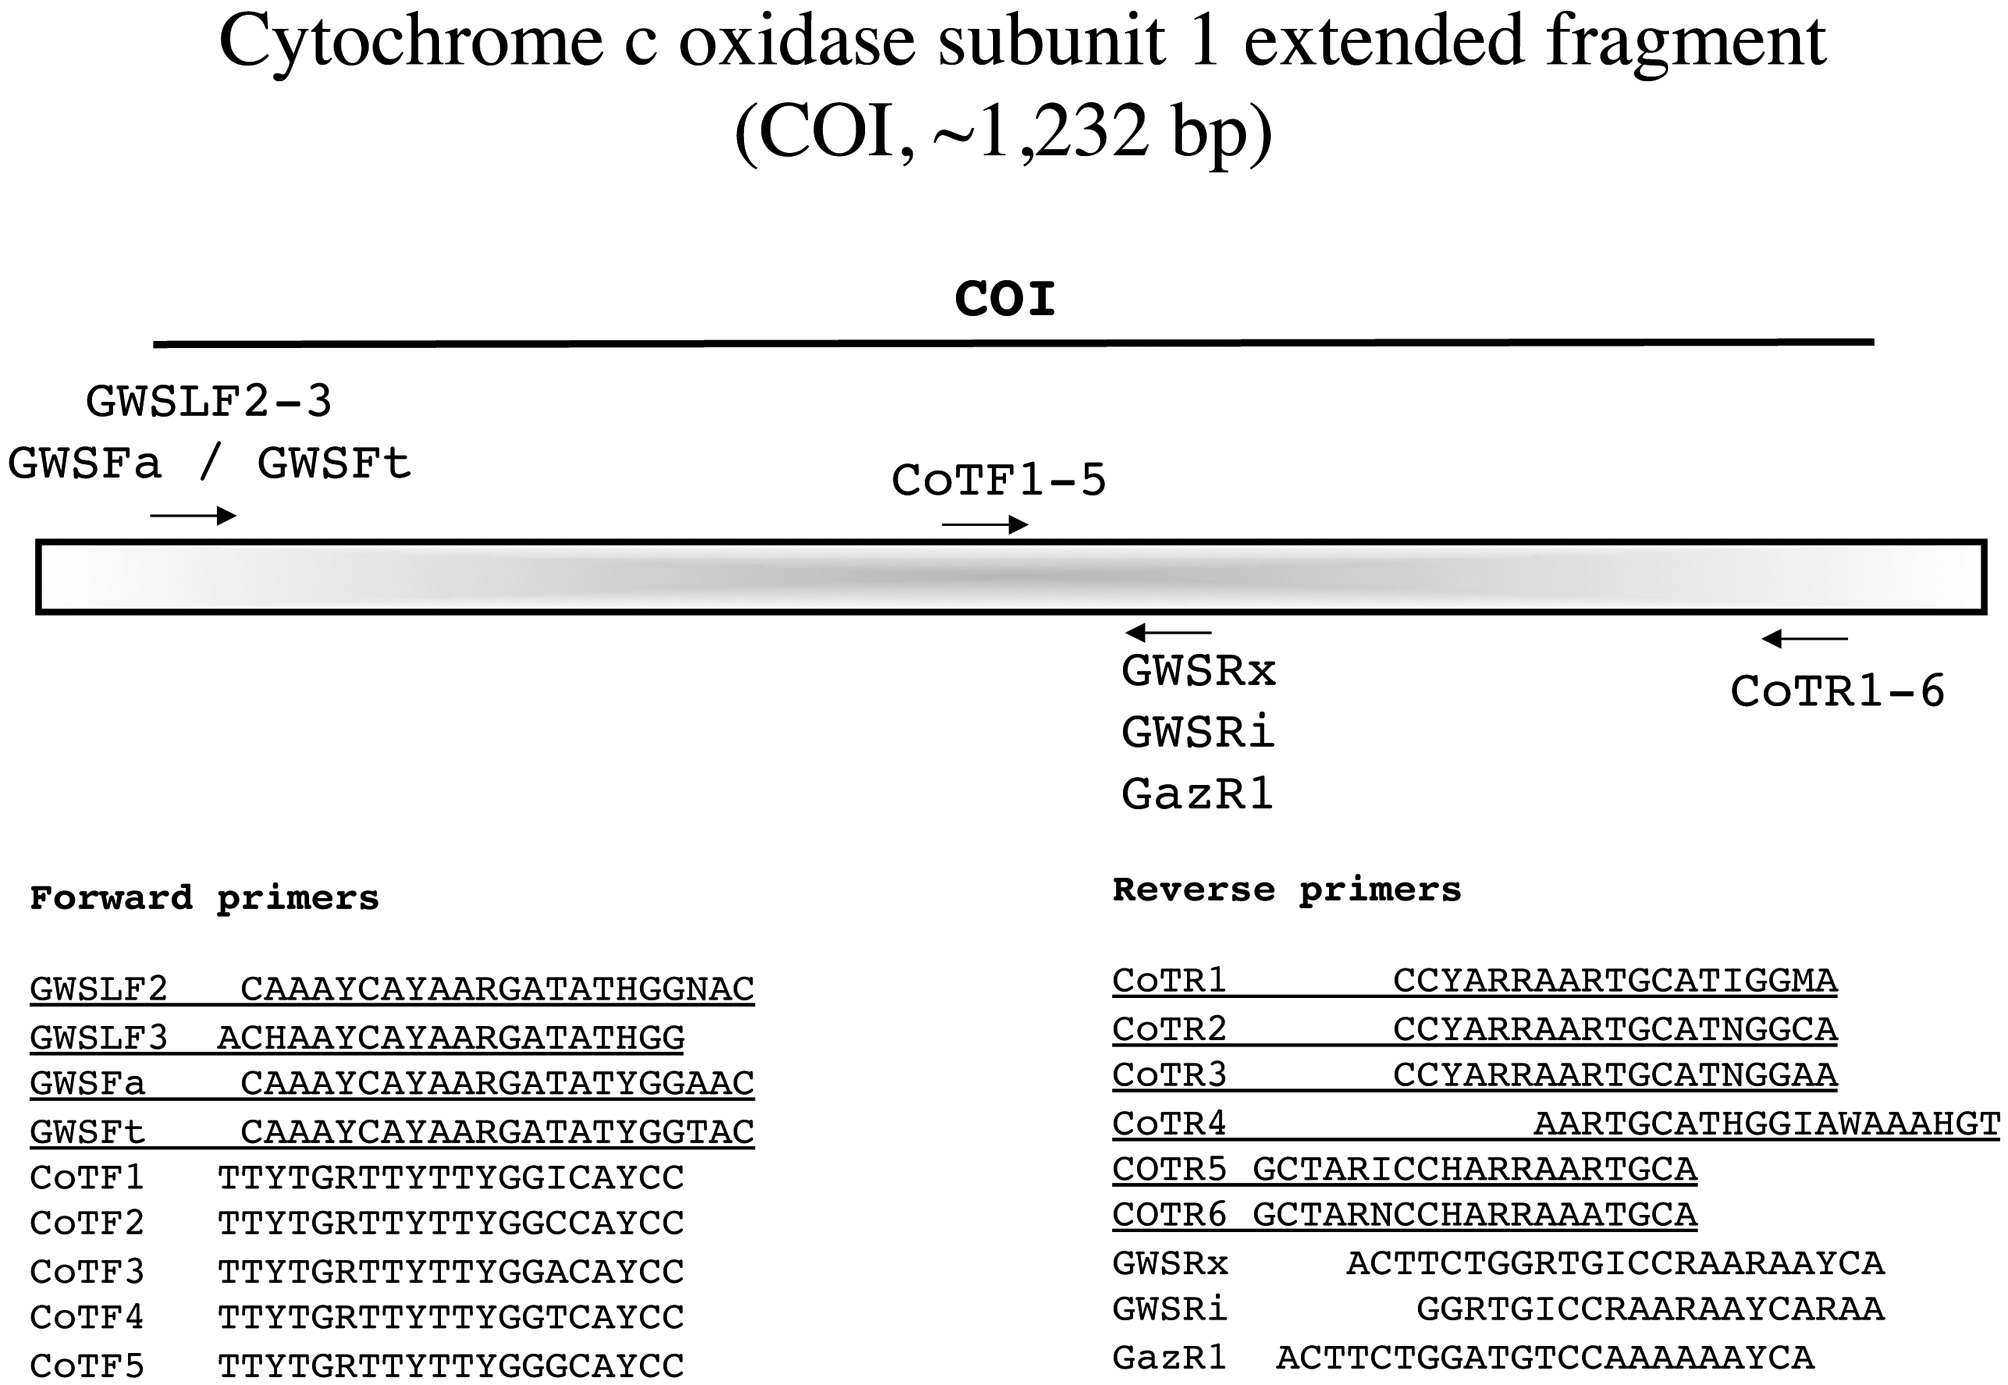
      >  Cytochrome c oxidase subunit 1 extended fragment (COI, ~1,232 bp)

    Saunders (2008) argued that COI-5P had phylogenetic signal for use among closely related taxa and we wanted to expand on this usefulness by generating a larger COI fragment (Fig. 11). Either the external forward M13-linked primers outlined previously (Fig. 10) or the unlinked variants reported with this marker are used in combination with the external reverse primers from the CoTR1-6 series for amplification (Fig. 11). We then sequence with the PCR primers and determine the best internal primers for

    sequencing from the forward series CoTF1-5 and among the reverse primers GazR1, GWSRi and GWSRx.

    Amplification profile: 94℃ for 4 min; 35 cycles of 94℃for 1 min, 45℃ annealing for 30 s, 72℃ extension for 1 min; followed by 72℃ final extension for 7 min.

      >  Cytochrome b (COB, ~940 bp)

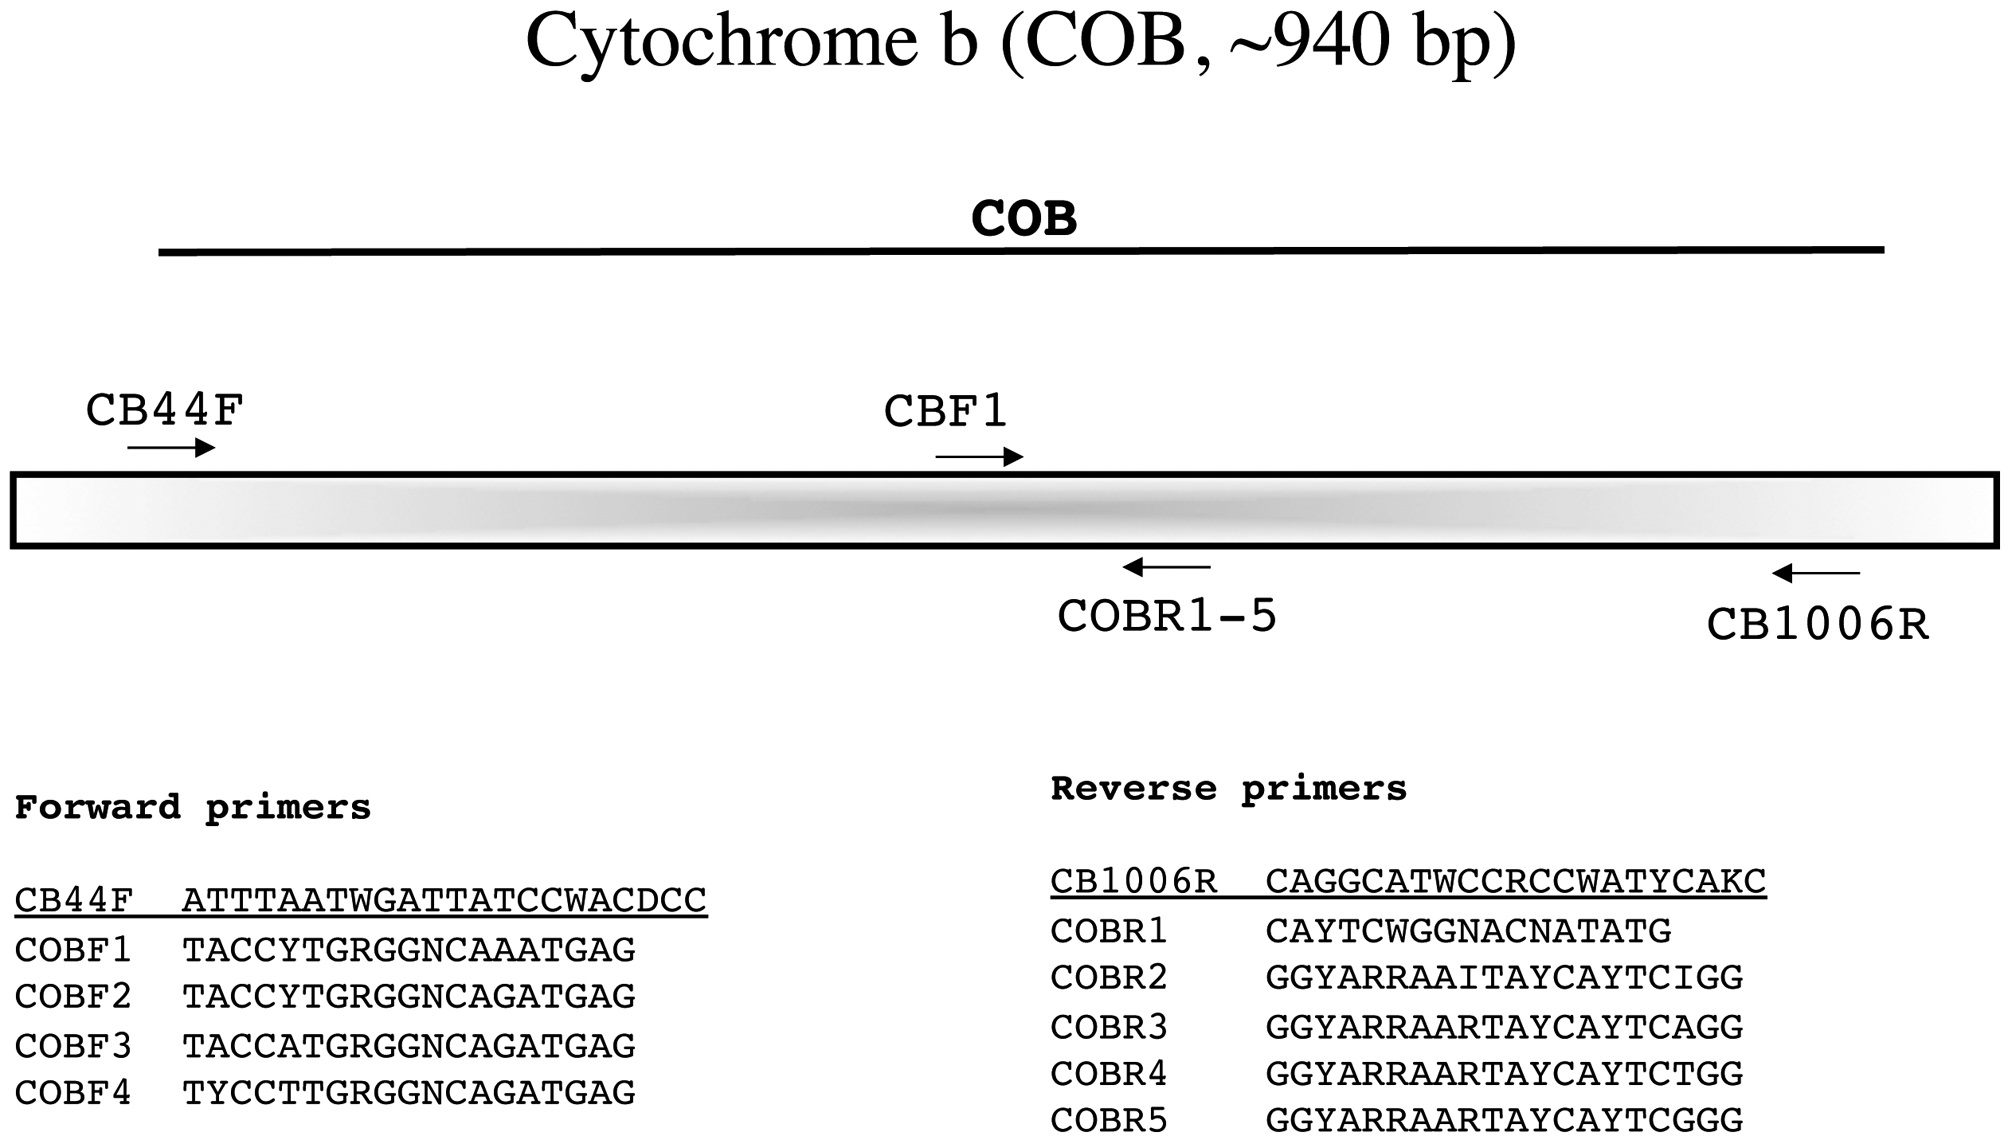
    This relative newcomer to red algal studies is amplified with the novel external primers CB44F and CB1006R designed by Ga Hun Boo (laboratory of Prof. Sung Min Boo, a RedToL partner at Chungnam National University, South Korea). Sequence is then generated with these same primers to identify the best internal forward (COBF1-4) and reverse (COBR1-5) sequencing primers (Fig. 12).

    Amplification profile: 95℃ for 1 min; 35 cycles of 93℃for 30 s, 42℃ annealing for 30 s, 72℃ extension for 1 min; followed by 72℃ final extension for 7 min.

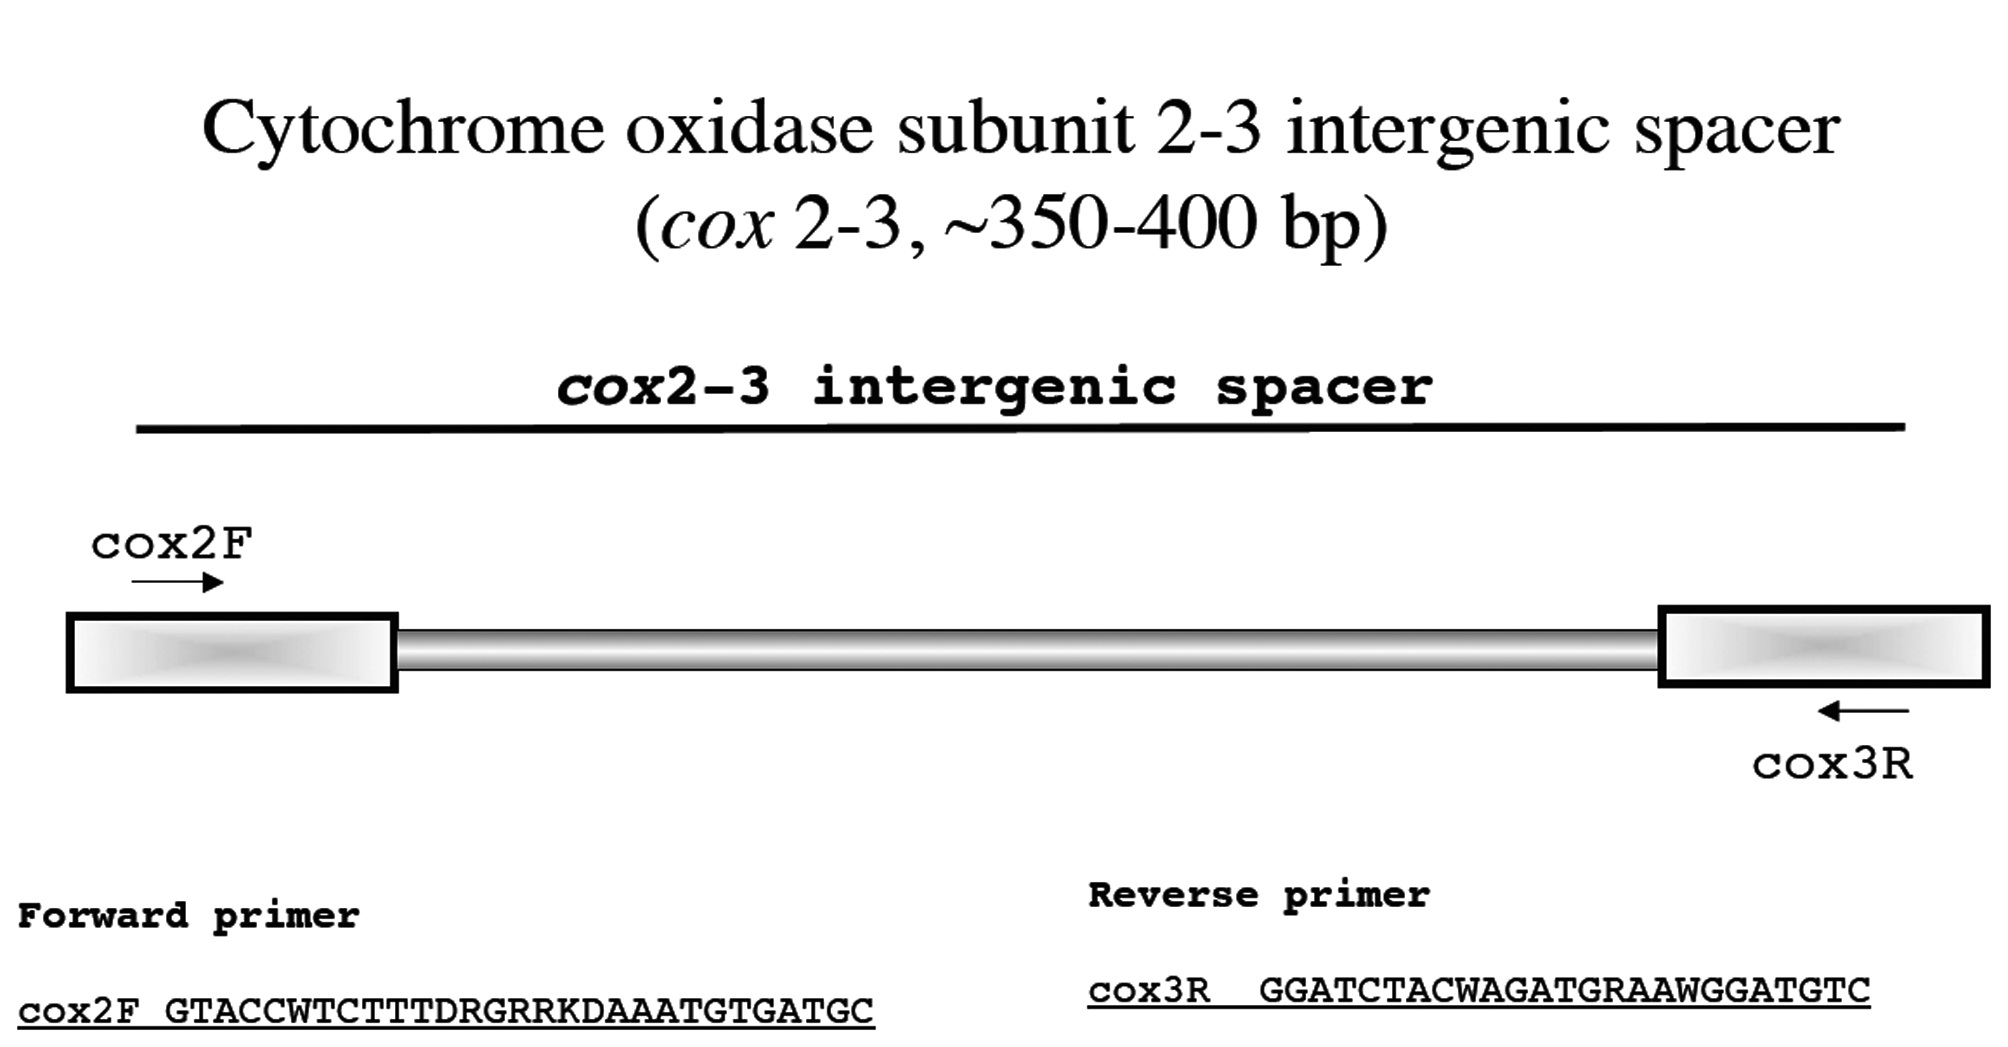
      >  Cytochrome oxidase subunit 2-3 intergenic spacer (cox 2-3, ~350-400 bp)

    This marker was first used in red algae by Zuccarello et al. (1999) and is a useful tool at the population level. We have only started to use this system and have not had to develop novel primers to date?so far the original primers of Zuccarello et al. have worked on a broad spectrum of taxa (Fig. 13).

    Amplification profile: 94℃ for 2 min; 5 cycles of 93℃for 1 min, 45℃ annealing for 1 min, 72℃ extension for 1 min; then 30 cycles of 93℃ for 30 s, 55℃ annealing for 30 s, 72℃ extension for 30 s; followed by 72℃ final extension for 7 min.

    DISCUSSION

    With the current rise in popularity and utility of powerful next generation technologies it is understandable that some of our colleagues may question the usefulness of summarizing single marker amplification protocols. Indeed there are currently three red algal genomes available in GenBank (Cyanidioschyzon, Galdieria, and Chondrus) with two more nearing completion (Porphyridium and Porphyra), while 16 additional species are in progress as part of the RedToL project (H. -S. Yoon personal communication). However, in our opinion there is still considerable value in being able to assign an unknown biological specimen to a genetic species with a simple PCR amplification and a single sequence read (both strands are not needed for routine identifications). We also see the value, at least for the near future, of targeted multi-gene phylogenetics, which will facilitate the inclusions of hundreds (e.g., RedToL is targeting ~650 species) rather than dozens of taxa in phylogenetic analyses. We thus hope that this summary will be of use to our colleagues.

    A guiding principle for our approach to marker development and use is that primers are affordable and relatively easy to design and / or select once some sequence data are in hand. We thus routinely circumvent contamination and amplification problems by acquiring whatever portion of a marker we can for a specimen. Those data then “inform” our next steps with regards to amplification and or sequencing using primers currently in our lab or newly designed to meet a special need. An example is found in Clayden and Saunders (2010) in which LSU sequences for palmarialean taxa were compared to the host halymeniacean data to facilitate the development of the novel primers rsr1 and rsf1 for use with T01N and T15, respectively (Fig. 3). These primers were then used to amplify this marker as two overlapping fragments for the epi-endophyte Rhodonematella subimmersa (Setchell & N. L. Gardner) S. L. Clayden & G. W. Saunders from a bulk DNA extraction with its host.

    We have extended this philosophy to markers for which relatively conservative external PCR primers have been developed, but for which “universal” internal sequencing primers remain elusive [i.e., EF2 (Fig. 4), psaA (Fig. 5), psaB (Fig. 6), psbA (Fig. 7), rbcL (Fig. 9), COI (Fig. 11) and COB (Fig. 12)]. In all of these cases we amplify and sequence with the PCR primers and then use those resulting data to “inform” our choice of the best internal sequencing primers to use from the options. This approach has greatly improved our overall success at getting quality, full bidirectional reads for these markers, all of which tend to lack internal conservative regions for “universal” primer design. In short, users should not be constrained by the fragments and primers as presented here and should explore alternative fragments and novel primers where necessary to circumvent problems of no amplification or contamination (e.g., Lane and Saunders 2005, Wynne and Saunders 2012).

    However, one word of caution is necessary whenever markers are amplified as a series of fragments?always be wary of inadvertently generating chimeric sequences (e.g., for the LSU the X and Z fragments may be from your target species, but the Y fragment has amplified from a contaminant on or in the sample). We have encountered chimeric sequences in our own data and those of colleagues between various red and brown algae and have even uncovered mixed alga / invert sequences. This is going to happen, the critical point is to catch it when it does. The problem is obvious in the more variable markers where the fragments have a significant overlap (e.g., EF2 and rbcL) (Figs 4 & 9, respectively), but can be more difficult to detect in markers for which fragment overlap is short and usually corresponds to conservative regions of the markers (e.g., SSU and LSU, respectively) (Figs 1 & 3). We routinely generate trees for the various fragments to look for phylogenetic consistency among fragments for an isolate prior to combining them to generate a complete sequence. In addition, as GenBank becomes more populated with red algal sequences, simply blasting the fragments when you suspect a problem can highlight a chimeric sequence. On that last note, even markers amplified as a single fragment can be from contaminating organisms rather than the target species?a blast through the various databases such as GenBank (BOLD for COI- 5P; http://www.boldsystems.org) is typically a prudent endeavor.

참고문헌
  • 1. Bird C. J., Rice E. L., Murphy C. A., Ragan M. A. 1992 Phylogenetic relationships in the Gracilariales (Rhodophyta) as determined by 18S rDNA sequences. [Phycologia] Vol.31 P.510-522 google cross ref
  • 2. Clarkston B. E., Saunders G. W. 2010 A comparison of two DNA barcode markers for species discrimination in the red algal family Kallymeniaceae (Gigartinales, Florideophyceae), with a description of Euthora timburtonii sp. nov. [Botany] Vol.88 P.119-131 google cross ref
  • 3. Clayden S. L., Saunders G. W. 2010 Recognition of Rubrointrusa membranacea gen. et comb. nov., Rhodonematella subimmersa gen. et comb. nov. (with a reinterpretation of the life history) and the Meiodiscaceae fam. nov. within the Palmariales (Rhodophyta). [Phycologia] Vol.49 P.283-300 google cross ref
  • 4. Druehl L. D., Collins J. D., Lane C. E., Saunders G. W. 2005 An evaluation of methods used to assess intergeneric hybridization in kelp using Pacific Laminariales (Phaeophyceae). [J. Phycol.] Vol.41 P.250-262 google cross ref
  • 5. Freshwater D. W., Bailey J. C. 1998 A multigene phylogeny of the Gelidiales including nuclear large-subunit rRNA sequence data. [J. Appl. Phycol.] Vol.10 P.229-236 google cross ref
  • 6. Freshwater D. W., Fredericq S., Butler B. S., Hommersand M. H., Chase M. W. 1994 A gene phylogeny of the red algae (Rhodophyta) based on plastid rbcL [Proc. Natl.Acad. Sci. U. S. A.] Vol.91 P.7281-7285 google cross ref
  • 7. Freshwater D. W., Rueness J. 1994 Phylogenetic relationships of some European Gelidium (Gelidiales, Rhodophyta) species, based on rbcL nucleotide sequence analysis. [Phycologia] Vol.33 P.187-194 google cross ref
  • 8. Harper J. T., Saunders G. W. 2001a Molecular systematics of the Florideophyceae (Rhodophyta) using nuclear large and small subunit rDNA sequence data. [J. Phycol.] Vol.37 P.1073-1082 google cross ref
  • 9. Harper J. T., Saunders G. W. 2001b The application of sequences of the ribosomal cistron to the systematics and classification of the florideophyte red algae (Florideophyceae, Rhodophyta). [Cah. Biol. Mar.] Vol.42 P.25-38 google
  • 10. Hind K. R., Saunders G. W. 2013 A molecular phylogenetic study of the tribe Corallineae (Corallinales, Rhodophyta) with an assessment of genus-level taxonomic features and descriptions of novel genera. [J. Phycol.] Vol.49 P.103-114 google cross ref
  • 11. Huisman J. M., Harper J. T., Saunders G. W. 2004 Phylogenetic study of the Nemaliales (Rhodophyta) based on large-subunit ribosomal DNA sequences supports segregation of the Scinaiaceae fam. nov. and resurrection of Dichotomaria Lamarck. [Phycol. Res.] Vol.52 P.224-234 google cross ref
  • 12. Lane C. E., Saunders G. W. 2005 Molecular investigation reveals epi/endophytic extrageneric kelp (Laminariales, Phaeophyceae) gametophytes colonizing Lessoniopsis littoralis thalli. [Bot. Mar.] Vol.48 P.426-436 google
  • 13. Le Gall L., Saunders G. W. 2007 A nuclear phylogeny of the Florideophyceae (Rhodophyta) inferred from combined EF2, small subunit and large subunit ribosomal DNA: establishing the new red algal subclass Corallinophycidae. [Mol. Phylogenet. Evol.] Vol.43 P.1118-1130 google cross ref
  • 14. Maggs C. A., Verbruggen H., De Clerck O. 2007 Molecular systematics of red algae: building future structures on firm foundations. In Brodie, J. & Lewis, J. (Eds.) Unravelling the Algae: The Past, Present, and Future of Algal Systematics. P.103-121 google
  • 15. Ragan M. A., Bird C. J., Rice E. L., Gutell R. R., Murphy C.A., Singh R. K. 1994 A molecular phylogeny of the marine red algae (Rhodophyta) based on the nuclear small-subunit rRNA gene. [Proc. Natl. Acad. Sci. U. S. A.] Vol.91 P.7276-7280 google cross ref
  • 16. Saunders G. W. 2005 Applying DNA barcoding to red macroalgae: a preliminary appraisal holds promise for future applications. [Philos Trans. R. Soc. B Biol. Sci.] Vol.360 P.1879-1888 google cross ref
  • 17. Saunders G. W. 2008 A DNA barcode examination of the red algal family Dumontiaceae in Canadian waters reveals substantial cryptic species diversity. 1. The foliose Dilsea- Neodilsea complex and Weeksia [Botany] Vol.86 P.773-789 google cross ref
  • 18. Saunders G. W., Kraft G. T. 1994 Small-subunit rRNA gene sequences from representatives of selected families of the Gigartinales and Rhodymeniales (Rhodophyta). 1. Evidence for the Plocamiales ord. nov. Can. [J. Bot.] Vol.72 P.1250-1263 google cross ref
  • 19. Saunders G. W., McDevit D. C. 2012 Methods for DNA barcoding photosynthetic protists emphasizing the macroalgae and diatoms. [Methods Mol. Biol.] Vol.858 P.207-222 google cross ref
  • 20. Sherwood A. R., Presting G. G. 2007 Universal primers amplify a 23S rDNA plastid marker in eukaryotic algae and cyanobacteria. [J. Phycol.] Vol.43 P.605-608 google cross ref
  • 21. Steane D. A., McClure B. A., Clarke A. E., Kraft G. T. 1991 Amplification of the polymorphic 5.8S rRNA gene from selected Australian gigartinalean species (Rhodophyta) by polymerase chain reaction. [J. Phycol.] Vol.27 P.758-762 google cross ref
  • 22. Tai V., Lindstrom S. C., Saunders G. W. 2001 Phylogeny of the Dumontiaceae (Gigartinales, Rhodophyta) and associated families based on SSU rDNA and internal transcribed spacer sequence data. [J. Phycol.] Vol.37 P.184-196 google cross ref
  • 23. Vis M. L., Sheath R. G. 1999 A molecular investigation of the systematic relationships of Sirodotia species (Batrachospermales, Rhodophyta) in North America. [Phycologia] Vol.38 P.261-266 google cross ref
  • 24. Vis M. L., Yoon H. S., Bhattacharya D., Lopez-Bautista J.M. 2010 RedTol: the red algal tree of life. In Mikkelsen, P. (Ed.) Why Study the Tree of Life? The Scientists Speak. Vol. 18. P.13 google
  • 25. West J. A., Scott J. L., West K. A., Karsten U., Clayden S. L., Saunders G. W. 2008 Rhodachlya madagascarensis gen. et sp. nov.: a distinct acrochaetioid represents a new order and family (Rhodachlyales ord. nov., Rhodachlyaceae fam. nov.) of the Florideophyceae (Rhodophyta). [Phycologia] Vol.47 P.203-212 google cross ref
  • 26. Wynne M. J., Saunders G. W. 2012 Taxonomic assessment of North American species of the genera Cumathamnion, Delesseria, Membranoptera and Pantoneura (Delesseriaceae, Rhodophyta) using molecular data. [Algae] Vol.27 P.155-173 google cross ref
  • 27. Yoon H. S., Hackett J. D., Bhattacharya D. 2002 A single origin of the peridinin- and fucoxanthin-containing plastids in dinoflagellates through tertiary endosymbiosis. [Proc. Natl. Acad. Sci. U. S. A.] Vol.99 P.11724-11729 google cross ref
  • 28. Yoon H. S., Hackett J. D., Ciniglia C., C G., Bhattacharya D. 2004 A molecular timeline for the origin of photosynthetic eukaryotes. [Mol. Biol. Evol.] Vol.21 P.809-818 google cross ref
  • 29. Zuccarello G. C., Burger G., West J. A., King R. J. R. J. A mitochondrial marker for red algal intraspecific relationships. [Mol. Ecol.] Vol.8 P.1443-1447 google cross ref
OAK XML 통계
이미지 / 테이블
  • [ Fig. 1. ]  Overview of PCR / sequencing strategy for the nuclear SSU. The primers G09, G15, and G16 are for chromophytic algae, but are included for reference. Primer P1 puts in context the standard forward primer that we use for amplification of the internal transcribed spacer (ITS) region.
    Overview of PCR / sequencing strategy for the nuclear SSU. The primers G09, G15, and G16 are for chromophytic algae, but are included for reference. Primer P1 puts in context the standard forward primer that we use for amplification of the internal transcribed spacer (ITS) region.
  • [ Fig. 2. ]  Overview of PCR / sequencing strategy for the nuclear internal transcribed spacer (ITS).
    Overview of PCR / sequencing strategy for the nuclear internal transcribed spacer (ITS).
  • [ Fig. 3. ]  Overview of PCR / sequencing strategy for the nuclear LSU, as well as the D2 / D3 barcode region. Primer G4 puts in context the standard reverse primer that we use for amplification of the internal transcribed spacer (ITS) region.
    Overview of PCR / sequencing strategy for the nuclear LSU, as well as the D2 / D3 barcode region. Primer G4 puts in context the standard
reverse primer that we use for amplification of the internal transcribed spacer (ITS) region.
  • [ Fig. 4. ]  Overview of PCR / sequencing strategy for the nuclear EF2.
    Overview of PCR / sequencing strategy for the nuclear EF2.
  • [ Fig. 5. ]  Overview of PCR / sequencing strategy for the plastid psaA.
    Overview of PCR / sequencing strategy for the plastid psaA.
  • [ Fig. 6. ]  Overview of PCR / sequencing strategy for the plastid psaB.
    Overview of PCR / sequencing strategy for the plastid psaB.
  • [ Fig. 7. ]  Overview of PCR / sequencing strategy for the plastid psbA.
    Overview of PCR / sequencing strategy for the plastid psbA.
  • [ Fig. 8. ]  Overview of PCR / sequencing strategy for the plastid UPA barcode marker.
    Overview of PCR / sequencing strategy for the plastid UPA barcode marker.
  • [ Fig. 9. ]  Overview of PCR / sequencing strategy for the plastid rbcL. For the DNA barcode region rbcL-3P the dashed line indicates that we amplify the entire fragment, but use sequence from the external 3′ PCR primer (rbcLrevNEW) to identify the best internal forward primer (TLF1-5, ACROF1) to generate a full bidirectional read for only the 3′ end of this gene (solid line).
    Overview of PCR / sequencing strategy for the plastid rbcL. For the DNA barcode region rbcL-3P the dashed line indicates that we
amplify the entire fragment, but use sequence from the external 3′ PCR primer (rbcLrevNEW) to identify the best internal forward primer (TLF1-5,
ACROF1) to generate a full bidirectional read for only the 3′ end of this gene (solid line).
  • [ Fig. 10. ]  Overview of PCR / sequencing strategy for the mitochondrial COI-5P barcode marker. The order in which primer combinations are trialed for taxa is indicated from the first (best) to fourth option.
    Overview of PCR / sequencing strategy for the mitochondrial COI-5P barcode marker. The order in which primer combinations are
trialed for taxa is indicated from the first (best) to fourth option.
  • [ Fig. 11. ]  Overview of PCR / sequencing strategy for the mitochondrial COI extended fragment.
    Overview of PCR / sequencing strategy for the mitochondrial COI extended fragment.
  • [ Fig. 12. ]  Overview of PCR / sequencing strategy for the mitochondrial COB.
    Overview of PCR / sequencing strategy for the mitochondrial COB.
  • [ Fig. 13. ]  Overview of PCR / sequencing strategy for the mitochondrial cox2-3 intergenic spacer.
    Overview of PCR / sequencing strategy for the mitochondrial cox2-3 intergenic spacer.
(우)06579 서울시 서초구 반포대로 201(반포동)
Tel. 02-537-6389 | Fax. 02-590-0571 | 문의 : oak2014@korea.kr
Copyright(c) National Library of Korea. All rights reserved.