Natural photosynthesis in green plants achieves carbon dioxide (CO2) fixation on a global scale. The incorporation of CO2 into the biosphere by the photosynthetic action of plants and microorganisms has been estimated to amount to about 1011 tons of CO2 per year (Moroney and Somanchi 1999, Prentice 2001). However, the efficiency of solar energy conversion in plant production under optimal growth conditions is only 5-6%. The global average efficiency has been estimated as 0.15% (Price et al. 2008). Photosynthesis is much more efficient in single celled organisms such as microalgae and cyanobacteria than in terrestrial C3 and C4 plants (Kaplan and Reinhold 1999). This high efficiency is primarily due to two factors: the action of carbonic anhydrase (CA), both extracellular and intracellular, and the CO2 concentrating mechanisms (CCM) (Van et al. 2001, Spalding et al. 2002, Vance and Spalding 2005). CO2 concentration plays a vital role in the induction or repression of CCM in microalgae and cyanobacteria. It has been proven that CCM is induced in low CO2 concentrations, however, there is little information on the roles of functional proteins involved in CCM at different concentrations of CO2.
A proteomic approach to this pertinent question has been undertaken in this study. Among algae in general, the only proteome to be studied is that of
The organisms were selected as a result of parallel batch studies in the sequestration of CO2 which involved in the screening of high CO2 fixing organisms (Ramanan et al. 2010). Accordingly,
>
Sample preparation for second dimension (2D) electophoresis
Both organisms were grown under two different conditions of CO2 in the laboratory reactor maintained at 30℃ under a 12 h light / dark illumination cycles of 30 μmol m-2 s-1 during light cycle supplied by artificial lighting. Three sets of control samples were maintained at an atmospheric CO2 concentration (~350 ppm) and three sets exposed sample was maintained at a CO2 concentration of 10% (10,000 ppm). Both the cultures were grown for a period of 15-20 days in the reactor (Ramanan et al. 2010).
The algal cells were centrifuged at 5,000 ×g for 5 min and to 0.5 g of algal pellet, 10 mL of algal culture medium with 2% Triton X-100 was added. The algal pellet was resuspended and pelleted. Supernatant which had greenish-yellow tint was poured off. The pellet was once again rinsed with culture medium and centrifuged again. The supernatant was poured off and 3.75 mL of extraction buffer containing 100 mM Tris, 100 mM EDTA and 100 mM NaCl, with one aliquot of Protein Inhibitor Cocktail was added to 10 mL of buffer. About 1-2 mL of acid washed glass beads (400-600 μm) were then added and the solution was vortexed for 30 s and then placed on ice for 30 s. Icing and vortexing were repeated 20 times. The suspension was then pipetted out and placed in microcentrifuge tubes. It was then centrifuged at 15,000 rpm for 5 min and the resultant supernatant with an orange tint was estimated for protein content by Lowry’s method (Lowry et al. 1951).
>
First dimension electrophoresis
For first-dimension electrophoresis, 300 μL of sample solution was applied to a pH 4-7 ReadyStrip IPG strips (Bio-Rad, Hercules, CA, USA). The strips were rehydrated for 18 h in 20℃. The strips were then placed on an isoelectric focussing (IEF) instrument, Bio-Rad, and were run according to the pre-set program. After the run was completed, strips were stored at -80℃ until 2D electrophoresis was performed according to the pre-set program.
For the 2D, the pH 4-7 IPG strips, were equilibrated for 10 min in equilibration buffer I and were then re-equilibrated for 10 min in equilibration buffer II. The equilibrated IPG strips were then kept in 2D sodium dodecyl sulfate polyacrylamide gel electrophoresis (SDS-PAGE) shield with agarose. Precision protein standards (Bio- Rad) were run along with the sample at 50 mA for 4 h. The 2D gels were then fixed overnight, water washed and silver stained.
The 2D gels were stained with silver stain and images were captured and analysis was performed with the use of PD-Quest imaging software (Bio-Rad). Those spots showing significant differential expression are then excised from the gel and processed for ingel digestion. The software analysis revealed the molecular weight and isoelectric point (pI) values as well as the levels of expression of all the proteins. Spot identification was made using liquid chromatography-mass spectroscopy (LC-MS) at The Centre for Genomic Application (TCGA), New Delhi, India.
>
Sample preparation for LC-MS analysis
The band of interest was cut from the gel and the gels were destained. The gel pieces were then reduced using 150 μL of 10 mM dithiothreitol in 100 mM ammonium bicarbonate with 5% acetonitrile (ACN) for 1 h at 55℃. The supernatant was removed and the gel pieces were dehydrated with 100 μL of 100 mM ammonium bicarbonate for 10 min. The solution was removed again and gel pieces were dehydrated with 100 μL of 100% ACN for 20 min. For alkylation, 100 μL of 50 mM iodoacetamide in 100 mM NH4CO3 was added to the gel pieces. Tubes were incubated in dark at room temperature for 30 min. Supernatant was removed and gel pieces were washed with 100 μL of 100 mM NH4CO3 for 10 min. Supernatant was removed again and gel pieces were washed with 100 μL of 100% ACN for 20 min. Supernatant was once again removed and gel pieces were dried in vacuum for 15 min.
Gel pieces were digested with trypsin and proteins were extracted from the digested solution. About 6 μL of the extracted protein sample was injected into nanoLCMS (Agilent 1100 series LC/MSD Trap XCT; Agilent Technologies, Palo Alto, CA, USA).
The CO2 environment plays a huge role in the metabolism of the algae (Beardall et al. 1998). This is revealed in the different protein profiles of samples treated with different CO2 condition. Although the protein profiles are apparently distinct, comparison with an existing proteome would have given valuable insights on the differentially expressed proteins, however, algal proteome databases are not complete. There is no proteomic database for
analysis system) proteomics server of the Swiss Institute of Bioinformatics (http://www.expasy.ch/swiss-2dpage/viewer). Since
>
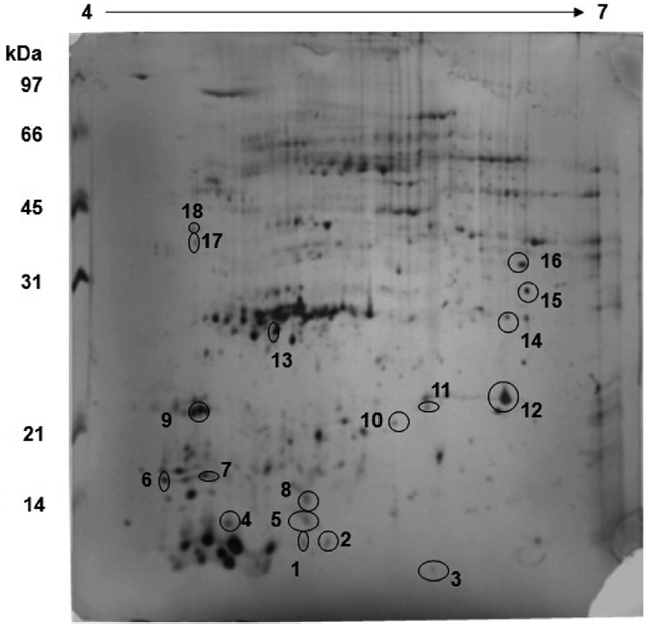
Spirulina platensis: control sample
The protein profile for the control sample reveals that a lot of proteins are expressed in the region of 30 kDa with an isoelectric point of about 5.0-5.5 (Fig. 1). This is the region where proteins involved in the CCM pathway, such as CA, are located and hence, all the proteins spots in the region were picked robotically for LC-MS analysis. A comparison between
>
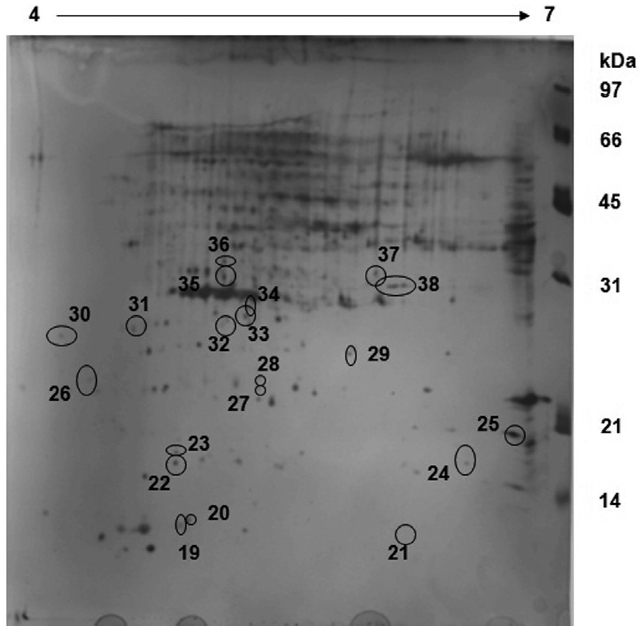
Spirulina platensis: exposed sample
The exposed sample of
>
Spirulina platensis: control vs. exposed sample
A comparative analysis of both sample gels reveals that 18 proteins are up regulated in the control sample whereas these 18 proteins are down regulated in the exposed sample (Fig. 2). Furthermore, about 31 proteins which were up regulated in the exposed sample were either down regulated or not expressed at all in the control sample. This reveals that some major metabolic activities, such as Calvin cycle, is altered under different CO2 concentrations. The over-expression of Rubisco smaller sub-unit in the exposed sample indicates that the CO2 environment has a profound impact on photosynthesis and CCM as well.
>
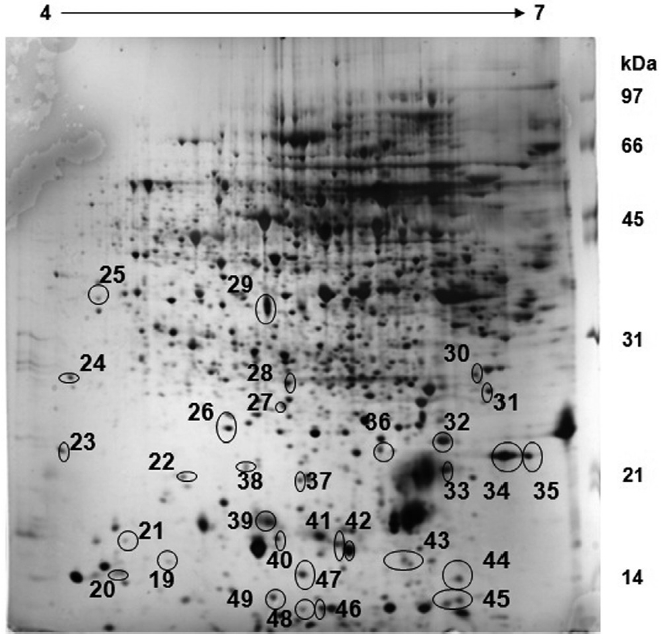
Chlorella sp.: control vs. exposed sample
The protein profiles of both control and exposed samples of
The LC-MS analysis of 10 selected protein spots in the control and exposed samples of
The 2D-PAGE data of both control and exposed samples of
In the LC-MS analysis of proteins, a total of three proteins from
[Table 1.] Details of the protein spots identified in Spirulina platensis with accession number
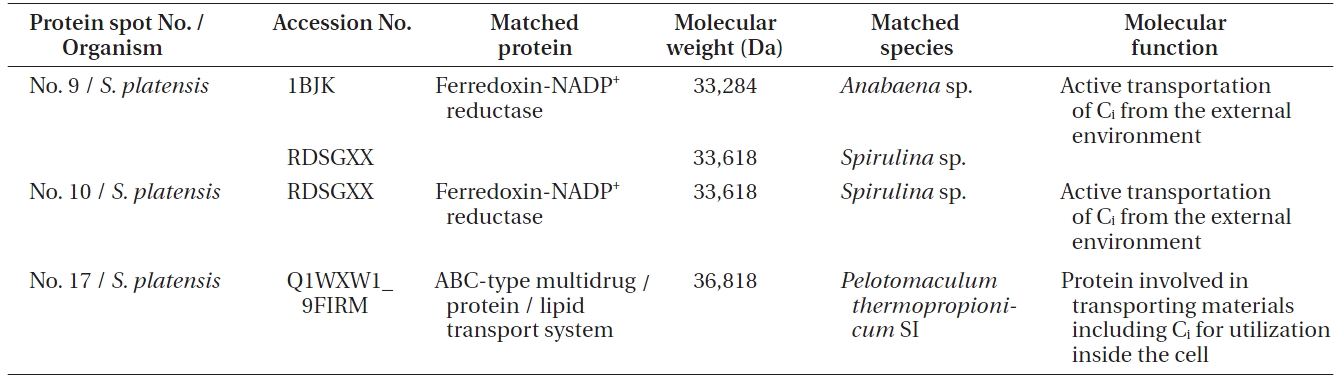
Details of the protein spots identified in Spirulina platensis with accession number
any results which may be because of the fact that the proteome database for
The protein spot No. 17 pertaining ABC transport sys-
tem protein is an important protein involved in the transport of most materials including Ci from the outside environment into the cell membrane for utilization. There are five reported transporters of Ci of which BCT1 is an inducible high affinity HCO3- transporter encoded by the cmpABCD operon and belonging to the traffic ABC transporter family (Price et al. 2008). BCT1 has been found to be expressed in 10 other cyanobacteria and hence it is quite possible that BCT1 is the transporter which is expressed in
The form of Ci that accumulates in the cytosol is HCO3-, irrespective of the form of Ci entering the cells. An energized conversion of CO2 to HCO3-, however, occurs on the cytosolic side of the thylakoid membrane. This energized conversion is aided by the electron transfer through NADH-1 complex which also hosts ferredoxin-NADP+ reductase enzyme, which catalyzes high energy conversion along with other proteins in the NADH-1 complex. According to Price et al. (2002), the reduced intermediate generated within the NADH-1 complex by the electrons donated by NAD(P)H or ferredoxin converts Zn-H2O to Zn-OH at the active site of the complex. As in CA, the Zn-OH is then involved in hydrating CO2 to HCO3-. Thus, Ferredoxin-NADP+ reductase, which has been identified in proteins spots 9 and 10 from
Thus, proteomic and subsequent LC-MS analyses reveal that normal CCM pathway has been actively pursued in cells maintained at atmospheric concentrations of CO2. On the contrary, the same pathways have not been activated under conditions of elevated CO2 as indicated by the down-regulation of the identified proteins along with 15 other proteins probably having functions in CCM and related mechanisms. This strongly proves that at lower concentrations of CO2, the CCM pathway is activated, in the study organisms. At high concentrations of CO2, the CCM pathway need not be activated as the CO2 concentration is high and Rubsico naturally expresses carboxylase activity without the help of CCM (Fukuzawa et al. 2001, Moroney and Ynalvez 2007, Yamano and Fukuzawa 2009, Cannon et al. 2010). Thus,
In the case of