검색 전체 메뉴
PDF
맨 위로
OA 학술지
An Application of Hilbert-Huang Transform on the Non-Stationary Astronomical Time Series: The Superorbital Modulation of SMC X-1
  • 비영리 CC BY-NC
  • 비영리 CC BY-NC
ABSTRACT
An Application of Hilbert-Huang Transform on the Non-Stationary Astronomical Time Series: The Superorbital Modulation of SMC X-1
KEYWORD
X-ray binaries , superorbital modulations , Hilbert-Huang transform , SMC X-1
  • 1. INTRODUCTION

    The high-mass X-ray binary SMC X-1 consists of a 1.06 M neutron star (van der Meer et al. 2007) and a 17.2 M supergiant (Reynolds et al. 1993). The orbital period of this system is ~3.89 d obtained from the X-ray eclipse. Gruber & Rothschild (1984) found that the SMC X-1 exhibits an X-ray periodicity with a rough time scale of 60 d. This periodicity was then confirmed by Wojdowski et al. (1998) and the cycle lengths were reported to vary with time. The behavior of the period variation was investigated after several timefrequency analysis techniques, like the dynamic power spectrum (Clarkson et al. 2003) and the slide Lomb-Scargle periodogram (Trowbridge et al. 2007), were applied on the All-Sky Monitor (ASM) light curve. We present our analysis by using of a recently developed time-frequency analysis technique, the Hilbert-Huang transform (HHT), to explore the timing properties of the superorbital modulation. Furthermore, based on the phase defined in the HHT, the superorbital phase-resolved analysis on both the spectral behaviors and the variation of orbital profiles are also presented.

    2. OBSERVATIONS

    The dwell data, collected by the ASM onboard Rossi X-ray Timing Explorer (RXTE) with ~ 90 minute timing resolution, were used to explore the detailed variation of orbital profile of SMC X-1. The data were further binned into one-day light

    curve to investigate the variation of superorbital period. Furthermore, the data collected by the Proportional Counter Array (PCA) onboard RXTE were also included to obtain the variation of spectral behavior in the different superorbital states.

    3. THE HILBERT-HUANG TRANSFORM

    The HHT, which is proposed by Huang et al. (1998), is designed to analyze the non-linear and non-stationary time series. The normalized Hilbert transform was used to obtain the instantaneous frequency of the superorbital modulation. However, the Hilbert transform can only be applied on the intrinsic mode functions (IMFs) to get meaningful instantaneous frequency. We used the ensemble empirical mode decomposition, proposed by Wu & Huang (2009), to decompose the ASM light curve into several IMFs.

    4. TIME-FREQUENCY ANALYSIS

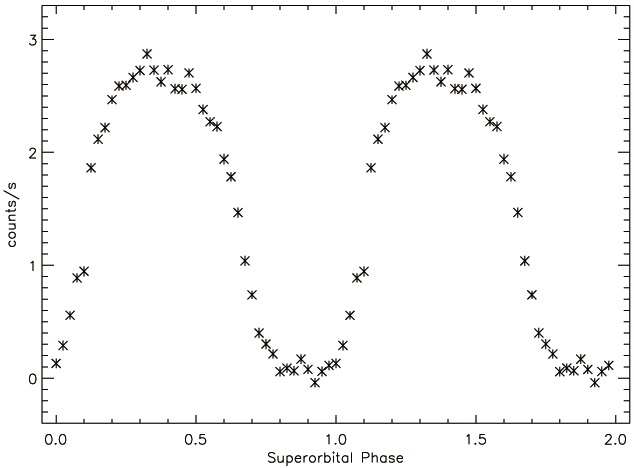
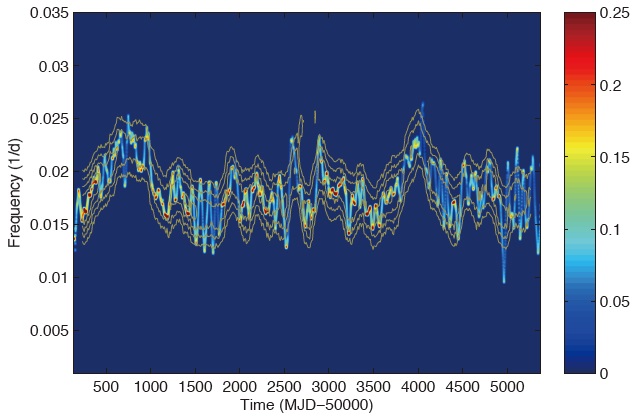
    After decomposing the light curve into several IMFs, we applied the normalized Hilbert transform on them to obtain the Hilbert spectrum. Fig. 1 shows the Hilbert spectrum that contains information of frequency and amplitude variation in a color map, which is stacking with the dynamic power spectrum in contour for comparison. We noticed that the Hilbert spectrum is basically consistent with the dynamic power spectrum, but the resolutions are better in both the time and frequency domains. Since the HHT provided us a well-defined phase of the superorbital modulation, we folded the light curve according to the superorbital phase to obtain the asymmetric superorbital profile, which is shown in Fig. 2. Furthermore, we obtained a significant correlation

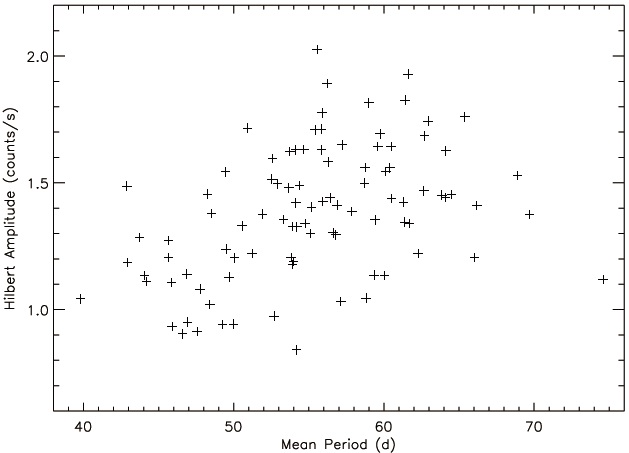
    between the modulation period and the amplitude shown in Fig. 3. This correlation is similar to that between the main-on flux and the superorbital period of Her X-1 (Still & Boyd 2004). Both of the examples are inconsistent with the prediction of radiation-induced warp disk (Wijers & Pringle 1999).

    5. SUPERORBITAL PHASE-RESOLVED ANALYSIS

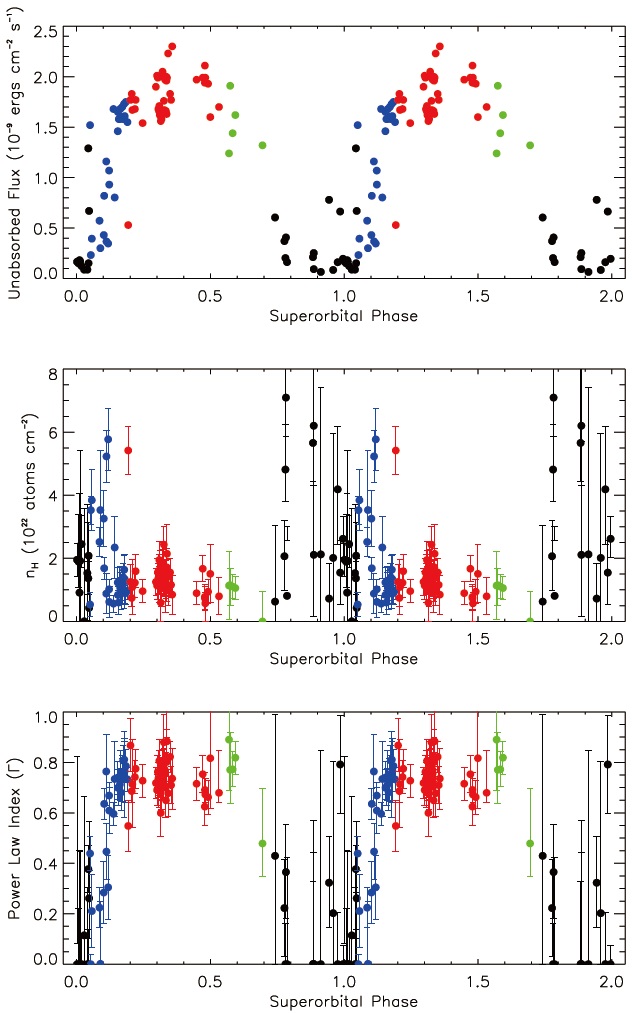
    We further studied the superorbital phase-resolved spectroscopic properties of SMC X-1 by using all the PCA observations during 1996 and 2004. The standard-2 mode spectrum can be fitted with a cutoff power law continuum and a Gaussian emission line centered at 6.4 keV. The

    variation of the uneclipsed hydrogen column density (nH) versus the superorbital phase is shown in the middle panel of Fig. 4. We noticed that the nH values show great diversity in the ascending state but remain stable in the descending state. By further checking the orbital distribution of nH in the different superorbital states, we obtained that the diversity might be caused by the dip feature occurred in orbital phase ~ 0.7.

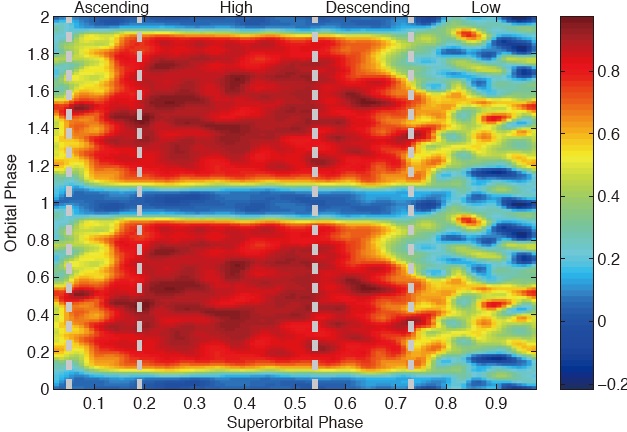
    The dip feature could be further examined by the folded light curve. Since the appearance of dip may have superorbital dependence, a two-dimensional folded light curve is a good way to investigate the dip properties. We perform this analysis method on the dwell light curve collected by the ASM. We first folded the X-ray photons in the data window of superorbital phase 0.0-0.05 according to the orbital ephemeris proposed by Wojdowski et al. (1998)

    and normalized the uneclipsed count rate to 1. Then, we move the window 0.01 superorbital cycles forward to obtain the next orbital profile. This process was repeated until the end of the data set. The combined folded light curve, drawn in a three-dimensional color map, is shown in Fig. 5. We can easily obtain the dip feature in the dynamic folded light curve, especially that occurred in superorbital descending state. From this figure, we also noticed that the dip width has an anti-correlation with the X-ray count rate. This dip feature could be associated with the pre-eclipse dip of Her X-1 (Moon & Eikenberry 2001).

    6. CONCLUSIONS

    This research demonstrated a time-frequency analysis of the non-stationary superorbital modulation of SMC X-1 by the HHT. The Hilbert spectrum shows great detail in both the time and frequency domains. Furthermore, we found a correlation between the superorbital period and amplitude, which is inconsistent with the outer warp model. Based on the phase derived in the HHT, we studied the phaseresolved spectra and the variation of orbital profile. The variation in both the nH and the orbital profile indicate that the system contains a pre-eclipse dip. The width variation of the dip can be interpreted by the warp and tilted disk model.

참고문헌
  • 1. Clarkson WI, Charles PA, Coe MJ, Laycock S, Tout MD (2003) Long-term properties of accretion discs in X-ray binaries - I. The variable third period in SMC X-1 [MNRAS] Vol.339 P.447-454 google cross ref
  • 2. Gruber DE, Rothschild RE (1984) SMC X-1 variability observed from HEAO 1 [ApJ] Vol.283 P.546-551 google cross ref
  • 3. Huang NE, Shen Z, Long SR, Wu MC, Shih HH (1998) The empirical mode decomposition and the Hilbert spectrum for nonlinear and non-stationary time series analysis [Proc. R. Soc. Lond. A] Vol.454 P.903-995 google cross ref
  • 4. Moon DS, Eikenberry SS (2001) Discovery of Coupling between Periodic and Aperiodic Variability and X-Ray Quasiperiodic Oscillations from Hercules X-1 [ApJ] Vol.552 P.L135-L139 google cross ref
  • 5. Reynolds AP, Hilditch RW, Bell SA, Hill G (1993) Optical spectroscopy of the massive X-ray binary SM X-1/Sk 160 [MNRAS] Vol.261 P.337-345 google
  • 6. Schreier E, Giacconi R, Gursky H, Kellogg E, Tananbaum H (1972) Discovery of the Binary Nature of SMC X-1 from UHURU [ApJ] Vol.178 P.L71-L75 google cross ref
  • 7. Still M, Boyd P (2004) Fine-Turning the Accretion Disk Clock in Hercules X-1 [ApJ] Vol.606 P.L135-L138 google cross ref
  • 8. Trowbridge S, Nowak MA, Wilms J (2007) Tracking the Orbital and Superorbital Periods of SMC X-1 [ApJ] Vol.670 P.624-634 google cross ref
  • 9. van der Meer A, Kaper L, van Kerkwijk MH, Heemskerk MHM, van den Heuvel EPJ (2007) Determination of the mass of the neutron star in SMC X-1, LMC X-4, and Cen X-3 with VLT/UVES [A&A] Vol.473 P.523-538 google cross ref
  • 10. Wijers RAMJ, Pringle JE (1999) Warped accretion discs and the long periods in X-ray binaries [MNRAS] Vol.308 P.207-220 google cross ref
  • 11. Wojdowski P, Clark GW, Levine AM, Woo JW, Zhang SN (1998) Quasi-periodic Occultation by a Precessing Accretion Disk and Other Variabilities of SMC X-1 [ApJ] Vol.502 P.253-264 google cross ref
  • 12. Wu Z, Huang NE (2009) Ensemble Empirical Mode Decomposition: A Noise-Assisted Data Analysis Method [AADA] Vol.1 P.1-41 google cross ref
OAK XML 통계
이미지 / 테이블
  • [ Fig. 1. ]  The Hilbert spectrum and the dynamic power spectrum of SMC X-1.
    The Hilbert spectrum and the dynamic power spectrum of SMC X-1.
  • [ Fig. 2. ]  Folded light curve of superorbital modulation of SMC X-1.
    Folded light curve of superorbital modulation of SMC X-1.
  • [ Fig. 3. ]  The correlation between the superorbital modulation period and the amplitude. The rank correlation coefficient is r = 0.46 with a null hypothesis probability value of 3.2 × 10⁻⁶.
    The correlation between the superorbital modulation period and the amplitude. The rank correlation coefficient is r = 0.46 with a null hypothesis probability value of 3.2 × 10⁻⁶.
  • [ Fig. 4. ]  The unabsorbed flux (top panel), nH (middle panel) and power-law index (bottom panel) verse the superorbital phase. Black, blue, red, and green symbols represent the spectral parameters in the low, ascending, high, and descending states, respectively.
    The unabsorbed flux (top panel), nH (middle panel) and power-law index (bottom panel) verse the superorbital phase. Black, blue, red, and green symbols represent the spectral parameters in the low, ascending, high, and descending states, respectively.
  • [ Fig. 5. ]  Two-dimensional dynamic folded light curve of SMC X-1.
    Two-dimensional dynamic folded light curve of SMC X-1.
(우)06579 서울시 서초구 반포대로 201(반포동)
Tel. 02-537-6389 | Fax. 02-590-0571 | 문의 : oak2014@korea.kr
Copyright(c) National Library of Korea. All rights reserved.