Observations and research on the continuously varying Sun have been kept by observing sunspots as an index of solar activity. The source of solar activity is variation in the solar magnetic field, which is visually manifested by sunspots on the solar surface. The so-called 11-year cyclic variation of sunspot number (SSN) was first recognized by Schwabe (1843). The most obvious indicators of the activity cycle are sunspots, flares, plages, and so on (Coles et al. 1980). All such phenomena are intimately linked to the solar magnetic fields, which exhibit complex but systematic variations from the solar surface to interplanetary space.
In comparison with the approximately 400-year record of SSN, regular measurements of the solar magnetic field with modern high technologies have only been ongoing since the 1970s. The global solar magnetic field can be understood by measuring solar polar magnetic field (SPMF) near the polar region, solar mean magnetic field (SMMF) as a star, and interplanetary magnetic field (IMF) flown by solar wind. The cyclic variation of solar activity also influences the system of the Earth in the heliosphere, in the forms of geomagnetic activity of the magnetosphere, the flux of galactic cosmic rays and possibly the climate. Many solar, interplanetary and geomagnetic (SIG) parameters show on average an 11- year cycle, in sync with SSN.
Climate change, specifically, the change in the global mean temperature, might have been associated with the variation of some solar activity indices. The important indices are total solar irradiance (TSI), ultraviolet (UV) radiance, radio flux, IMF and so on. Solanki & Fligge (1998, 1999, 2000) have presented the reconstruction of solar irradiance in the past period before accurate measurements of solar irradiance started in 1978. Under the assumption that solar irradiance variations are due to solar surface magnetism on all relevant time scales, they introduced the possibility to reconstruct irradiance with some reliability from today to around 1874, and with lower accuracy back to the Maunder minimum. They also highlighted the important role of TSI. Solar wind parameters are important proxies for the variation of solar activity as an expansion of solar atmosphere.
Recent studies (McDonald et al. 2010, Nielsen & Kjeldsen 2011) have reported that the solar cycle 23/24 minimum is different from any other solar minima seen in the past. It has been marked by a prolonged period of very low solar activity that began in 2006. The US Solar Cycle 24 Prediction Panel has renounced their consensus-based official onset time of solar cycle 24 two times: Mar. 2007 (announced on Oct. 2006) to Mar. 2008 (revised on Apr. 2007) and to Dec. 2008 (revised on May 2009). The recorded SSN of about 400 years is a key parameter in producing the proxy data of parameters with only observations since the 1970s.
Strange states of the Sun can be found in the past: in the Maunder and Dalton minima, for example. The Maunder minimum is a period of extremely low SSN that started in 1645 and ended in 1715. The Dalton minimum starts from 1790 and ends at 1820. Maunder minimum is a period of extremely low SSN, in which the Earth experienced abnormal phenomena such as a cold age. The cooling times of Maunder and Dalton Minima are probably correlated with the low SSN activity (Mauquoy 2002).
It has been speculated that the solar cycle 23/24 minimum has shown unexpected sun and solar wind conditions described as “the strange solar minimum” (Feynman & Ruzmaikin 2011, Hao & Zhang 2011, McDonald et al. 2010, Williams & Pesnell 2011, White et al. 2011). Feynman & Ruzmaikin (2011) generated the criteria that distinguish between Maunder-type Grand Minima and the minima of the cyclic Centennial Gleissberg variations. Using aa, Dst indices, and the diameter of polar cap, they concluded that the Centennial Gleissberg Cycle is a persistent variation. They also suggested that the number of sunspots (up to the end of March 2011) was still small and the auroras were still at high latitudes, which is consistent with either the Centennial Gleissberg Cycle or the Maunder Minimum. Notably, some studies indicate solar forcing on climate during this strange period of solar activity. Shindell et al. (2001) examined the climate response to solar irradiance changes during Maunder Minimum. They reported that the climate change is larger in terms of regional temperature than in global temperature. As McDonald et al. (2010) mentioned, this minimum should also provide insight into the conditions that prevailed during previous “Grand Minima” such as the Maunder (1645?1715) and Dalton (1790-1820).
Thus, we present the status of SIG parameters observed by ground observatories and satellites during approximately 36 years, including SPMF, SMMF, TSI, 10.7cm-radio flux, IMF, dynamic pressure of solar wind, frequency of X-ray flare, Ap index, and galactic cosmic ray (GCR) intensity. Then, we make some predictions on the effects that the trend will bring to the space environment surrounding the Earth in view of the past events.
The solar cyclic variation of solar magnetic fields arises from the solar surface to interplanetary space, such as SPMF (Svalgaard et al. 1974, 1978), SMMF (Scherrer & Wilcox 1977, Scherrer et al. 1977), and IMF. The IMF data are a combination of IMP-8 (1974-1997) and ACE (1998-2010) observation. The intrinsic difference of IMF magnitude exists between IMP-8 and ACE. The different satellite data sets are normalized using the data during overlapped observational interval (1998-2000). We also collected the data of the TSI, 10.7cm radio flux, and Ap index. Frequency of solar flares is counted by solar X-ray flares from the GOES since 1975. X-ray classes are classified according to the order of magnitude of the peak burst intensity measured at the
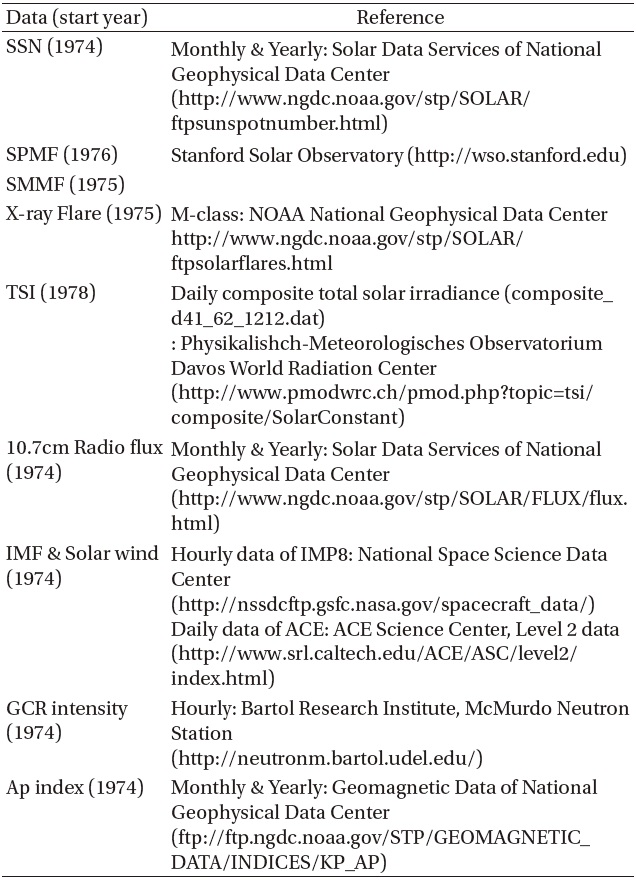
[Table 1.] Description of used data.

Description of used data.
Earth by GOES in the 0.1 - 0.8 nm band. M class of flares is used in this paper. The peak intensity of M class is 10-5 ~ 10-4 Wm-2. Here, we used GCR data recorded at McMurdo station operated by Bartol Research Institute. A description of the data used is shown in Table 1. It consists of time-resolution, start of year, reference (website), and operating institutes. All SIG parameters include the data up to December 2012 except for solar wind data (up to August 2012).
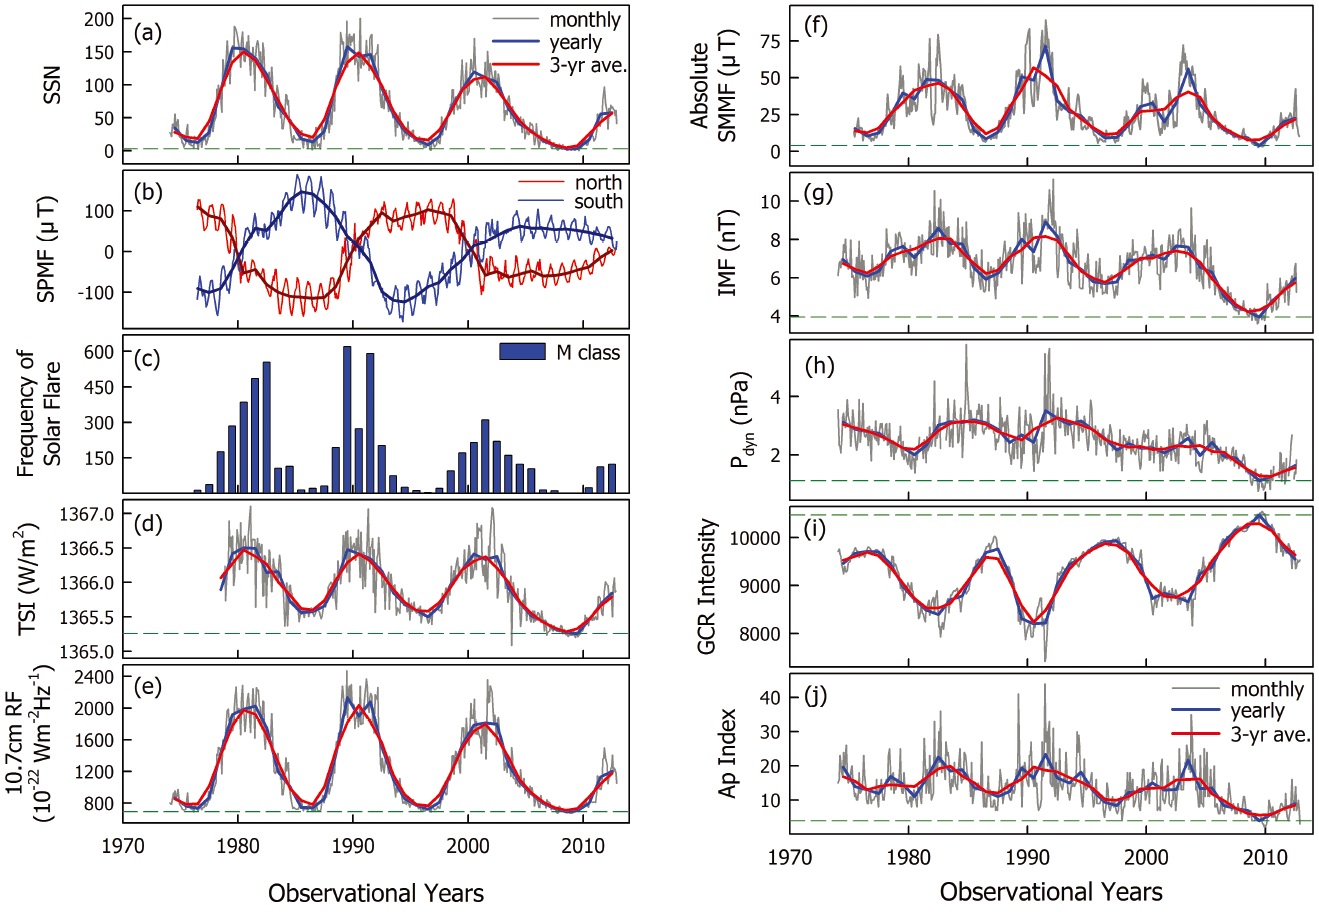
The solar cyclic variation of SIG parameters can be understood through Fig. 1. It is arranged in the order of SSN (a), SPMF magnitude (b), frequency of M-class solar flare (c), TSI (d), and 10.7cm-radio flux (e), SMMF magnitude (f ), IMF magnitude (g), dynamic pressure of solar wind (h), GCR intensity (i), and Ap index (j). The monthly mean is plotted with a black solid line, and the yearly mean is drawn with a blue bold line. The red bold line indicates the 3-year running average of yearly mean. In the SPMF magnitude (b), red and blue lines indicate north and south poles, respectively. The horizontal dashed line presents the minimum of yearly mean value at solar cycle 23/24 minimum.
All SIG parameters have a good correlation with solar cyclic variation with SSN. They show the peaks at each solar maximum, with the exception of GCR intensity (i). GCR intensity has an anticorrelation with SSN, showing a peak at each solar minimum. It also shows a well-known reversal of solar magnetic polarity. All SIG parameters show a significantly low level at the transition period from solar cycle 23 to solar cycle 24. The SPMF (b) and IMF magnitude (g) show remarkably lower values than any other parameters at the solar cycle 23/24 minimum. On the other hand, GCR intensity has higher values than in past minima.
Table 2 shows the quantitatively decreasing variation rate of SIG parameters using yearly mean values. Two out of ten parameters, i.e. SPMF and frequency of M-class solar flare, decreased by almost the half of the value. TSI, IMF

Variation rate (%) of SIG parameters: comparison between 22 and 23 solar cycles at the times of solar maximum and minimum.
magnitude, dynamic pressure of solar wind, and Ap index show much lower values in solar minimum than in solar maximum. This indicates that solar cycle 23/24 minimum is deeper and prolonged.
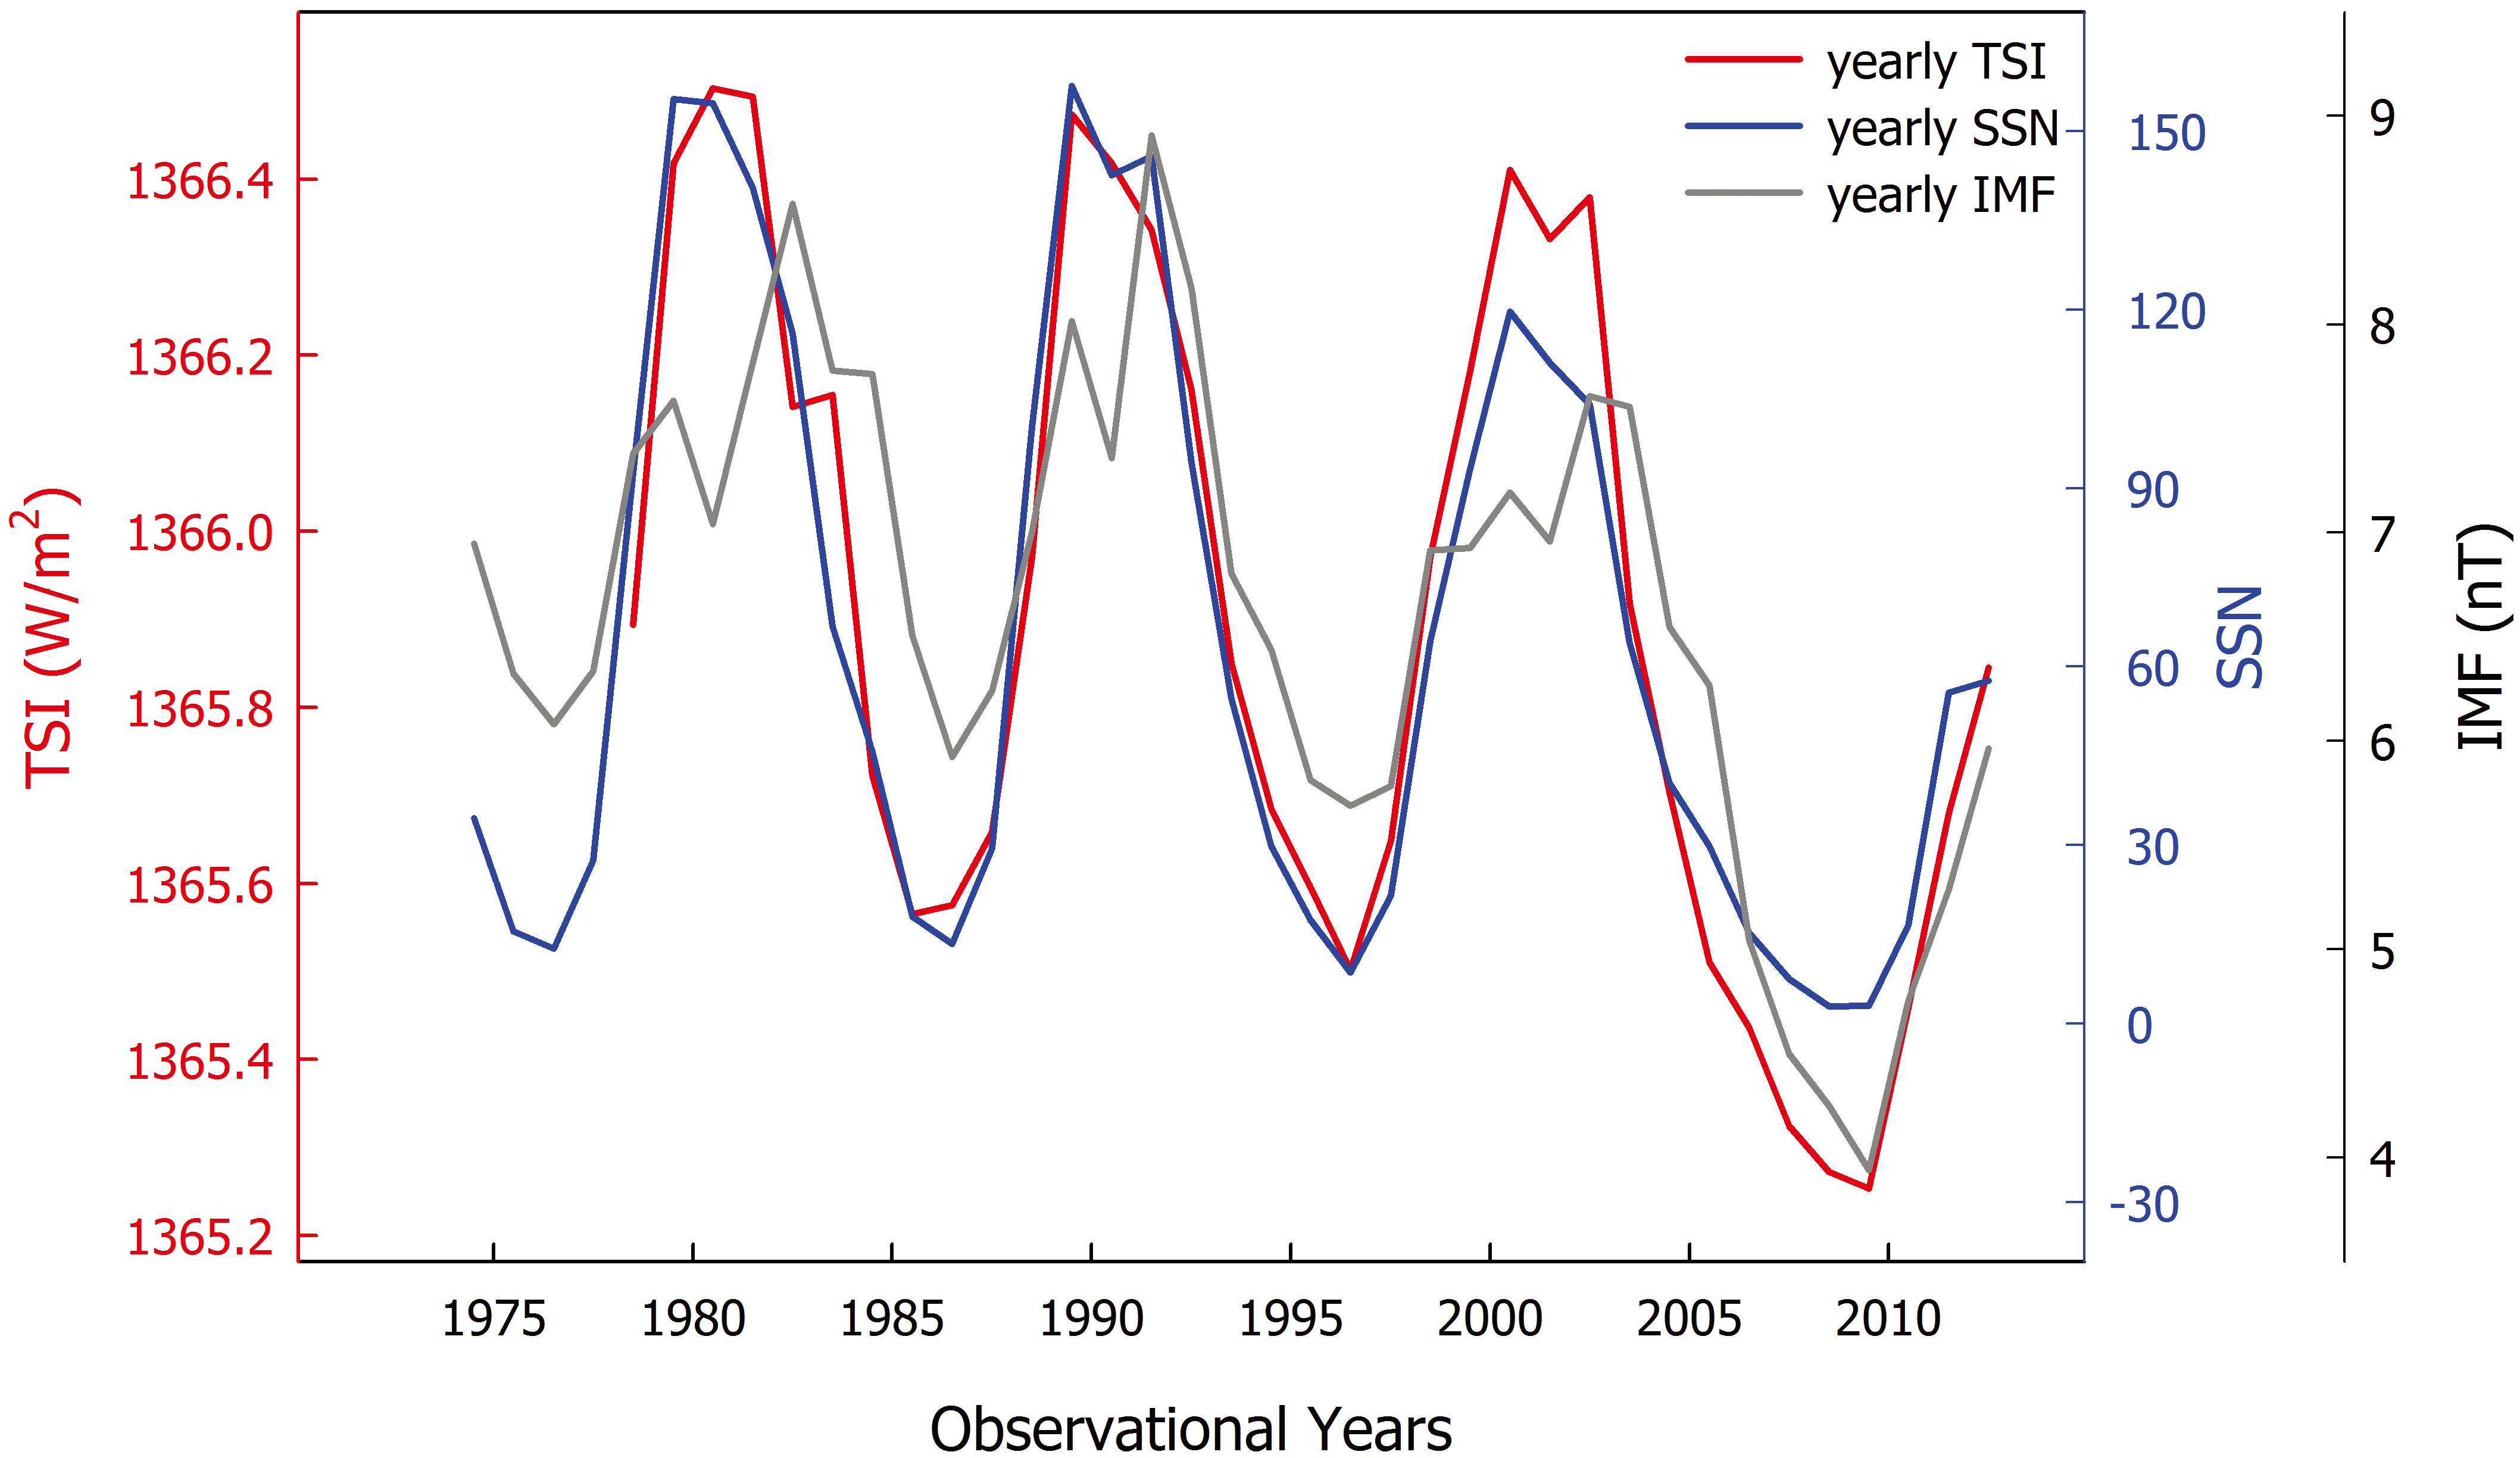
Fig. 2 shows the relationship between the yearly means of TSI (red line), SSN (blue line), and IMF magnitude (dark grey line). TSI and SSN maintain a good relationship during the 21, 22 solar cycles. After the beginning of solar cycle 23, solar irradiance still keeps a similar level to the values of previous solar cycles, unlike the lower level of SSN at the solar maximum of solar cycle 23. As shown in Table 2, TSI has experienced a larger decrease in solar cycle 23/24 minimum than in solar cycle 23 maximum by about four times, and maintains a similar level at each solar maximum period. Unlike TSI, SSN shows about 24% decrease in solar cycle 23 maximum compared with the previous one, and keeps a similar level in solar cycle 23/24 minimum compared with the previous ones. Thus, SSN can no longer predict the solar irradiance. As the solar cycle 23 begins, the level of IMF magnitude also becomes lower than in the past solar cycles.
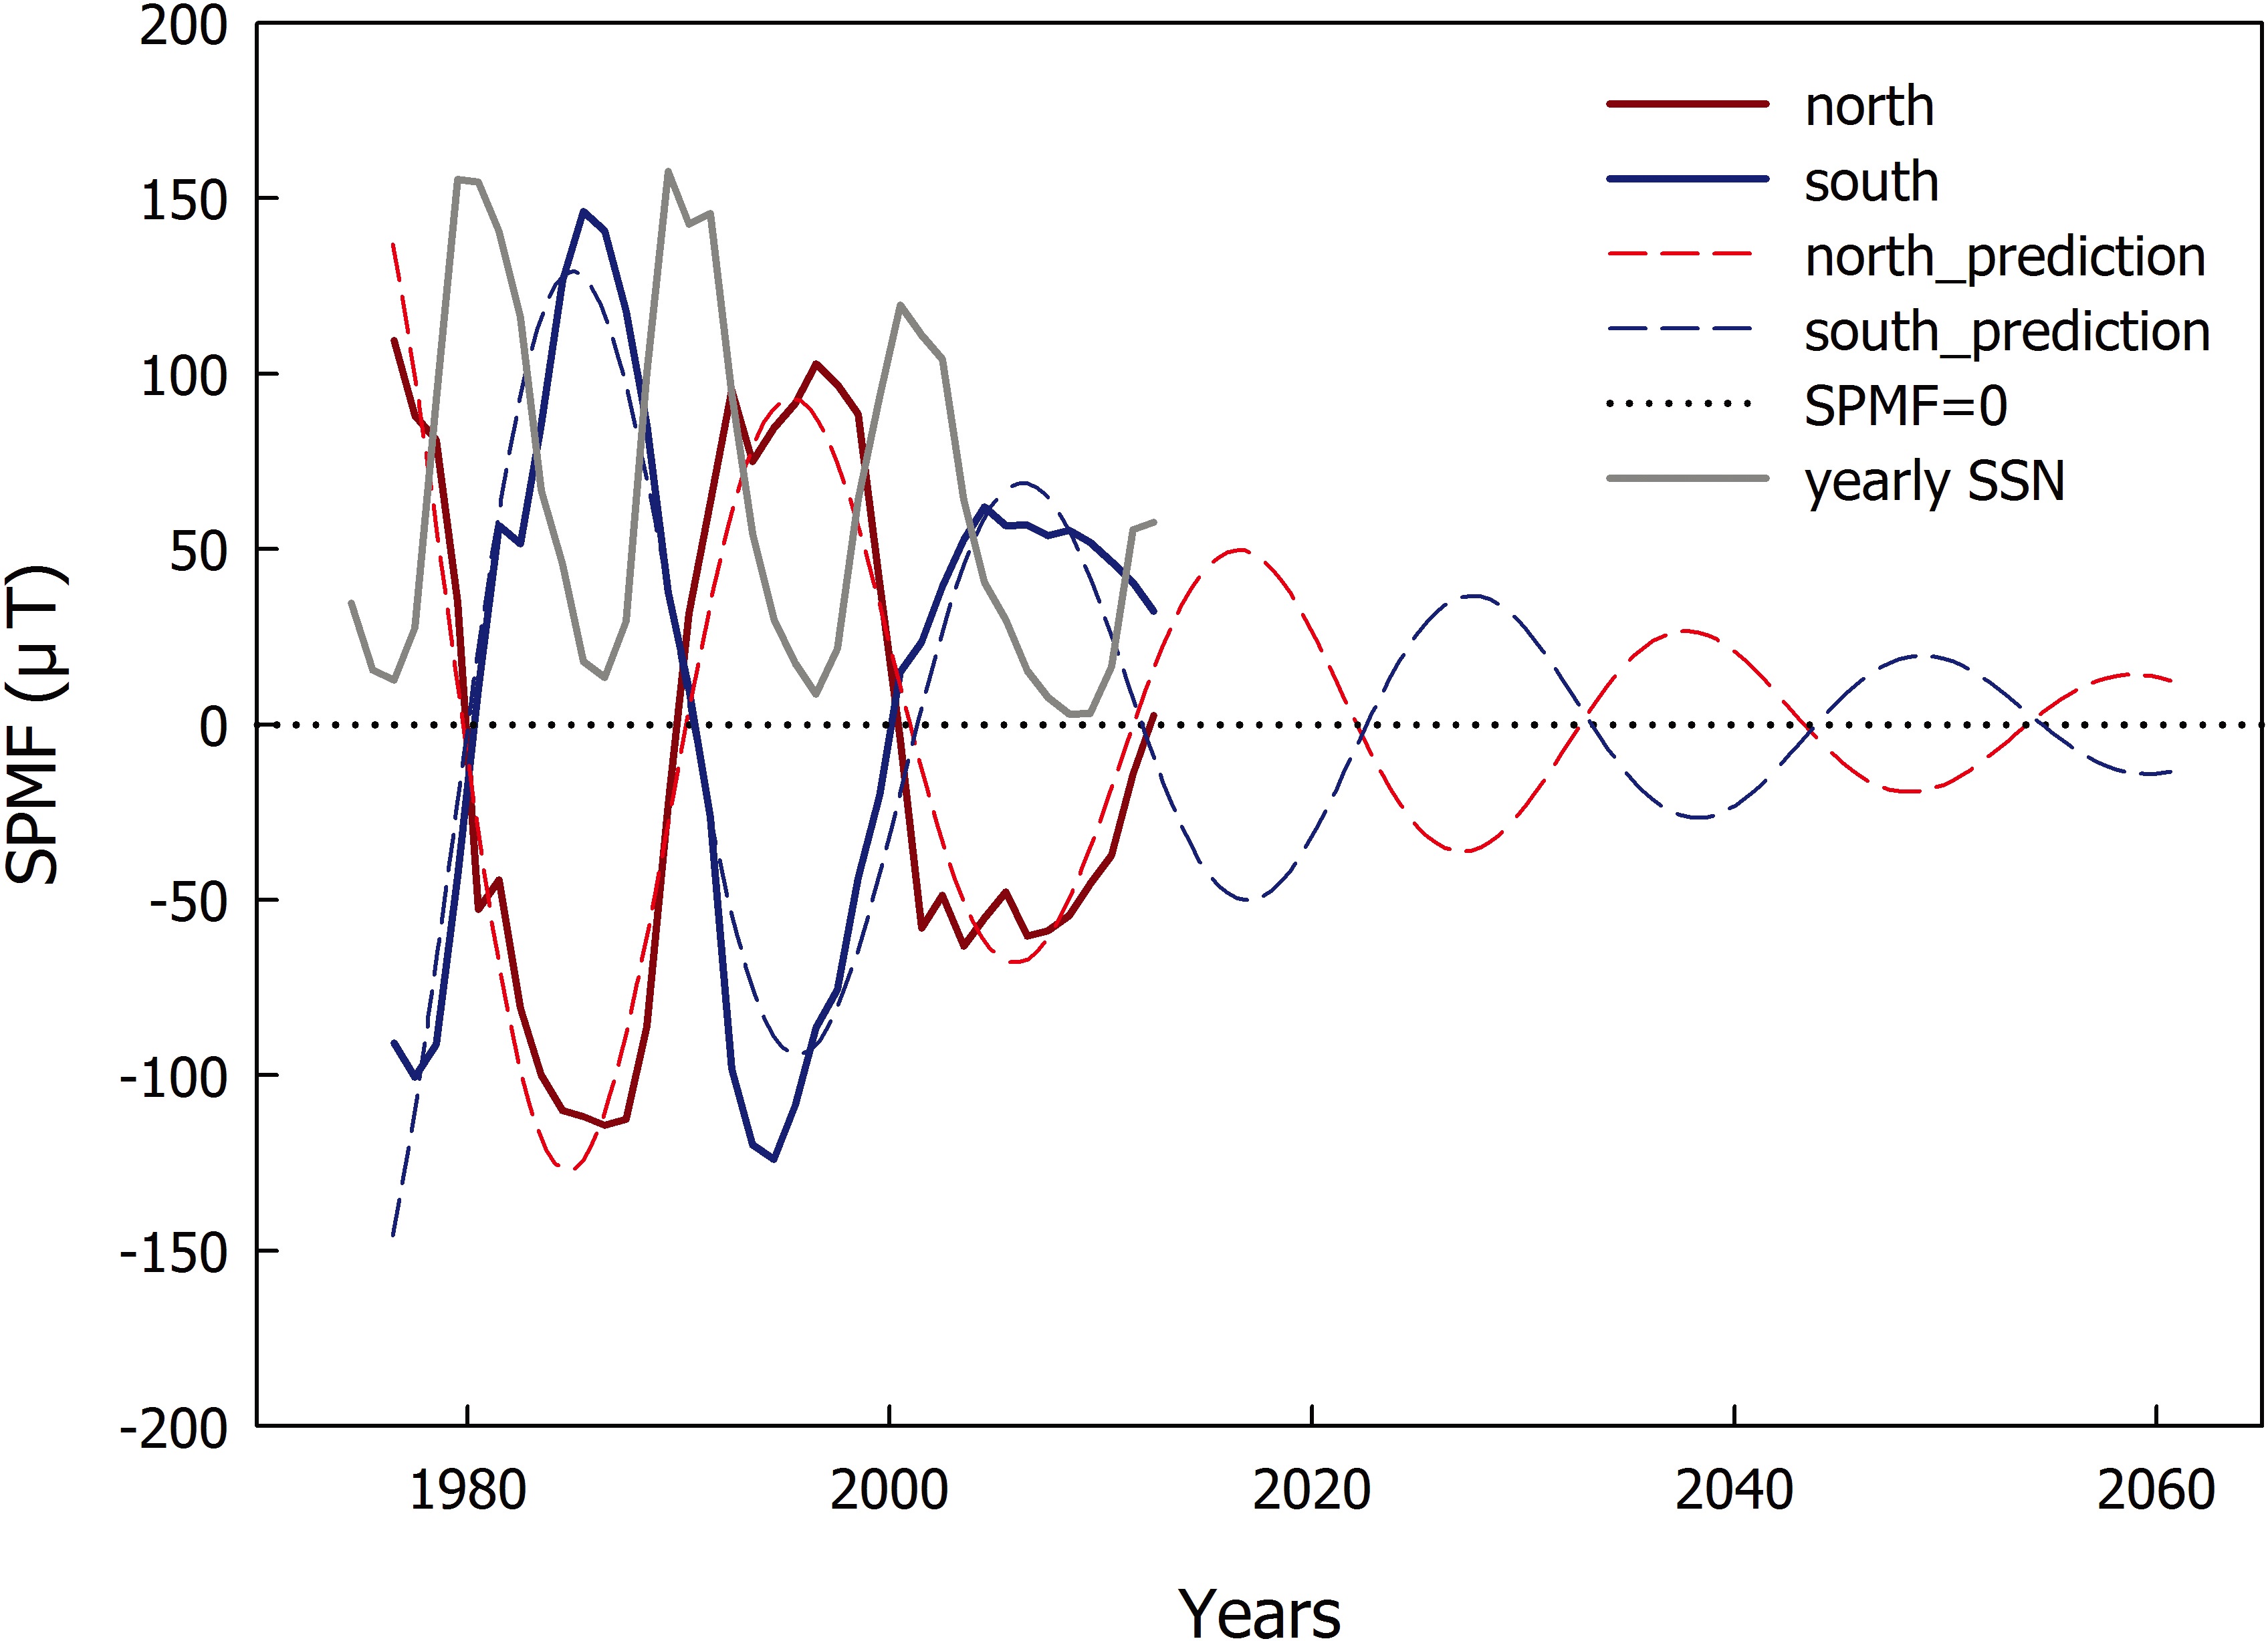
The SPMF magnitude is about half that of recent solar minima through February 2009, and shows the largest decrease among ten SIG parameters, as shown in Table 2 and Fig. 3. It shows the prediction of SPMF magnitude for upcoming solar cycles in the future. The predicted SPMF magnitude agrees fairly well with the damped sine function. This prediction indicates that the SPMF might disappear at the end of a couple of decades, or may reappear with the big
jump in the solar magnetic field.
We examined the solar cyclic variation of ten SIG parameters (SSN, SPMF, SMMF, frequency of solar flare, TSI, 10.7 cm-radio flux, IMF, dynamic pressure of solar wind, GCR intensity, and Ap index) since 1974. The SIG parameters maintain an excessively low status during the solar minimum of solar cycle 23 to 24, as shown in Fig. 1. Of the SIG parameters, the SPMF and IMF magnitudes show markedly low values. These unprecedented conditions of SIG parameters might result from the reduced solar magnetic fields.
Ineson et al. (2011) run an ocean?atmosphere climate model with ultraviolet irradiance variations based on the observation by Spectral Irradiance Monitor satellite. They suggested that the low solar activity, as observed during recent years, drives cold winters in northern Europe and the United States, and mild winters over southern Europe and Canada, with little direct change in globally averaged temperature.
Marsh & Svensmark (2000) reported the changes in the Earth’s cloud cover with 10.7 cm solar flux and cosmic ray
flux. They suggested that the Earth’s cloud cover follows the GCR flux more closely than the 10.7 cm flux, and also suggested that a mechanism linking cloud cover with solar activity will involve changes in ionization properties of the atmosphere rather than incoming TSI. Carslaw et al. (2002) presented the correlation between comic ray flux and low cloud cover. They suggested the cosmic ray-cloud effect : more cosmic rays are associated with more low clouds and lower temperatures. Additionally, Kirkby (2007) suggested potential responses of the climate system to forcing from galactic cosmic rays, assuming they influence cloud cover and droplet number concentration based on three categories of cloud, i.e. aerosols, ice particles, and cloud electricity that may be affected by cosmic rays, whose intensity is modulated by the solar wind.
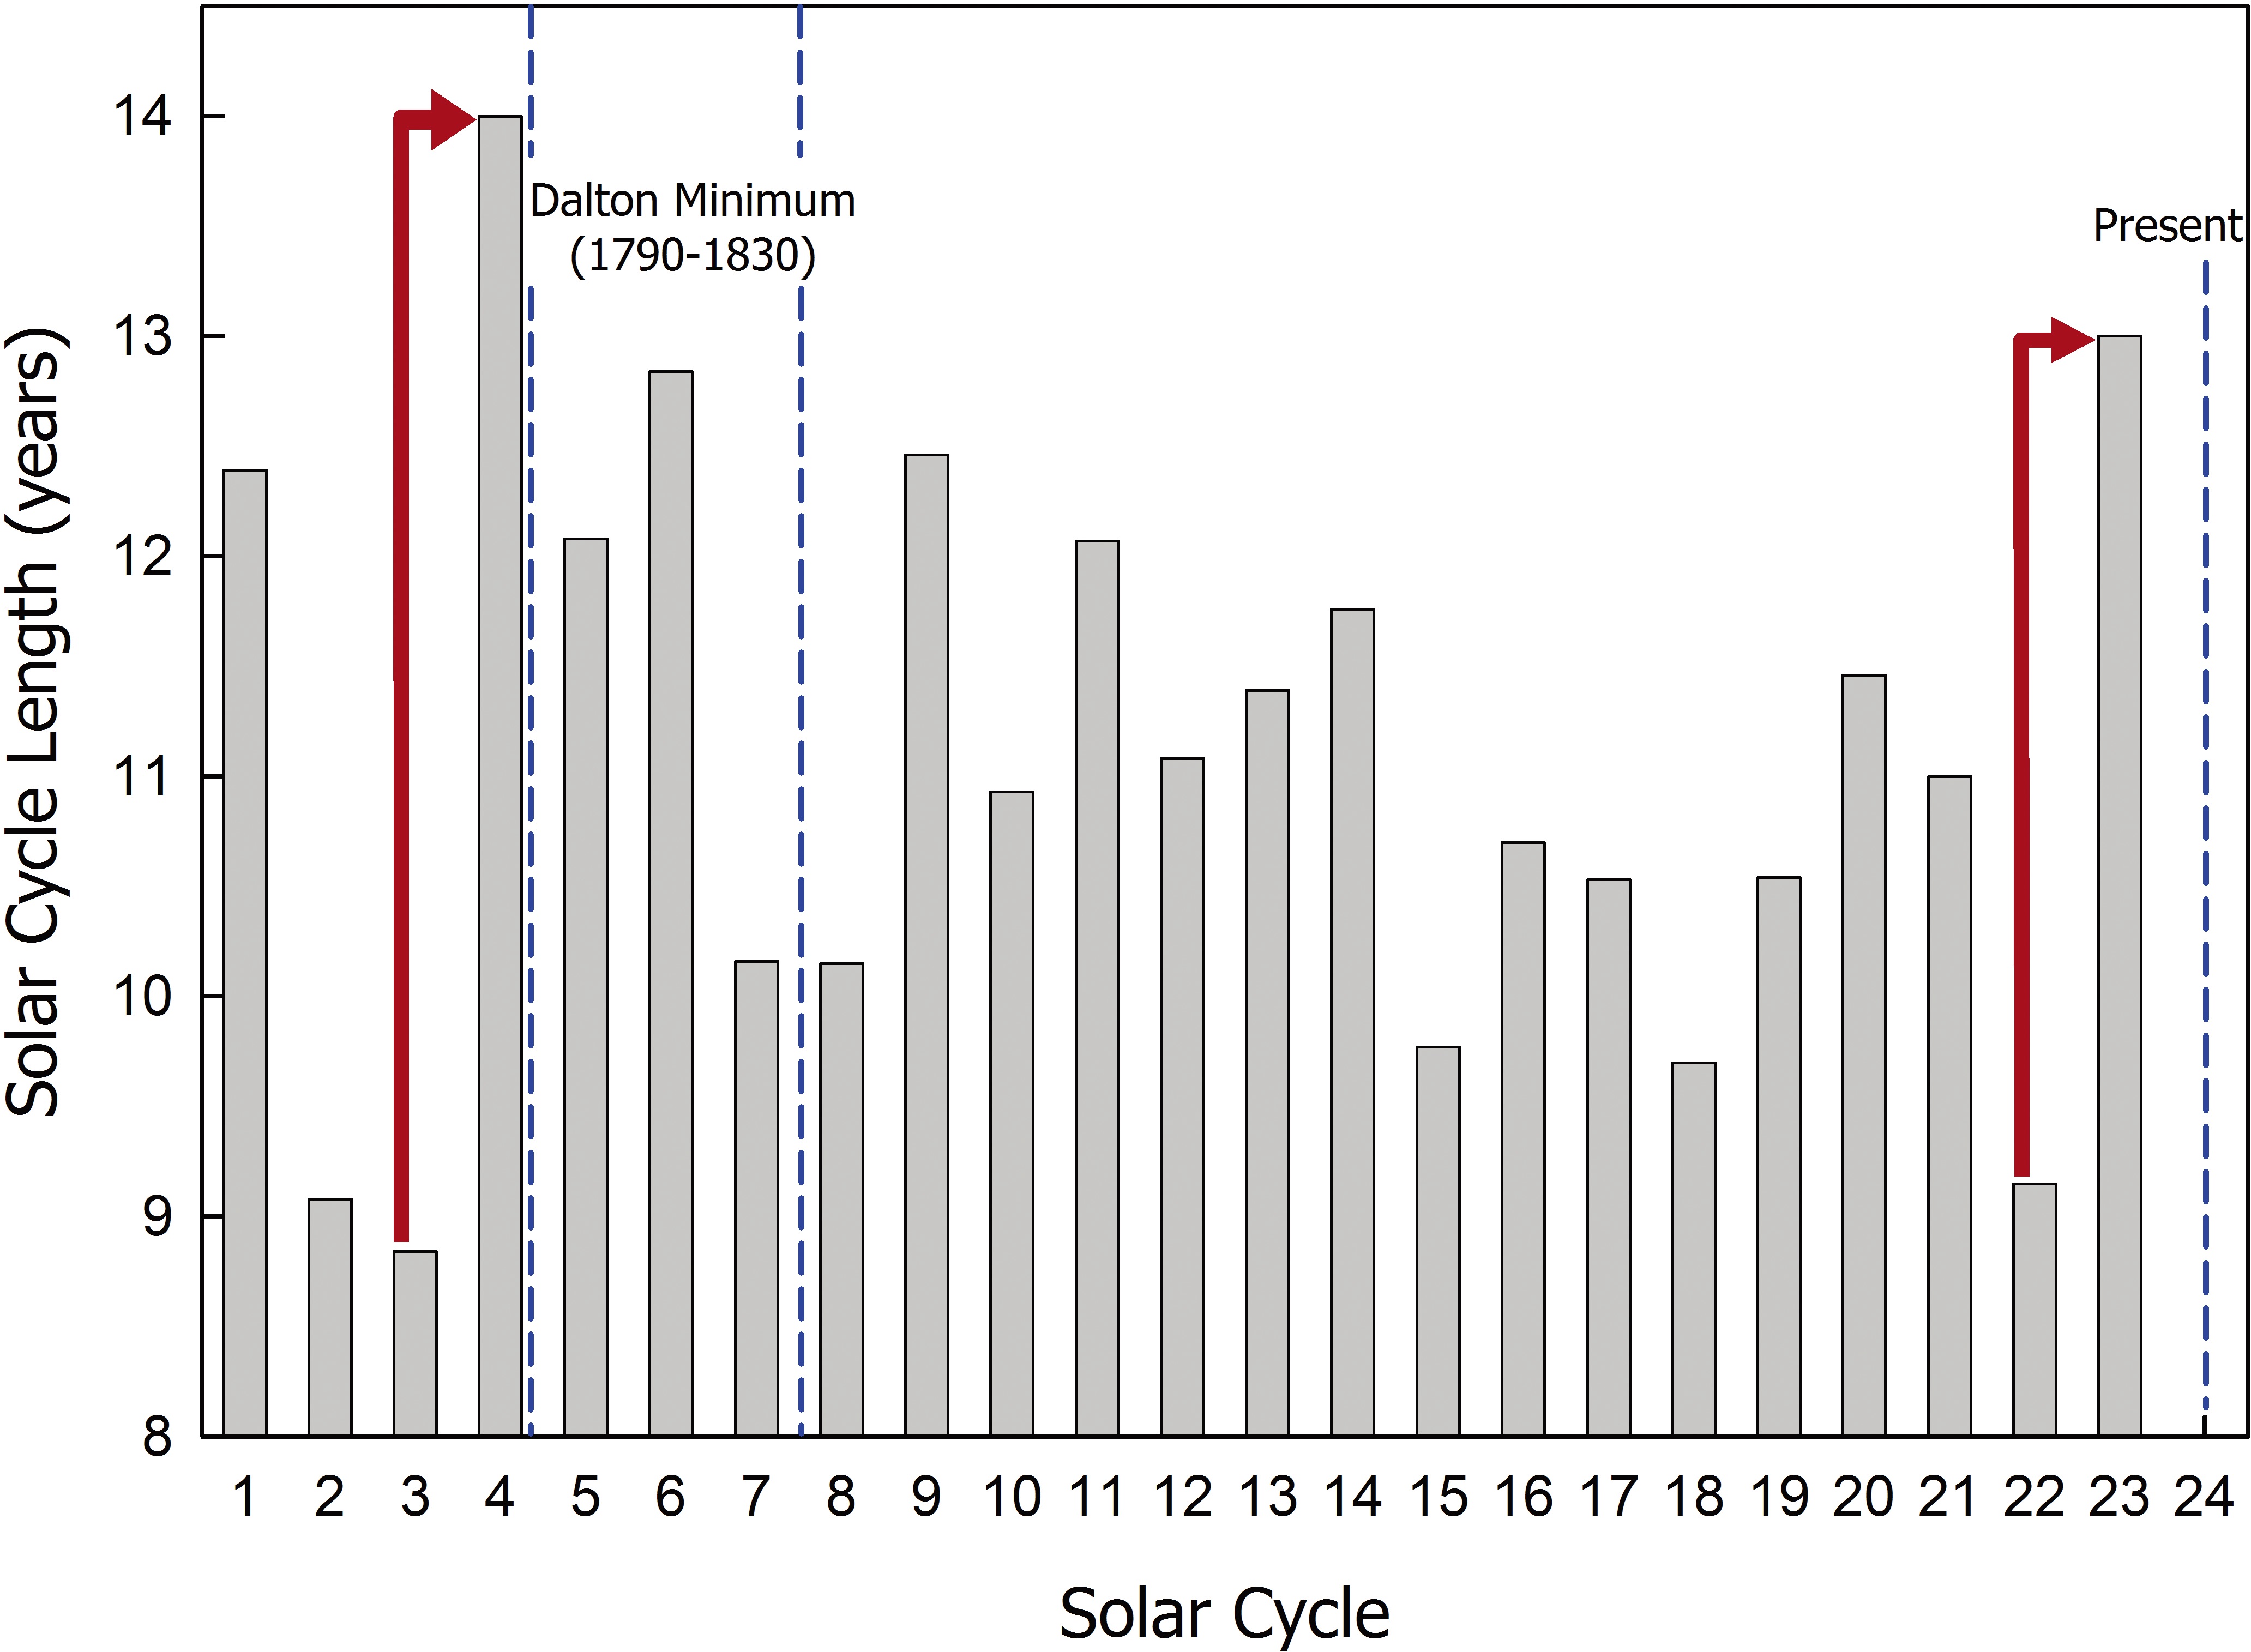
In addition, the solar cycle length has a good reverse correlation with the global surface temperature (Friis- Christensen & Lassen 1991). Fig. 4 shows the solar cycle length variation. Using 3-point averaged monthly SSN, we determined the solar cycle length. When the Dalton minimum starts, the solar cycle length becomes longer after the shorter cycle. A similar phenomenon appears at solar cycle 23. Thus, it may be a sign for the onset of a grand minimum with the cold period.
In further research, it is recommended to examine the polarity of the solar magnetic field consisting of sum total of multipoles such as dipole, quadrupole, hexapole and so on. Using the harmonic coefficients of the solar magnetic field model, we can analyze the trends of each of the multipoles during several solar cycles, which may enable us to understand the variation of solar activity defined by the solar magnetic field, including SIG parameters.