Blue compact galaxies (BCGs) are mostly star-bursting, low-metallicity systems and thought to be analogs of chemically unevolved, star-forming galaxies in the high redshift universe. Typically, they are characterized by blue optical colors as well as strong narrow emission lines that are indicative of recent, intense star formation activity. Therefore, they are ideal targets for many topics related to star formation of galaxies. In the context of understanding how galaxies evolve, stellar mass and metallicity of galaxies are two of the most fundamental information. Chemical enrichment is a record of star formation history, modulated by inflows and outflows of gas, while the stellar mass provides a more straightforward measure of the accumulated conversion of gas into stars. Therefore, study of correlation between these quantities and their evolution with time is key to understand the physical processes which control the star formation activity in galaxies.
Correlations between mass and metallicity or luminosity and metallicity are well-established in galaxies, ranging over orders of magnitude in mass and luminosity in the sense that more massive, luminous galaxies show higher metallicities. For example, the relationship between metallicity and stellar mass has recently been quantified by Tremonti et al. (2004), using an extensive sample of ~53, 000 galaxies from the Sloan Digital Sky Survey (SDSS) at z ~ 0.1. Tremonti et al. (2004) suggest that galaxies form similar fractions of stars independent of their mass. Lower mass galaxies are simply less efficient at retaining gas due to their shallower potential wells and loss of newly produced metals by galactic outflows.
Furthermore, recent studies reveal that galaxies involved in major interactions fall below this mass-metallicity (M-Z) or luminosity-metallicity (L-Z) relation. In other words, the centers of interacting galaxies are under-abundant compared to galaxies of similar mass owing to inflows of metal-poor gas from the outer part of the galaxy (Kewley et al. 2006, Ellison et al. 2008, Rupke et al. 2008, 2010, Peeples et al. 2009). This means that the dynamical process would play an important role in metallicity enrichment.
On the other hand, the interplay of stellar mass and metallicity at different redshifts and their evolution provides important constraints for the galaxy evolution models. Thanks to deep spectroscopic surveys, evolution of the M-Z or L-Z relation has been investigated up to z ~ 3.5 (e.g., Savaglio et al. 2005, Erb et al. 2006, Maiolino et al. 2008). The general result on this is that, at a given mass, galaxies at higher redshift show lower metallicities on average. Recently, Maiolino et al. (2008) presented the M-Z relation at z > 3 using deep near-IR spectroscopy. By comparison with previous results at lower redshifts, they found an evidence of clear evolution of the M-Z relation as a function of redshift. The M-Z relation at z ~ 3.5 shows a much stronger evolution than that at lower redshifts. Furthermore, they also found that the metallicity evolution of low mass galaxies is stronger than that of high mass counterparts, which can be understood in the form of galaxy downsizing scenario.
In order to fully understand the chemical evolution against the mass or luminosity of galaxies, it is crucial to investigate large galaxy sample in wide, complete range of redshift. While many previous studies have concentrated on galaxies at high redshifts (e.g., Maiolino et al. 2008 and references therein) or for those at local Universe of z < 0.1 (e.g., Kewley & Ellison 2008), little work has been done for galaxies in intermediate redshift range (but see Foster et al. 2012). In this paper, we focus on the evolution of the M-Z and L-Z relations and star formation rate of BCGs in the range of z ~ 0.20 - 0.35.
In Section 2, we present our selection of BCG sample using the SDSS data. Through the spectroscopic analysis, we estimate elemental abundance, star formation rates, and galaxy stellar mass. In Section 3, we investigate the evolution of the M-Z and L-Z relations of BCGs. We also examine the M-Z relation according to the morphology of galaxy which provides a constraint of chemical properties of galaxies in the aspect of environmental effect.
2. SAMPLE SELECTION AND ANALYSIS
We selected a sample of BCGs in the redshift range of 0.20 < z < 0.35 from the Sloan Digital Sky Survey (SDSS) Data Release 7 (DR7) data (Abazajian et al. 2009). As a first step, 423 galaxies were selected adopting photometric
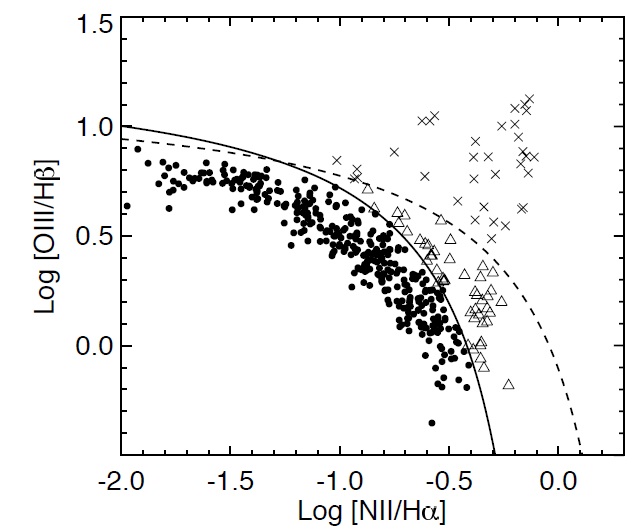
and spectroscopic criteria. They show visually compact morphologies in a concentration index range of 1.8 < R90/R50 < 3.0 and blue colors in color range of 0.10 < g?r < 1.32 and -1.70 < r?i < 0.35. At the same time, they also exhibit strong [OIII]λ5007 emission line with its S/N higher than 20. Next, we considered only galaxies which locate the region of star forming galaxies and are well separated from active galactic nuclei (AGN) in the diagnostic BPT diagram (Baldwin, Phillips, & Terlevich 1981). In Fig. 1, solid line separates HII type star forming galaxies from composite galaxies taken from the Kauffmann et al. (2003). The dashed line is the theoretical upper limit of star forming galaxies from Kewley et al. (2001). Finally, we have selected 343 star forming BCGs (filled circles) as those lying below the division of Kauffmann et al. (2003), separated from 46 composite (open triangles) and 34 AGN galaxies (crosses).
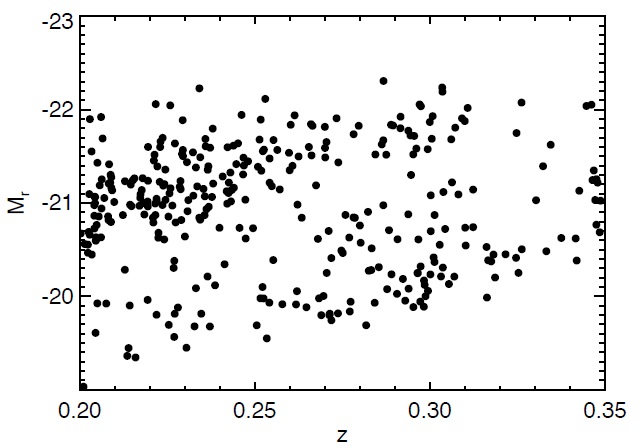
In Fig. 2, we present absolute r-band magnitudes of our BCGs against their redshifts. While a small fraction of faint (Mr > -20) galaxies appear to be preferentially observed in the low redshifts, the majority of sample galaxies are well confined in the luminosity range of -22.0 < Mr <-20.0. Furthermore, no significant, systematic difference of luminosity distribution between different redshift bins is found within redshift range of our sample.
Using the IRAF splot task, we measured the fluxes of the emission lines of each galaxy by fitting a Gaussian profile. Foreground reddening correction to the line intensities was applied following Lee & Skillman (2004). Using the Balmer decrement method (Izotov et al. 1994), the observed line intensities were also corrected for both internal reddening and underlying stellar absorption. The gas-phase abundance of oxygen for all BCG sample was derived by the Ne3O2 (= log ([NeIII]λ3869/[OII]λ3727) empirical method (Shi et al. 2007). Using the direct method, we also derived oxygen abundance of 91 BCGs with a well detected [OIII]λ4363 emission line using the STSDAS nebular/ionic task. We corrected unobserved ionization stages using the ionization correction factors from Izotov et al. (2006), and then estimated the total oxygen abundance.
From the GALEX GR6 data, 93 BCGs are detected in the far-ultraviolet (FUV; 1350-1750A) band. The FUV flux is taken from the GALEX pipeline data. Based on the reddening law of Cardelli et al. (1989), Galactic extinction was corrected using the E (B-V) value from the NED. The internal reddening coefficient C(Hβ) was derived from the SDSS spectrum and its absorption was determined from A (FUV) = 8.19 × E (B-V) = 5.72/C (Hβ).
We derive the Hα and FUV star formation rate (SFR) of our BCGs using the relations given by Kennicutt (1998). For the Hα SFR, the total Hα flux was estimated using the ratio between Petrosian radius and 3 arcsec SDSS aperture fluxes in the i-band surface photometry. We have also quantified the stellar mass of BCGs using the STARLIGHT code (Cid Fernandes et al. 2004, 2005, Mateus et al. 2006). We fitted the observed spectral energy distribution of the galaxies with a combination of 150 multiple simple stellar populations (6 metallicities of Z = 0.005 - 2.5 and 25 ages of 1 Myr - 18 Gyr) from the evolutionary synthetic models of Bruzual & Charlot (2003). The Padova stellar evolutionary tracks (Alongi et al. 1993, Bressan et al. 1993, Girardi et al. 1996) and Chabrier (2003) initial mass function were adopted. From the distribution of mass fractions for stellar
populations with different ages, we have estimated the total mass of each galaxy.
3.1 The Mass-Metallicity and Mass-SFR Relations
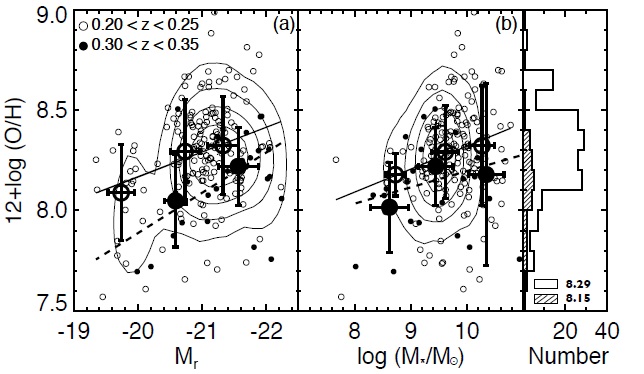
In Fig. 3, we present the L-Z and M-Z relations of our BCGs. The oxygen values are those obtained from the empirical method. The relations follow general trend in the sense that luminous, massive galaxies are characterized by higher metallicities compared to faint, lower mass ones. Additionally, in Fig. 3, we compare the L-Z and M-Z relations of galaxies at different redshift ranges of 0.20 < z < 0.25 (open circles) and 0.30 < z < 0.35 (filled circles). We also present our fit to the distribution of sample galaxies at different redshift ranges (solid and dashed line for BCGs at low z and high z, respectively). It is interesting to note that a hint of evolution of the L-Z and M-Z relations with redshift is observed. At a given luminosity and mass, galaxies at high redshifts appear to be biased to lower metallicities than the low redshift counterparts. The mean difference of O/H values between two subsamples is clear (about 0.15 dex, see also histograms in Fig. 3). A K-S test on the O/H distributions between two subsamples yields a probability of 2.5% for the same parent distribution. Since our BCGs are star-bursting system, note that this observed trend should be the evolution of the L-Z and M-Z relations of galaxies
[Table 1.] Luminosity-Metallicity and Mass-Metallicity Relations for Blue Compact Galaxies.
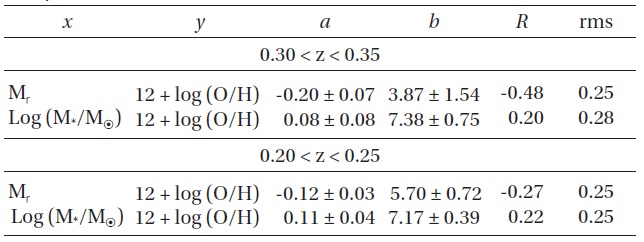
Luminosity-Metallicity and Mass-Metallicity Relations for Blue Compact Galaxies.
mainly contributing the star formation density at each redshift (Maiolino et al. 2008). In Table 1, we present the main relations of L-Z and M-Z for subsamples in different redshift ranges.
Since it has been known that SFR depends on the galaxy mass and, at the same time, metallicity enhancement is concomitant with global star formation activity (Gavazzi et al. 2002, Brinchmann et al. 2004, Papovich et al. 2006), it is intriguing to examine the star formation activity of our BCGs according to their luminosities and masses. The Hα emission line and UV flux are two fundamental SFR indicators which trace star formation activity in different timescale. The Hα emission is from ionized gas by the most massive O and early B type stars. Therefore, this traces star formation over a few million years. On the other hand, the UV flux is from stellar continua of less massive populations from O to late-type B stars, and indicates star formation over a few hundred Myr timescale (Kennicutt 1998).
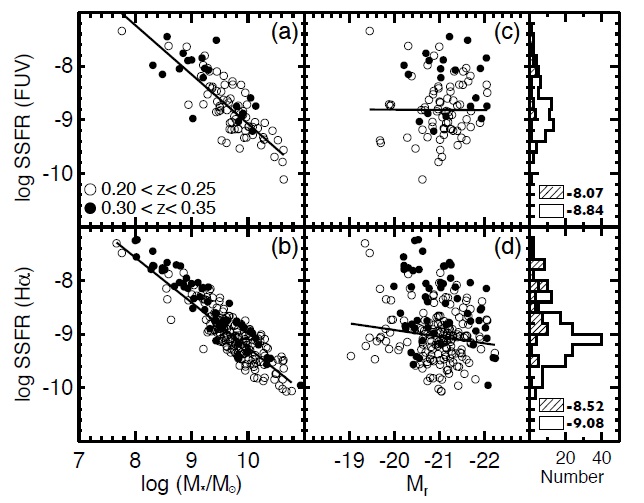
Fig. 4 shows the specific star formation rates (SSFRs) derived from Hα emission line and FUV flux as a function of the stellar mass and luminosity. The SSFR is defined as the SFR per unit stellar mass. We also compare galaxies at different redshift ranges of 0.20 < z < 0.25 (open circles) and 0.30 < z < 0.35 (filled circles). One distinct result is that low mass galaxies show higher SSFRs than more massive ones. This supports a scenario in which massive galaxies formed most of their stellar populations earlier on shorter timescales and, therefore, have low gas fractions, while low mass galaxies evolve on longer timescales (Erb et al. 2006, Reddy et al. 2006, Noeske et al. 2007a,b). Another interesting feature is that there is a difference of SSFR between galaxies at different redshift ranges. At a given mass and luminosity, galaxies at higher redshifts show a tendency toward higher SSFR relative to the lower redshift sample (see also histograms). The median difference of SSFR values between galaxies at different redshift ranges is very pronounced by about 0.5~0.8 dex which is in good agreement with those for
galaxies with z > 0.2 (Noeske et al. 2007a). The K-S tests on the SSFR (Hα) and SSFR (FUV) distributions between two subsamples yield probabilities less than 0.1% for the same parent distribution.
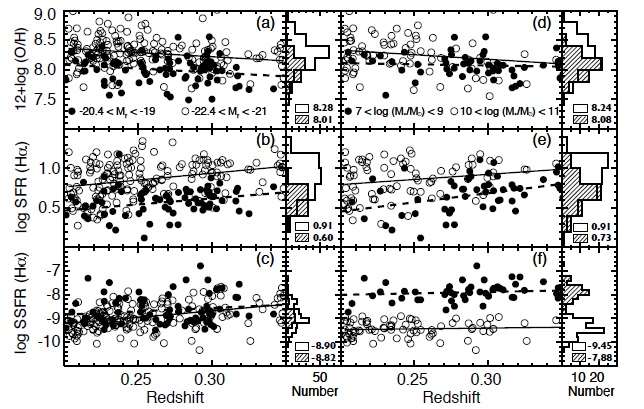
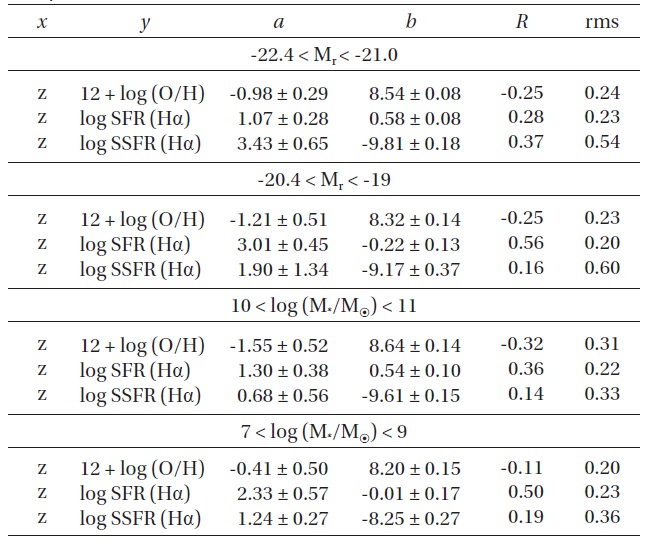
Fig. 5 highlights a redshift evolution of O/H ratio, SFR (Hα), and SSFR (Hα) of our BCG sample in two different luminosity (Fig. 5a, b, c; luminous vs. faint galaxies) and mass ranges (Fig. 5d, e, f; massive vs. low mass galaxies).
[Table 2.] Redshift vs. O/H ratio, SFR (Hα), and SSFR (Hα) Relations for Blue Compact Galaxies.

Redshift vs. O/H ratio, SFR (Hα), and SSFR (Hα) Relations for Blue Compact Galaxies.
In Fig. 5, average metallicity, SFR, and SSFR are well correlated with redshift in the sense that metallicity decreases monotonically, but SFR and SSFR appear to rise with redshift. The additional interesting feature in Fig. 5 is the difference of metallicity, SFR, and SSFR between BCGs in different mass and luminosity bins (see also histograms). At a given redshift, luminous, more massive BCGs show systematically higher metallicity and SFR than faint, lower mass counterparts. On the other hand, the SSFRs of more massive BCGs are typically lower than those of lower mass ones over the redshift. The K-S tests for all panels of Fig. 5 but for Fig. 5c (probability of 6.4%) yield probabilities less than 0.1% for the same parent distribution. In Table 2, we present the main relations of O/H ratio, SFR (Hα), and SSFR (Hα) for subsamples in different luminosity and mass ranges.
It has been recognized that galaxy interactions and mergers may play an important role in the evolution of galaxies in terms of their morphology, internal kinematics, and star formation. While there have been many studies on the effects of interactions and mergers, much less work has been done on the evolution of metallicity. Specifically, gas phase metallicity provides an important constraint on the correlation between gas flows and star formation as well as on the dating of merger or interaction event. In this regard, the clue to the nature of the chemical properties
and star formation activity of galaxies comes from a careful examination of the morphology as a measure of interactions and mergers between galaxies.
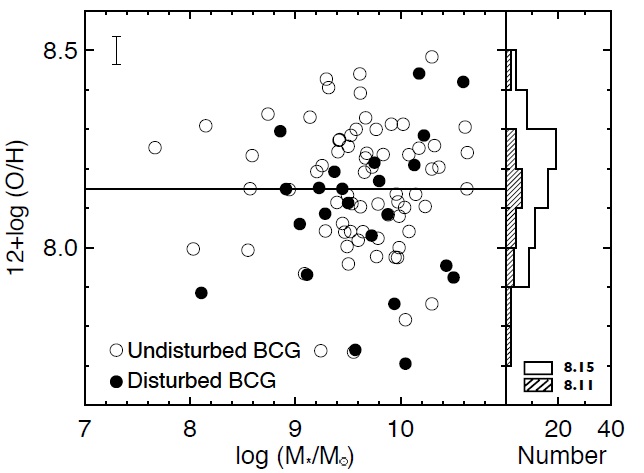
By careful visual inspection of SDSS g, r, i combined images, we classified each galaxy as either disturbed or undisturbed one. We classified disturbed BCGs as those with asymmetric, distorted outer light distribution and/or double cores which are indicative of merger remnants or recent disturbance by tidal interaction. Undisturbed BCGs show compact morphologies with relatively round shape. Fig. 6 shows the M-Z relation according to the morphologies of BCGs. In this plot, we used the metallicity derived from direct method in order to avoid uncertain values of empirical method which may hamper the discrimination of subtle metallicity difference between galaxies. While it is difficult to state that there is a significant difference of metallicity distribution between disturbed and undisturbed BCGs, it is worth noting that a large fraction of the disturbed BCGs (filled circles) appear to be biased towards low O/H values. The difference of mean values of disturbed and undisturbed BCGs is about 0.05 dex (see also histograms in Fig. 6), which is valid in 1σ significance considering mean O/H measurement error of 0.04 dex. A K-S test yields a probability of 32.6% that O/H distributions between two subsamples are drawn from the same parent sample. Given that the disturbed BCGs are formed from a merging or interaction between galaxies, our result is in agreement with
previous observational and theoretical studies (Rupke et al. 2008, 2010, Bekki 2008, Ekta & Chengalur 2010, Kewley et al. 2010, Montuori et al. 2010): the low metallicity could be resulted from gas dilution due to the inflow of metal-poor material from the galaxy outskirts via interaction or merging event.
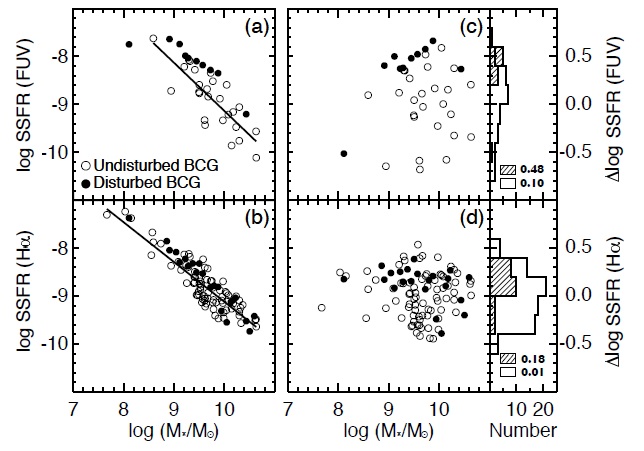
In Fig. 7, we compare the SSFR derived from Hα emission line and FUV flux between disturbed (filled circles) and undisturbed (open circles) BCGs as a function of the stellar mass. The disturbed BCGs show systematically higher SSFR than undisturbed ones at a given mass. The histograms in Fig. 7 show the distributions of ΔSSFR of two subsamples, which is defined as observed value minus value from least square fitting line of undisturbed BCGs (solid line) at a given mass. This provides a measure of the excess or deficiency of SSFR as a function of stellar mass. In the histograms, the difference of SSFR between disturbed and undisturbed BCGs is evident (0.4 dex and 0.2 dex difference in SSFR (FUV) and SSFR (Hα), respectively). The K-S tests yield probabilities of 0.14% and 18.9% for SSFR (FUV) and SSFR (Hα), respectively, that distributions between two subsamples are drawn from the same parent sample. This is consistent with observational results which suggest that mergers and interactions between galaxies trigger the enhanced star formation activity in the evolution of galaxies (e.g., Mendez & Esteban 2000, Ostlin et al. 2001, 2004, Johnson et al. 2004, Bekki 2008).
We have presented studies on the gas metallicity and SSFR of sample of 343 BCGs at 0.20 < z < 0.35. First of all, we confirm that a general trend of the L-Z and M-Z relations of our BCGs in the sense that luminous, massive galaxies show systematically higher metallicities than faint, lower mass ones. Other interesting feature is that, at a fixed luminosity and mass, galaxies at higher redshifts are biased to low metallicities relative to the lower redshift counterparts. In the correlation between SSFR and mass, lower mass galaxies show higher SSFRs than more massive ones. Furthermore, we find that there is a difference of SSFR between galaxies at different redshift ranges. At a given mass and luminosity, galaxies at higher redshifts are biased to higher SSFR relative to the lower redshift sample.
Although our sample BCGs are restricted to a narrow redshift range (z ~ 0.20 - 0.35), we confirm that the metallicity evolution is also clearly seen at intermediate redshift, while this evolution is much stronger and faster at higher redshifts (Maiolino et al. 2008). Our results directly expand the previous ones in terms of the global decline of SFRs in galaxies with time and the strong dependence of galaxy evolution on the stellar mass (e.g., Perez-Gonzalez et al. 2005, Noeske et al. 2007b, Damen et al. 2009). Furthermore, the mass dependent evolution of the metallicity and SFR can be explained in the context of the galaxy downsizing scenario (Cowie et al. 1996): i.e., the major epoch of star-formation occurs earlier and over a shorter period in the massive galaxies and progressively later and over more extended timescale towards lower mass galaxies. In this case, while luminous, massive galaxies reach high metallicities at high redshift and show low SFR per unit mass at current epoch, low mass systems enrich their metallicities with high SFR per unit mass extending to the current epoch.
In the scheme of morphology of BCGs which is linked to the star formation activity triggered by neighbor galaxies, we examined the properties of BCGs depending on their morphologies. By classifying our BCGs into disturbed or undisturbed ones, we have compared metallicity and SSFR between two subsamples. In the M-Z relation, we find a hint that morphologically disturbed BCGs exhibit low O/H values and high SSFRs compared to undisturbed counterparts. The low metallicity in disturbed BCGs might be resulted from mergers and/or interactions which could induce low O/H values in disturbed BCGs due to infall of metal-poor gas from the galaxy outskirts (Rupke et al. 2008, 2010, Peeples et al. 2009, Kewley et al. 2010). Furthermore, disturbed BCGs might have undergone active star formation through mergers and/or interactions between two galaxies, and star formation is continuously enhanced by newly formed massive stars (e.g., Bekki 2008). Most recently, Chung et al. (2013) infer that disturbed BCGs show different recent star formation histories to those of undisturbed ones in which disturbed BCGs have undergone star formation over relatively longer timescales. Consequently, we confirm that the gas metallicity and SFR of BCGs are closely related with galaxy morphology and dynamical event would play an important role in the chemical evolution and star formation histories of BCGs.


![O/H vs. stellar mass diagram of disturbed (filled circles) and undisturbed (open circles) BCGs. The solid line indicates the median O/H value of undisturbed BCGs as a guideline. The histograms show the distributions of O/H values of two subsamples (solid and hatched histogram for undisturbed and disturbed BCGs, respectively). Error bar at the upper left corner indicates the mean value of O/H errors which are estimated from propagation of the uncertainty of electron temperature based on [OIII]λ4363 line. The median O/H values of undisturbed and disturbed BCGs are indicated in the histogram.](http://oak.go.kr/repository/journal/12059/OJOOBS_2013_v30n1_59_f006.jpg)