The Pacific oyster
Changes in the levels of ATP-related compounds and organic acids were observed in the shucked oysters that had been stored in salt water at 3℃ for 10 days (Tanimoto et al., 2004). The most useful freshness indicators for whole-body shucked oysters are the adenylate energy charge, defined as (ATP + ½ADP)/(ATP + ADP + AMP), and the levels of succinic and acetic acids. Acetate was the best freshness indicator for the adductor muscle. The flesh of marine bivalves contains high levels of nonprotein nitrogenous compounds (Konosu and Yamaguchi, 1982) including free amino acids (FAAs). FAAs are abundant in shellfish and are important contributors to their bioactivity and meaty flavor (Hashimoto, 1965; Wu, 2009, 2010). In addition, in many bivalves, including oysters, the relative levels of these compounds change in response to changes in osmotic pressure and/or anaerobic conditions due to habitat fluctuations (Lynch and Wood, 1966; Kluytmans et al., 1977; Heavers and Hammen, 1985; Isani et al., 1995; Enomoto et al., 1996; Hosoi et al., 2003; Rafrafi and Uglow, 2009).
To date, changes in FAA levels in live shellfish have been reported for scallops (Enomoto et al., 1996), hard clams (Chiou et al., 1998), and small abalones (Chiou et al., 2002). Murata and Sakaguchi (1986) also showed changes in the levels of FAAs, trimethylamine, and nonprotein nitrogen in the bodies and adductor muscles of shucked oysters that were stored on ice but not soaked in seawater. Specifically, taurine and glycine levels showed little change, alanine levels increased slightly, and proline and glutamic acid levels in whole-body oysters decreased during storage. However, changes in FAA levels in shucked oysters that had been soaked in salt water remained unclear.
With respect to nutritional reserves, carbohydrates play an important role in the energy production of most bivalves (Zandee et al., 1980; Uzaki et al., 2003; Patrick et al., 2006). Glycogen is the most important compound for energy production, and it is used by several shellfish under anaerobic conditions (Ogunsua et al., 1990; Isani et al., 1995; Chiou et al., 1998). Thus, glycogen is likely utilized by shucked oysters during cold storage.
The current study examines changes in FAA levels in whole-body oysters and in the adductor muscles of oysters stored at 3℃ under the general shipping conditions used for shucked oysters up to the best-before date (7 days). Changes in glycogen content, water content, and whole-body weight were also monitored.
>
Preparation of the shucked oysters
Fifty shelled oysters were purchased from an oyster farmer in Ainan-cho, Ehime Prefecture, Japan. The oysters were prepared by a technician skilled in shucking oysters and transferred on ice to the laboratory within 1 h.
Whole-body shucked oysters were rinsed with ice-cold seawater. Two or five oysters were inserted into plastic bottles (100 mL) with an equal weight of ice-cold seawater. This is a common means of storage in Japanese commercial markets. The bottles were stored at 3 ± 2℃ for 7 days.
Five grams of chopped whole-body shucked oysters from four individuals, and 2.5 g of chopped adductor muscle from six individuals, were used for amino acid analyses. The samples were homogenized with 10 mL and 5 mL of 10% trichloroacetic acid (TCA), respectively, followed by centrifugation at 10,000
The glycogen content of the oyster samples was measured as described previously (Da Silva and Zancan, 1994; Okumura et al., 2002). A 2.5-g sample of chopped flesh obtained from four shucked oysters was homogenized with 5 mL of 30% KOH in a centrifugation tube. The tube was heated in a water bath (SJ-10; Taitec Co., Ltd.) until the oysters dissolved. After the tube was cooled, 10 mL of ethanol was added to the dissolved sample. Glycogen that had flocculated in the tube was separated by centrifuging the sample at 3,000
>
Moisture content of the shucked oysters
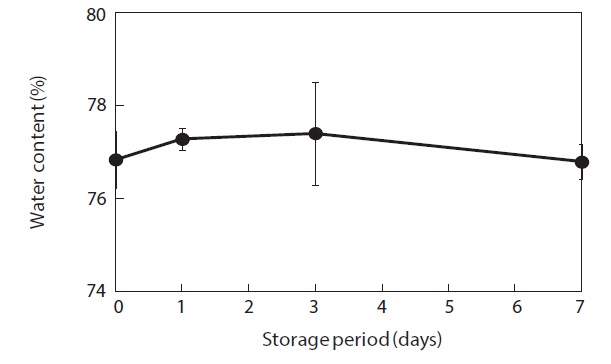
Approximately 2.5 g of chopped flesh from the whole bodies of four oysters was used to determine moisture content. Water content was measured by comparing the wet weight to the constant weight obtained after oven-drying at 120℃ (Hosoi et al., 2003).
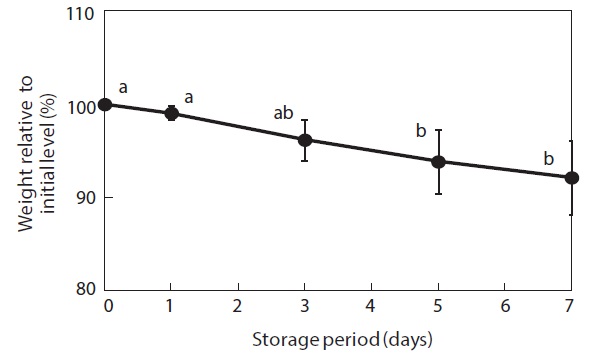
Five bottles, each containing two shucked oysters, were used to measure the weight of the shucked oysters. Weight was measured throughout the storage period by withdrawing the oysters and draining the surrounding salt water. Changes in weight are expressed as a percentage of the initial weight.
>
Salinity of the salt water used for soaking
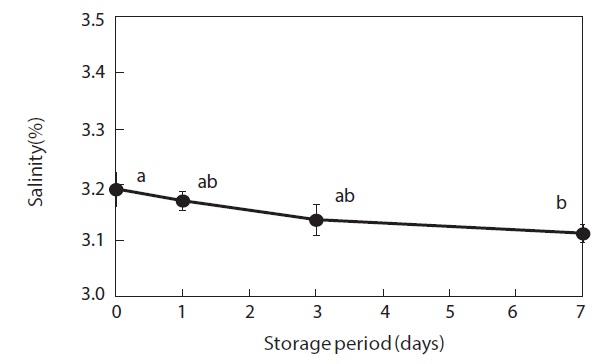
The chloride ion content of the salt water used for soaking the shucked oysters during storage was determined by Mohr’s volumetric method (Blaedel and Meloche, 1960). Salinity was calculated based on the concentration of chloride ions.

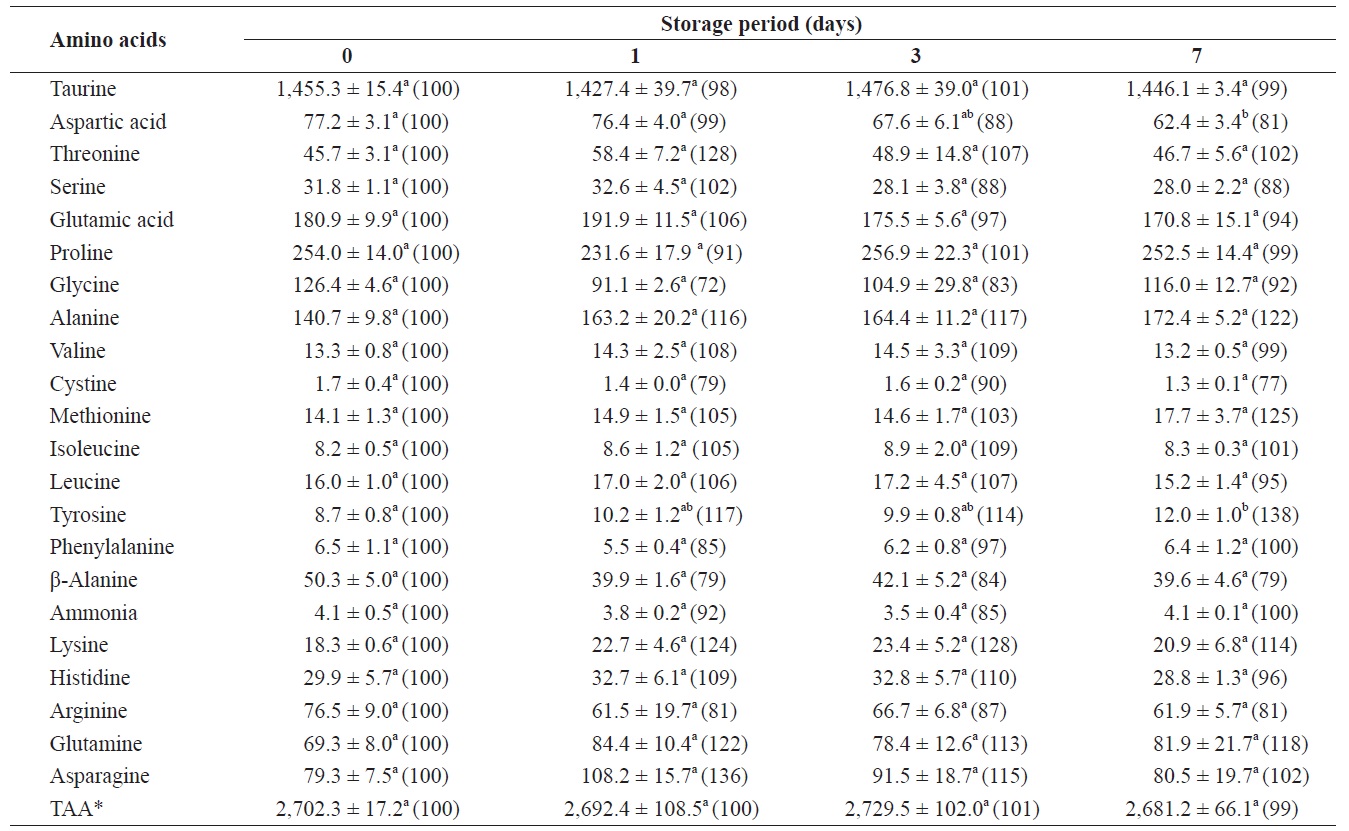
Changes in free amino acids and ammonia in the whole body of shucked oyster during storage at 3℃ (mg /100 g)
All measurements were performed independently on three specimens with the exception of weight change, which was determined using five specimens. Analyses were performed using Excel Tokei 2010 statistical software (SSRI Co. Ltd., Tokyo, Japan). Tukey’s multiple range tests were applied to evaluate the significance of differences among the mean values. The significance level was set to 5% in all analyses.
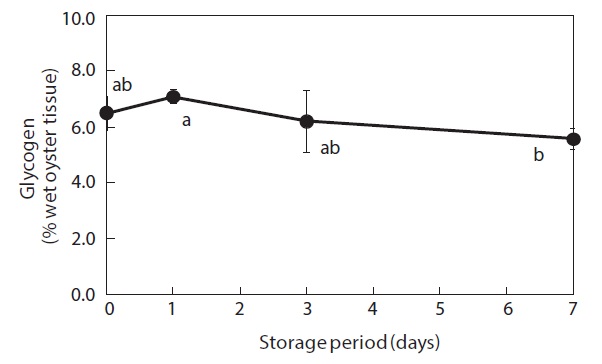
Glycogen content of the whole-body oysters changed during the storage period (Fig. 1). Prior to storage, the mean glycogen level was 6.5%. After 7 days of storage, the glycogen level had dropped significantly to 5.6%.
The total amount of FAAs before storage was 2,702.3 mg/100 g of whole-body oyster (Table 1). The whole body contained relatively high levels of taurine, proline, glutamic acid, alanine, and glycine, which were 1455.3, 254.0, 180.9, 140.7, and 126.4 mg/100 g, respectively. Changes in ammonia levels were not significant and among the FAAs only aspartic acid, tyrosine, and alanine showed any evidence of change.
After 7 days of storage, levels of aspartic acid and tyrosine significantly decreased and increased, respectively. Alanine levels increased by 122% (

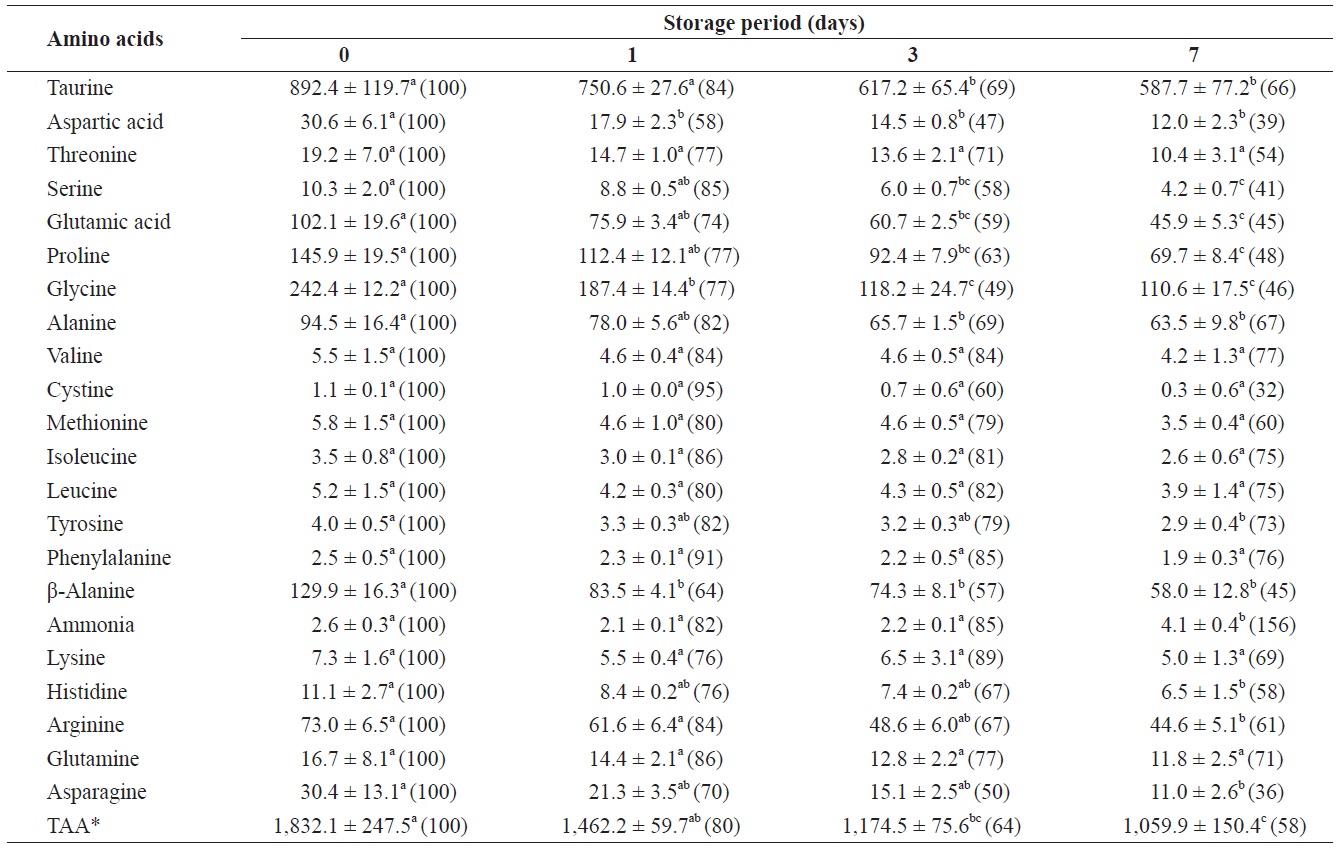
Changes in free amino acids and ammonia in the adductor muscle of shucked oyster during storage at 3℃ (mg/100 g)
mg/100 g (Table 2). The total amount of FAAs in the adductor muscle decreased significantly throughout the storage period. All FAAs in the adductor muscle decreased to less than 80% of their initial levels after 7 days of storage. These reductions were statistically significant (
Ammonia and most of the FAAs were detected in the surrounding water after 7 days of storage at 3℃ (Table 3). Of these, taurine was the most abundant (370.6 mg/100 g) followed by β-alanine, glutamic acid, and alanine, in that order. These FAAs were also abundant in the whole body and adductor muscle prior to storage.
[Table 3.] Free amino acids and ammonia in the soaking water after 7 day storage at 3℃
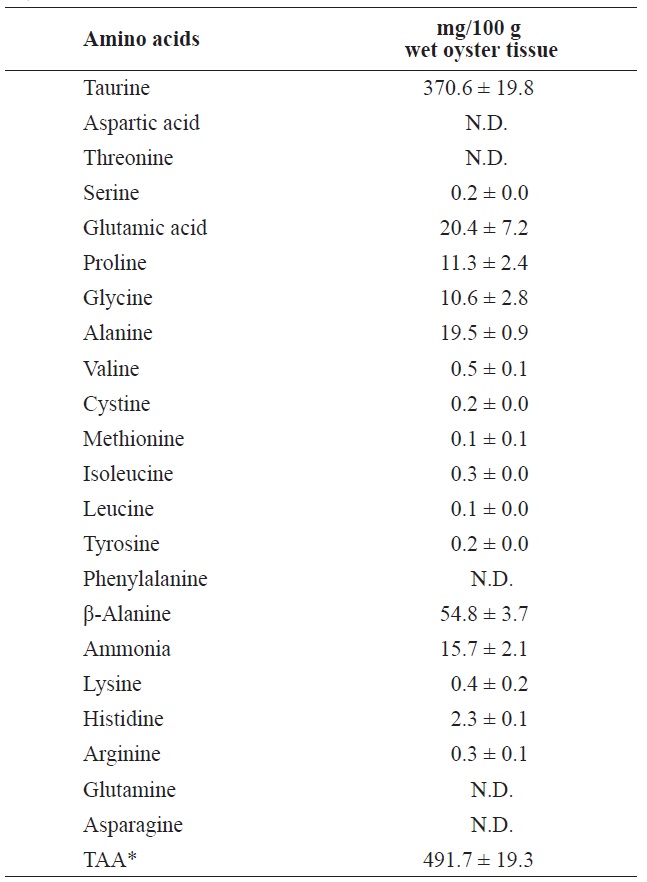
Free amino acids and ammonia in the soaking water after 7 day storage at 3℃
Moisture content and weight of the shucked oysters changed during storage at 3℃ (Figs. 2 and 3). Water content of the whole-body oysters remained relatively constant during the storage period while the whole-body weight decreased significantly. The mean individual body weight of the shucked oysters on day 0 was 20.7 g. After 7 days of storage, the mean body weight was reduced by 92.1%. Fig. 4 shows the associated changes in the salinity of the surrounding water. Before storage, the salinity was 3.19%. Salinity decreased during storage, reaching a final level of 3.11% after 7 days.
Glycogen levels in the whole bodies of shucked oysters remained relatively constant during the first 3 days of storage at 3℃ but had shown a significant decrease after 7 days. This finding indicates that glycogen is utilized by shucked oysters during cold storage in seawater. Isani et al. (1995) reported that glycogen levels decreased in live mussels exposed to long-term (more than 24 h) anoxic conditions. Similarly, Chiou et al. (1998, 2002) demonstrated that decreases in glycogen commonly occurred during storage at different temperatures (0-30℃) in live hard clams, and that glycogen tended to decrease in live small abalones only during the late stages of storage.
Levels of nearly all of the FAAs remained unchanged during the storage period while the weight of the whole-body oysters decreased significantly. Together, these results indicate that the FAA content per oyster decreased during storage. In contrast, levels of aspartic acid and tyrosine significantly decreased and increased, respectively, after the 7 days of storage. In addition, levels of alanine in the oysters increased. FAA levels in bivalves are known to increase or decrease to enable these organisms to adapt to hypoxic/anoxic conditions or osmotic stress resulting from variations in their habitats (Lynch and Wood, 1966; Kluytmans et al., 1977; Heavers and Hammen, 1985; Isani et al., 1995; Enomoto et al., 1996; Hosoi et al., 2003; Rafrafi and Uglow, 2009). Murata and Sakaguchi (1986) reported that taurine and glycine levels in whole-body oysters changed very little during storage, alanine levels increased slightly, and proline and glutamic acid levels decreased. Therefore, changes in the levels of FAAs in shucked oysters can be attributed to storage conditions. Chiou et al. (1998) showed that the total amount of FAAs in live hard clams increased by 36% and 43% during storage at 5℃ and 10℃, respectively. In addition, considerable increases in the total FAA content of the foot muscle of live small abalones have been observed during storage at 5-25℃ (Chiou et al., 2002). Increases in the amounts of volatile basic nitrogen in small abalones (Chiou et al., 2002) and oysters (Murata and Sakaguchi, 1986) during storage was attributed to the initial stages of decomposition. However, in the current study, levels of ammonia in whole-body oysters remained nearly unchanged throughout the storage period. Thus, shucked oysters stored for 7 days at 3℃ would most likely be acceptable for commercial use. Moreover, a previous study (Tanimoto et al., 2004) showed that the population of psychrotrophic bacteria in shucked oysters increased by only one order of colonyforming units per gram after 10 days of storage at 3℃. In contrast, ammonia levels increased significantly in the adductor muscle after 7 days of storage (
The present study showed significant decreases in both the total amount of FAAs and in the amounts of the majority of individual FAAs in the adductor muscle during storage. Murata and Sakaguchi (1986) reported that in adductor muscles that had been removed from the whole body prior to storage, taurine and glycine levels remained unchanged, alanine levels increased markedly, and glutamic acid levels decreased during storage on ice. These results suggest that storage conditions can affect the FAA content of adductor muscles of shucked oysters. Enomoto et al. (1996) demonstrated a gradual decrease in the arginine level of adductor muscles in scallops in proportion to the acclimation time from aerobic to anaerobic conditions. Postmortem changes in the FAA levels of bivalve adductor muscles during storage were characterized by Wongso and Yamanaka (1996), who showed that in the noble scallops, the total amount of FAAs increased gradually until the onset of decomposition and then decreased. In addition, the changes and trends in the levels of FAAs in Japanese baking scallops were shown to vary among the different types of amino acids analyzed (Wongso and Yamanaka, 1998). These data suggest that the changes in FAA levels in the adductor muscles of bivalves depend not only on the species but also on the storage method(s). In the present study, most of the target FAAs were detected in the soaking water after 7 days of storage. In a previous study (Tanimoto et al., 2004), the total amount of ATP and its related compounds decreased rapidly in the adductor muscles of shucked oysters during 1 day of storage and slowly decreased thereafter. This reduction was larger than that observed in adductor muscles that had been removed from the whole body before storage at 5℃ (Yokoyama et al., 1994). In contrast, shucked oysters for the present study were prepared by cutting the adductor muscle from the shell prior to soaking the oysters in salt water. Note that the salinity of the salt water used for soaking these shucked oysters decreased during storage at 3℃. Thus, the observed decreases in FAA levels in the adductor muscles of shucked oysters under our storage conditions may have resulted from the elution of FAAs from the cut surface of the adductor muscle.
FAAs are known to be important contributors to the flavor of fish and shellfish (Konosu and Yamaguchi, 1982). Taurine, glycine, alanine, glutamic acid, and arginine are the major constituents of shellfish and considered to be the active taste components in abalones (Konosu, 1973), scallops (Konosu et al., 1988), and short-necked clams (Fuke and Konosu, 1989). When FAA levels in the adductor muscle of shucked oysters were compared with FAA taste thresholds (Yoshida et al., 1966; Schiffman et al., 1979), the prestorage levels of aspartic acid, glutamic acid, glycine, alanine, cystine, lysine, histidine, arginine, and asparagine were all higher than their respective taste threshold levels. After storage, however, glycine, lysine, and asparagine levels fell below their respective taste threshold levels. Therefore, the taste of adductor muscles of shucked oysters that have been soaked in salt water may change during cold storage.