By-catch is of great interest for conservation and resources management for sustainable fisheries (Gascuel et al., 2011). The existing square-mesh window and grid methods are static, passive stimuli with short periods that do not change position. An alternative method is the so-called active stimulating device (ASD), which may take the form of a conical rope array, rotating rope kite, or fluttering net panel inside the cod end, that generates variable visual stimuli for juvenile fishes in addition to flow-related effects (Kim, 2010). An ASD consisting of a fluttering net panel and ropes within the turbulence inside the cod end has been suggested as effective in reducing juvenile by-catch of red seabream and bastard halibut (Kim and Whang, 2010; Kim, 2011). An ASD that changes position with turbulence inside the cod end could generate variable fish stimuli in the form of visual, water flow, or physical contact stimuli at the free-end (flag-like) net panel or at the rope array. Thus, ASD fluttering movements with varying moving amplitude and a period could be considered an active stimulus to which fish may respond.
However preliminary experiments on the effects of ASDs by Kim and Whang (2010) and Kim (2011) resulted in limited amplitude and period analysis using a simple kind of ASD. Therefore, elements of the ASD involving fluttering movements of ropes or net panels as changed by flow velocity, materials, and length are needed to determine the optimum size and construction for field operations. In this study, basic hydrological characteristics of the rope and the net panel, particularly the fluttering amplitude and period in a water tank, were examined and then confirmed by field experiments with a bottom trawl.
Polyamide (PA) materials of different diameters with a constant length of 70 cm were selected for the fluttering twine and rope, as shown in Table 1. To compare the effects of rope length, the fluttering motions of 50-, 70-, and 90-cm lengths of sample rope R2 were compared (Table 1). A bundle of 10 strands of R2 rope was also tested for comparison with a single strand. The fluttering movement in water could be affected by hydrodynamic drag and the flexibility of the materials fluttering in air (Argentina and Mahadevan, 2005) or in water (Shelley et al., 2005). Thus, drag varies according to diameter (D), aspect ratio, and mesh size (M), and flexibility varies according to D and the material. The flexibility of the ropes and netting was measured by the hanging method. The vertical (Y) and horizontal coordinates (X) of freely bending 10- or 15-cm samples were measured with the end of the sample fixed at the end of flat board (Kim and Ha, 1987). The fluttering index was defined as DY/X for ropes and DY/LX for nets; the length of bar was defined as L = M/2.
The fluttering panels of the nets were made from rectangular (70 × 40 cm) PA netting with a hanging ratio of 95%; the samples were of different diameters and mesh sizes, as shown in Table 2. The combined ASD, consisting of the fluttering net panel and ropes, included a rectangular (70 × 40 cm) PA Raschel net (Nw in Table 2) with a hanging rate of 97% and 14 pieces of braided PA rope (R2 in Table 1) attached
[Table 1.] Specifications of the experimental ropes as elements of ASD
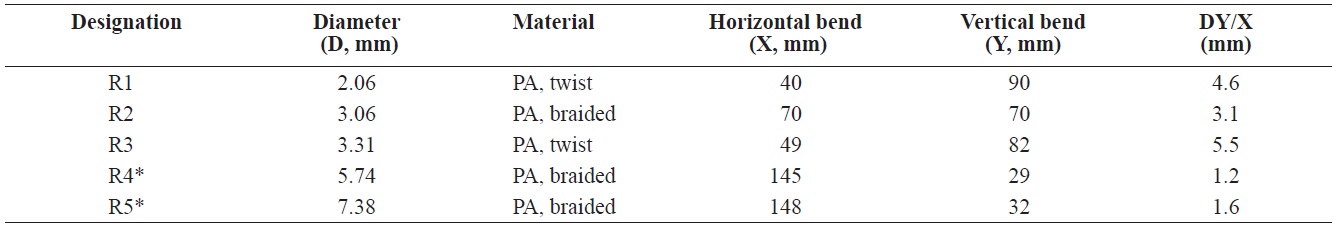
Specifications of the experimental ropes as elements of ASD
[Table 2.] Specifications of the experimental net panel with sample length 10 cm as elements of ASD
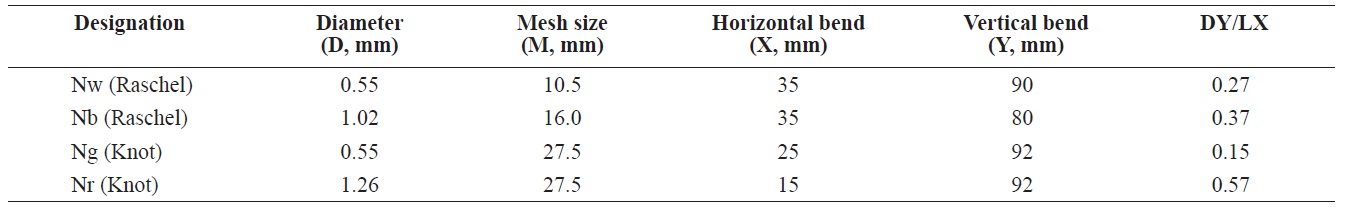
Specifications of the experimental net panel with sample length 10 cm as elements of ASD
at the front end of the net panel.
The model cod end was 40 cm in diameter and 130 cm in length with a hanging rate of 87%; it was made of reef knot and 28-mm diamond mesh (net sample Ng in Table 2), as used in previous experiments (Kim and Whang, 2010). Each of the rope elements of the ASD was fixed at the center of the front cod end with PA twine (multifilament, Ø3.5 mm). The model cod end was set up in the outer observing partition (L 2.0 × B 0.8 × D 0.7) of a circular water tank (diameter 5 m, depth 70 cm), with vertical rectified plates in front of the observing partition, as shown by Kim and Whang (2010). Turbulent flow was generated by four underwater pumps (IPV-835, 220 V, 1 hp; Hanil Electronics, San Diego, CA, USA) at a mean velocity of 0.6 m/s and seven pumps with a mean velocity of 0.8 m/s measured by a flow meter (201D; Marsh McBirney, Frederick, MD, USA).
Fluttering of the ASD was observed with an underwater video camera (Simrad OE 1210; Optronics, Oslo, Norway and OE1358; DeepSea Electronics, Rockford, IL, USA) and was recorded on videotape for 20 min at each flow velocity. The amplitude of ASD fluttering was defined as the distance between the upper point and lower point of the free end of the ASD, which was estimated from lateral-view video images after a calibration between the image size and the real scale. The amplitude ratio was represented as the percentage of amplitude to length of the ASD. Then, the period of the ASD was measured at a interval of 0.01 s from one upper point to the next upper point. The 3D flow velocity at the middle part of the observed section was measured by Vector (resolution 1 mm/s; Nortek, Vangkroken, Norway) at a sampling rate of 16 Hz for 5 min. The 3D flow was defined in terms of towing direction Vx, perpendicular direction Vy, and depth direction Vz, and the periodicity of each direction was analyzed using
the fast Fourier transformation (FFT) method in MATLAB software (Natick, MA, USA).
>
Field experiments with a bottom trawl
The experimental fishing gear was a bottom trawl towed by a 999 G/T training stern trawler (Saebada, 3000 HP; Gyeongsang National University,Jinju,korea). The head rope measured 45.2 m, the ground rope was 57.2 m, and the total length was 59 m. The cod end was made from double 90-mm diamond mesh composed of 5.7-mm-thick polyethylene (PE); it was 140 mesh in length and had a 160 mesh circumference. The estimated length and diameter of the cod end during towing were 12.3 m and 2.5 m, respectively.
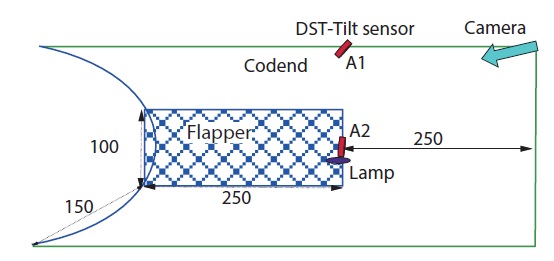
Fluttering panels of netting were made from rectangular (250 × 100 cm) PA net with a hanging ratio of 97%, a diameter of 1.26 mm, and a mesh size of 27.5 mm, as shown for sample Nr in Table 2. The fluttering net panel was attached horizontally at 6 m from the end of cod end by 150 cm of string (diameter 3 mm, PA braided twine), as shown in Fig. 1.
The fluttering net panel was recorded with a mini-camcorder (L65 × B25 × D 10 mm, light sensitivity 1 lx, 8 Gb
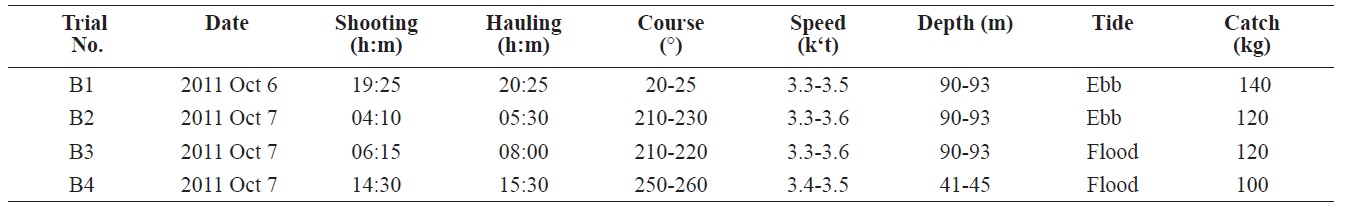
[Table 3.] Conditions during field experiments of the bottom trawl

Conditions during field experiments of the bottom trawl
[Table 4.] Mean ± SD of 3D velocity and periods by FFT method by number of pump used in the tank
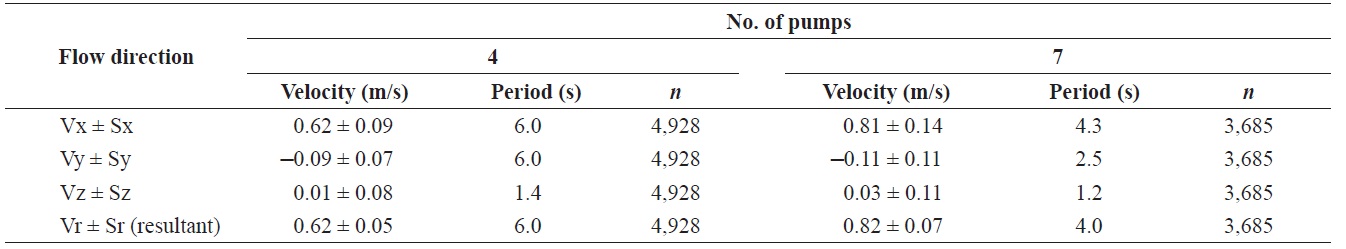
Mean ± SD of 3D velocity and periods by FFT method by number of pump used in the tank
memory) that was enclosed in a waterproof scuba lantern case (diameter 45 mm, length 160 mm, neutral state in seawater) and fixed at the upper end of the cod end. A flickering light (diameter 15 mm, length 50 mm, depth 300 m, weight in water 3 g) was attached at the end of the fluttering net panel as an indicator for the camera under dark conditions. Memory-type DST-Tilt sensors (Star-Odi, Reykjavik, Iceland) were fixed at the end of the fluttering net panel and the upper panel of the cod end to measure depth and tilt, respectively.
The dimensions of the DST-Tilt were diameter 15 mm, length 46 mm, weight in water 12 g, depth 300 m, and it measured depth sensitivity to ±0.4%, tilt (yaw, pitch, roll) to ±1°, and temperature to ±0.1℃ at 1-s sampling intervals. Field experiments were carried out offshore of Geomoon Island (Yeosu) and Sezon Island (Tongyoung) under the conditions given in Table 3. The sea was calm, and wave height was <1 m. The vertical displacement of the fluttering net panel inside the cod end was defined as deviations in depth differences between the two DST-Tilt sensors for each trial. The periodicity of the fluttering net panel was analyzed for vertical displacements and 3D tilt variations using the FFT method in MATLAB software.
Fluttering movements of the ASD were affected by turbulence flow in the experimental water tank and wake flow inside the model cod end. The mean flow velocity and standard deviation (SD) and period, as determined by the FFT method in the water channel of the tank, are shown in Table 4 for each
flow direction by the number of pumps used. Flow velocity was categorized into two steps (e.g., such as 0.6 and 0.8 m/s) according to the number of pumps (4 and 7, respectively). The ratio of the SD to mean flow velocity Vx or Vy, i.e., Sx/Vr or Sy/Vr, is similar to the flow inside the cod end of a shrimp beam trawl (Kim, 2012) or bottom trawl (Kim, 2013), and the ratio of Sz (Sz/Vr = 13-14%) was slightly higher than those values by Kim (2012, 2013). The dominant period of flow velocity decreased slightly as velocity increased, and the Vz period (1-2 s) was apparently shorter than the Vx (4-6 s) or Vy (3-6 s) period.
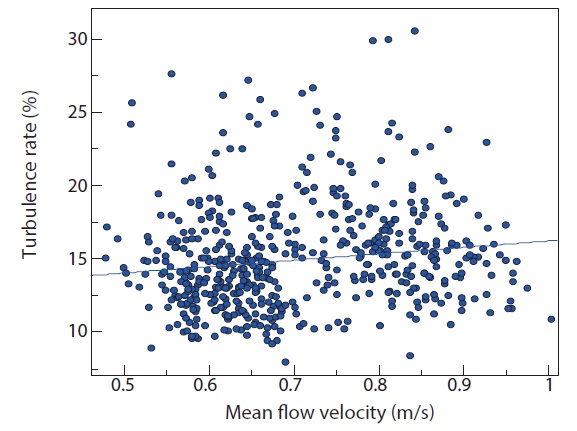
The turbulence rate of the water channel can be represented as the square root of the mean SD divided by mean flow velocity, as shown in Fig. 2., The turbulence rate of the water channel in the present study, with a mean value of 15%, was higher than the 5% rate in a circulating water tank (Pichot et al., 2009), but similar to turbulence rate and periodicity inside a shrimp beam or bottom trawl (Kim, 2012, 2013). Therefore, the water channel was reasonable for a model test of a cod end or ASD, although uneven flow distribution occurred due to the circular shape of the tank.
The mean ± SD of the amplitude ratios and periods for the fluttering ropes based on flow velocity in the water channel are shown in Table 5. Most of the amplitudes and periods were not normally distributed, except the amplitude of sample R2 and the periods of sample R3 when the velocity was 0.8 m/s.
[Table 5.] Mean ± SD of amplitude ratio and periods for the fluttering ropes by flow velocity
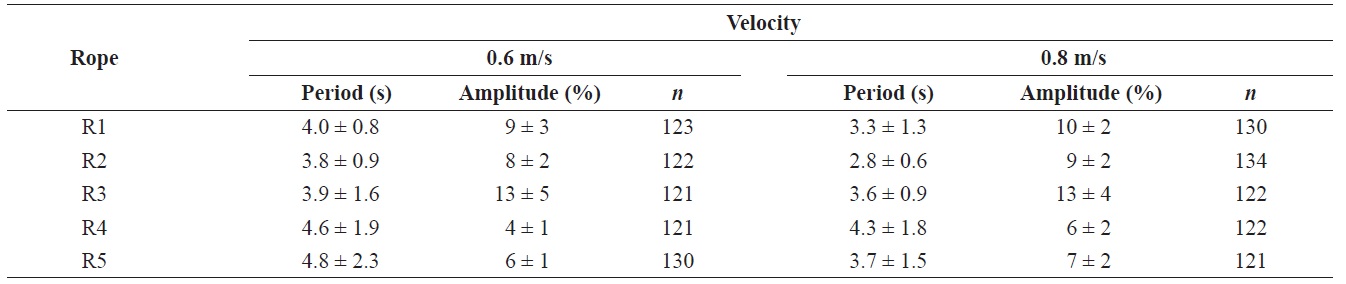
Mean ± SD of amplitude ratio and periods for the fluttering ropes by flow velocity
The periods of ropes were significantly different (
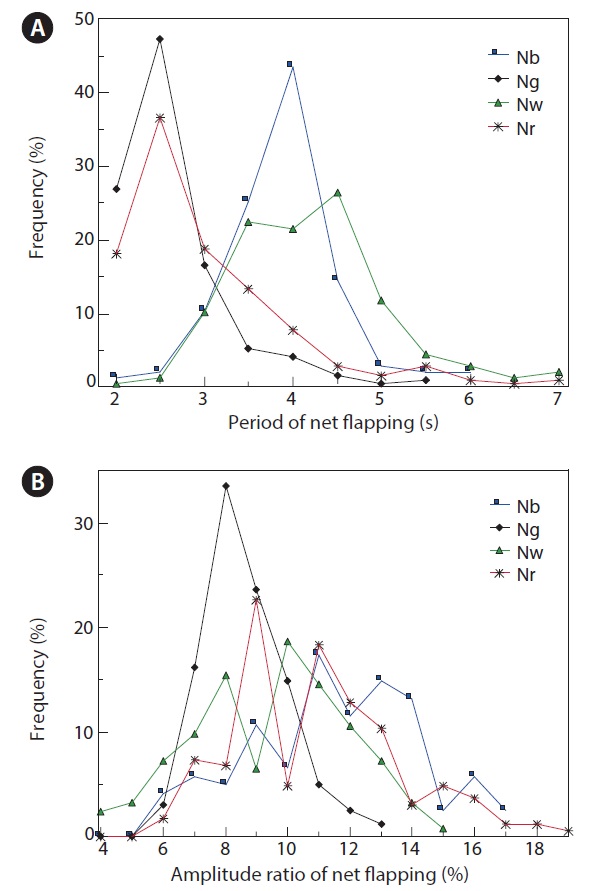
The mean ± SD of the amplitude ratio and periods for the fluttering net panel based on flow velocity in the water channel are shown in Table 6, and their frequencies are shown in Fig. 3. The amplitude frequency and the period of fluttering nets were generally not normally distributed. The periods of all net samples were significantly different (
< 0.05) for flow velocities of samples Ng and Nr only. The periods were significantly different between the two samples under the same flow velocity of 0.6 or 0.8 m/s (
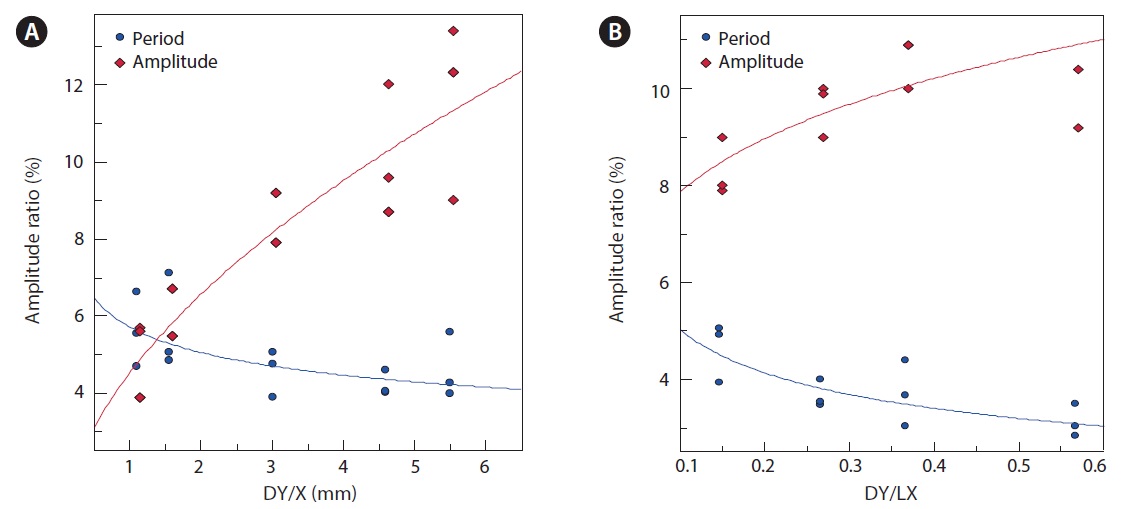
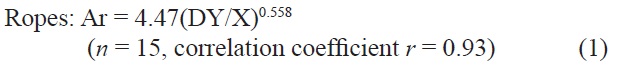
The mean ± SD of the amplitude ratio (A) and the period (P) of ropes and the net panels, respectively, are represented by the fluttering indices DY/X or DY/LX in Fig. 4. Their relationship can be expressed as a power function as follows:


The amplitude ratio of the fluttering ASD increased significantly with the fluttering index, whereas the period decreased significantly with increasing fluttering index (
[Table 6.] Mean ± SD of amplitude ratio and periods for fluttering net panels by flow velocity
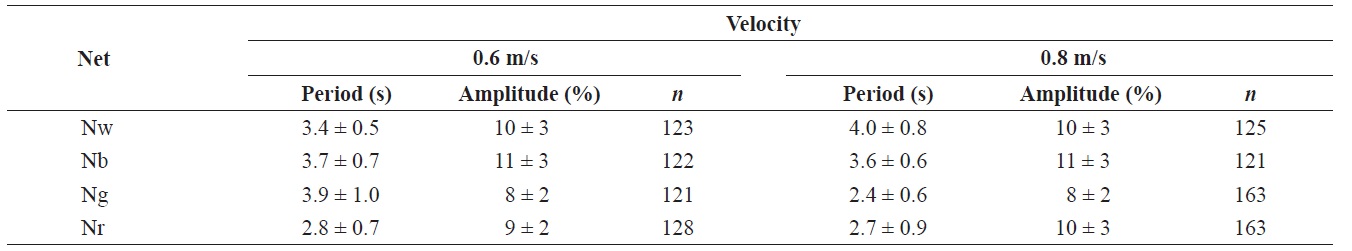
Mean ± SD of amplitude ratio and periods for fluttering net panels by flow velocity
al., 2002; Alben and Shelley, 2008). The amplitude ratios of the ropes can be represented for all data sets by flow velocity as follows, although other cases revealed very low coefficients due to the wide distribution, as shown in Fig. 4.


Therefore, factors related to the amplitude or period of the fluttering ASD were the flow velocity and fluttering index. The intercept and slope of Eqs. 5 and 6 can be generalized by a flow velocity (Vr) function with power coefficients α, β as follows:

From Eqs. 5 and 6, the relevant values in Eq. 7 were estimated as Ao = 7.3, α = 1.2, and β = 0.5. furthermore, Ao may be a function of turbulence rate (Tr = 15%), possibly expressed as Ao ? 0.5Tr, because the fluttering ratio was closely related to the turbulence rate in the tank experiments.
The means ± SDs of the amplitude ratio and periods according to rope length (sample R2), rope bundle (sample R2), and combined net (sample Nw) and rope (sample R2) based on
flow velocity in the water channel are shown in Table 7. The period of the rope bundle increased slightly with rope length, whereas the amplitude ratio remained unchanged with rope length. The period of the rope bundle was shorter than that of the single rope, but the amplitude ratio was greater than that of the single rope. The period at a flow velocity of 0.8 m/s was shorter than that at 0.6 m/s, whereas the amplitude ratio was similar based on a flow velocity of 0.6-0.8 m/s. The amplitude ratios of the ropes and nets were 11-13%, which was similar to the SD ratio of Vz in Sz/Vr (13-14%) and also similar to the 15% turbulence rate in the water channel. Additionally, the period of the rope and nets was 2-5 s, which was similar to the period of the 3D flow of water in the channel, which was 1-6 s.
Only when the net (Nw) and rope (R2) were combined was the period shorter than those for rope or net alone, and the amplitude ratio was nearly twice that of the rope or net alone, similar to previous experiments on the ASD effect (Kim and Whang, 2010). The reason for this was the interaction of turbulence between the ropes and nets, which also affected the
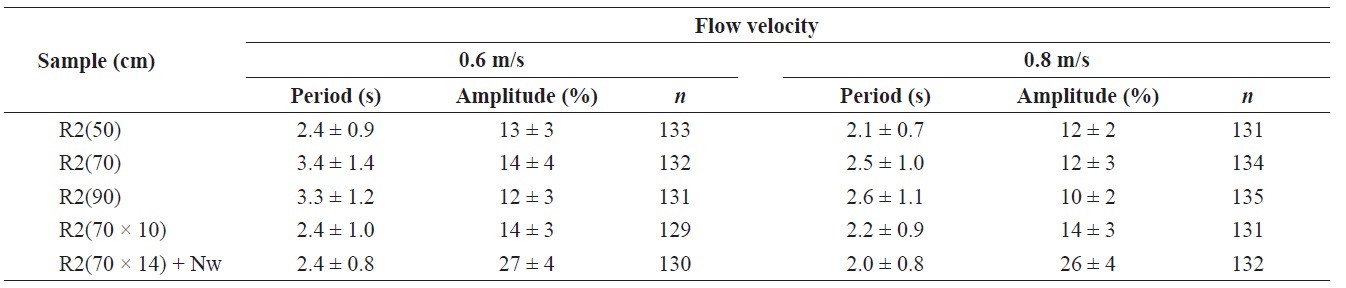
Mean ± SD of amplitude ratio and periods by length of ropes and combining ASD as rope + net panels by flow velocity

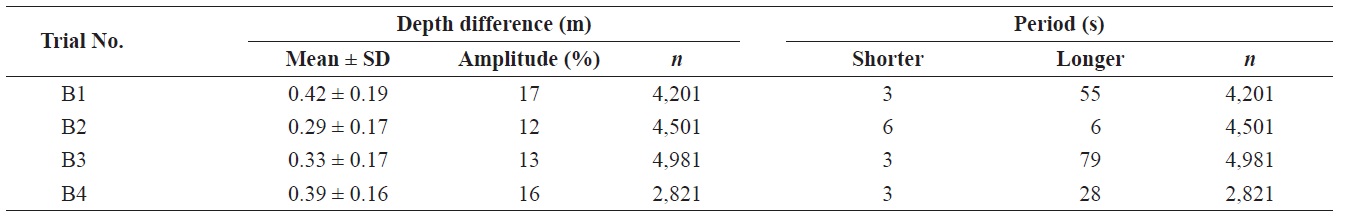
Depth difference ± SD and periods by FFT method of the fluttering net panel in the codend of bottom trawl
amplitude or period as well as the turbulence wake inside the cod end. Previous experiments on the ASD effect (Kim and Whang, 2010) demonstrated a very effective period and amplitude for driving fish near the upper cod end.
The amplitude and period of the rope and net fluttering movements varied not only according to the characteristics of the ASD, such as the material, diameter, length, and flexibility, but also according to the effects of the turbulent flow, such as 3D velocity, turbulence rate, and drag. The scale effects on fluttering between the model test in a water tank and a test in the field must be investigated in the future.
>
Sea experiments with bottom trawl
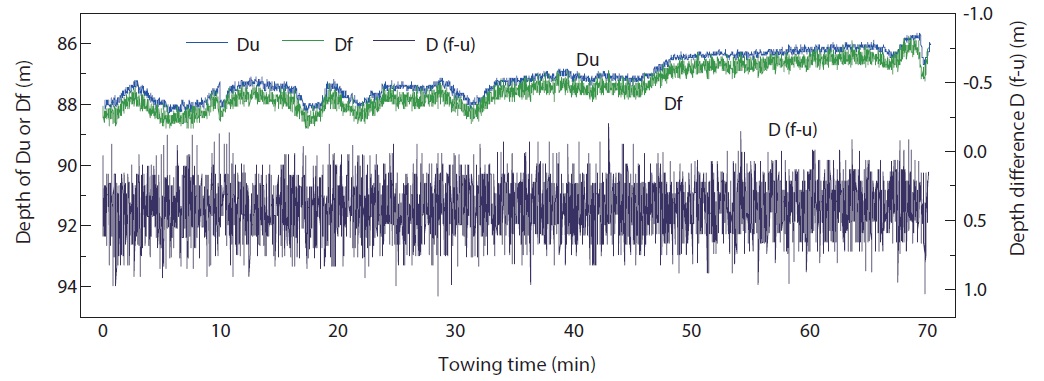
An example of variation in the depth of the upper panel of the cod end and the fluttering net panel and their depth differences in the bottom trawl (B1) field experiments is shown in Fig. 5. The depth difference for each 1-s time interval was considered vertical displacement of the fluttering net panel,
which varied between 0 and 1 m. The mean depth differences and periodicity for four trials using the FFT method are shown in Table 8.
The range of mean depth difference of the fluttering net
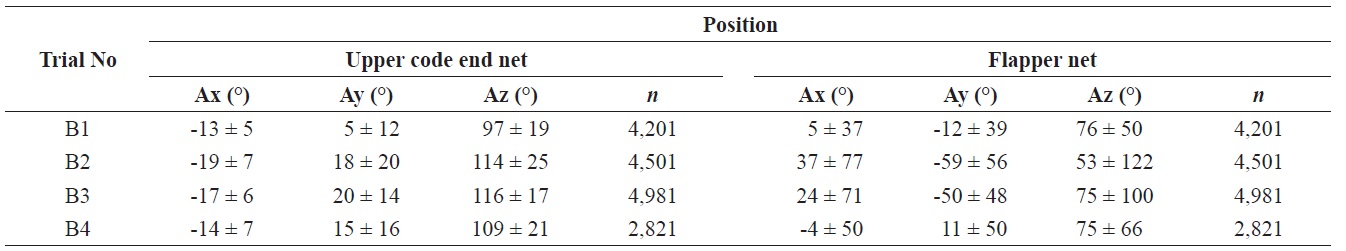
[Table 9.] Mean ± SD of 3D tilt in the fluttering net panels and upper codend of the bottom trawl

Mean ± SD of 3D tilt in the fluttering net panels and upper codend of the bottom trawl

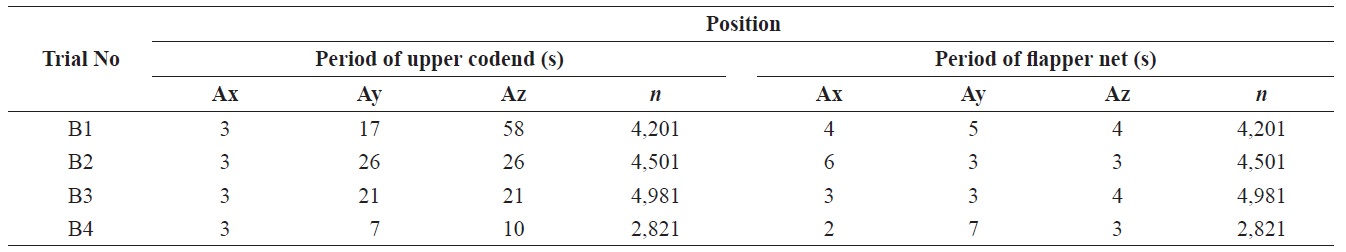
The dominant period by FFT method for 3D tilt in the fluttering net panels and upper codend of the bottom trawl
panel was 0.3-0.4 m, 12-17% of the length of the fluttering net (2.5 m), which was greater than that of the nets in the tank experiments. However, a maximum depth difference of about 1 m was reached at 40% of net length and also at 40% of the cod end diameter (2.5 m). Shorter periods of the depth differences were revealed, ranging from 3 to 6 s, and longer periods ranging from 30 to 80 s.
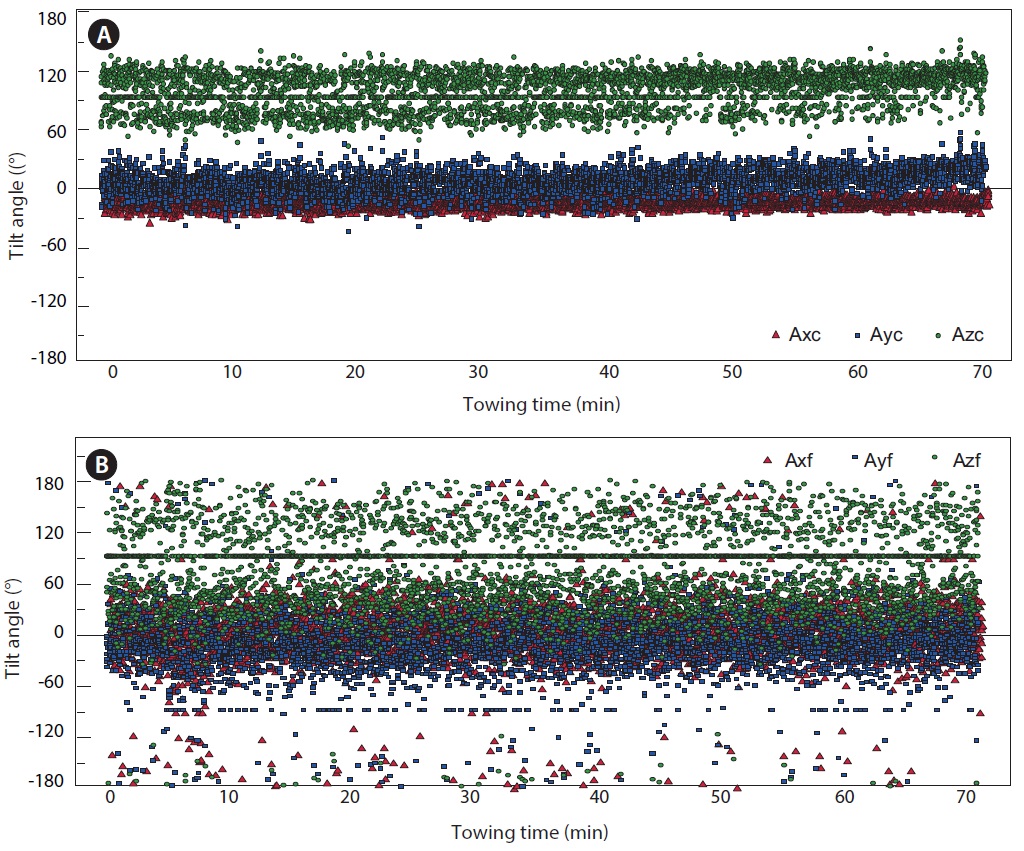
The 3D tilt variations such as yaw (Ax), pitch (Ay), and roll (Az) of the upper panel of the cod end or fluttering net as measured by the DST-Tilt sensor are shown as examples in Fig. 6, and the mean ± SD of the tilts for the four trials are shown in Table 9. The variation in the tilt of the fluttering net panel was 40-120°, this was greater than that in the upper panel of the cod end, which was 5-25°. This indicates that the end of the fluttering net panel, acting as an ASD, moved dynamically in the three directions, in addition to the depth variations noted above and in Table 8 and Fig. 5.
The periodicity of the tilts for the upper panel of the cod end and the fluttering nets are shown in Table 10. The dominant periods of the 3D tilts in the fluttering net panel were shorter, at 3-7 s, than were those of the upper panel of the cod end, with the exception of Ax (3 s). The period range of the tilts in the fluttering nets coincided with the shorter period range of the depth difference, as shown in Table 8, although there was some difference by trials. The period range of the fluttering nets was also similar to the period range of the 3D flow velocity inside cod end of the trawl (Kim, 2013),tilt and flow velocity had different sampling rates. Therefore, the period and vertical displacement of the fluttering net panel inside the cod end during the field experiments were closely related to turbulence flow.
The fluttering period of the active net panel in this study (3-7 s) could affect swimming patterns in the cod end. The dominant period of swimming acceleration for flatfish or round fish near ground gear during field operations is 4 s during the falling-back response and 2 s during the herding response (Kim and Wardle, 2006; Kim et al., 2008). Therefore, the variable period of the fluttering net panel could disturb the orderly pattern of swimming fish, particularly the acceleration time of the juvenile flatfish or red seabream, as shown in tank experiments (Kim and Whang, 2010; Kim, 2011).