Graphene is one of the most exciting materials being investigated today, not only out of academic curiosity but also for its potential applications. Graphene, a single layer of carbon packed in a hexagonal lattice with a carbon-carbon distance of 0.142 nm is the first truly two-dimensional crystalline material, which is stable at room conditions [1-3]. Graphene has displayed a variety of intriguing properties including high electron mobility at room temperature (250,000 cm2/Vs) exceptional thermal conductivity (5,000 W m-1 K-1) and superior mechanical properties with a Young’s modulus of 1TPa [4,5]. Thus, graphene nano sheets (GNS) offer extraordinary electronic, thermal and mechanical properties and are expected to have a variety of applications in sensors, batteries, super capacitors, hydrogen storage systems and as reinforcement fillers of nanocomposites [6]. Recent studies have shown that polymer nanocomposites with graphene as a nanofiller exhibit substantial property enhancements at much lower loadings than with other conventional nano-fillers in many cases [7-10]. To achieve high-performance of GNS, however, homogeneous dispersion of graphene nanosheets in the polymer hosts and proper interfacial interactions between the nanosheets and the surrounding matrix must be considered [11-15]. The present work focuses on the reinforcement of unsaturated polyester (UPR) resins using GNS. The introduction of GNS allows for a chemical bond to be formed between the polymer matrix and the filler. The increase in interaction between the GNS and the UPR was determined by, the mechanical properties and the thermal properties of resultant composites. It was also observed that the electrical properties are also improved with the incorporation of the GNS into the polymer matrix.
The unsaturated polyester resin (UPR) used in the study was obtained from M/s Naphtha Resins, Bangalore, India and was
used as such. The resin was pre-accelerated with 0.2% cobalt naphthanate (6% Co content), had a solid content of 55% and used styrene as the reactive diluent. The reactive diluent styrene contains a vinyl double bond and serves to reduce the viscosity of the polyester resin so that the resin can be pumped and processed. The acid value of the composition was 12 mg KOH/g resin and had a viscosity of 330 mPas (@ 25℃ and 50 rpm).
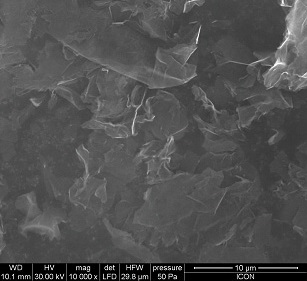
The GNS used were obtained from Cheaptubes.com and had a purity of 97% and diameter of 15 microns with a surface area of 100 m2/gm and these were used without any further purification. Figure 1 represents the scanning electron microscopic (SEM) image of the GNS used for the experimentation.
3-(trimethoxysilyl)-propyl methacrylate 98% (3-MAT) were supplied by Leverkusen Germany. The initiator used for the cure of the unsaturated polyester resin was methyl ethyl ketone peroxide (MEKP) obtained from M/s Naphtha Resins and used as such. Ethanol, N, N dimethyl aniline and hydroquinone were procured from M/s S.D. Fine chemicals Ltd, India and were of laboratory chemical grade and were used without any further purification.
2.2 Preparation of GNS/ UPR composite
The nano-composites were prepared by adding the required amount of GNS to the unsaturated polyester resin under mechanical agitation. The dispersion was then subjected to ultrasonication coupled with mechanical agitation, using an rpm of 1,500 ± 50, in a temperature controlled bath maintained at 25℃ for a period of 4 hours.
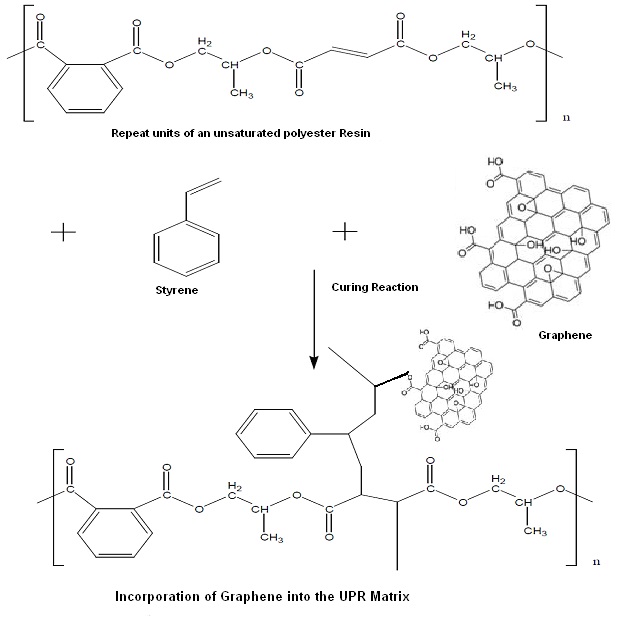
Following the dispersion of the nano-materials in the polymer matrix the dispersion was degassed, and the required amount of initiator was added and stirred. Figure 2 provides the schematic representation of the chemical reaction taking place during the curing of the nanocomposites formed. The composition was then poured into Teflon and metal moulds and allowed to cure at room temperature i.e. 25 ± 1℃ for 12 hours followed by postcuring at 80 ± 1℃ for four hours. The composites were then allowed to stabilize for 7 days at 25 ± 1℃ and 50% relative humidity before any testing was carried out.
2.3.1 Morphological and spectroscopic properties
The scanning electron microscopy (SEM) of samples was carried
out on a FEI Quanta 200 machine with a tungsten source, with a working distance of 10 mm and beam intensity of 30 kV. The FTIR spectra were evaluated on a Perkin Elmer 781 spectrophotometer on the powder samples from between 400 to 4,000 cm-1.
2.3.2 Mechanical properties
The mechanical properties of the UPR nanocomposites were evaluated using a Lloyd 50 Universal Testing Machine with a 50 kN load cell in the case of tensile properties and 500N for flexural properties with a jaw speed of 2 mm/min and a gauge length of 5 cm. The samples used for the evaluation of mechanical properties had dimensions of 100 × 10 × 5 mm.
The impact strength of the samples was evaluated on a Denson Avery Impact tester with a striker of 2.7 J with a striking velocity of 3.46 m/s in accordance with ASTM D256.
2.3.3 Thermal properties
The glass transition temperature of the UPR nanocomposites was evaluated on a Mettler Toledo DSC822e machine with a sample weight of 10~20 mg and a heating rate of 10℃/min. The sample was cycled from 25~250℃ and 250~25℃. The glass transition was evaluated from the second run to eliminate the thermal history from the sample.
2.3.4 Surface resistivity
The surface resistivity of the nanocomposites was measured by using an electrometer model 6517 Keithley instrument. This was done according to ASTM D 257-2007. The samples used for evaluation of surface resistivity had dimensions of 100 × 100 × 3 mm. The resistivity was measured at an applied voltage of 500 V DC and electrification time was 60 seconds [7].
2.3.5 Dry arc resistance
Dry arc resistance measurement of the nanocomposites was conducted using the arc resistance IEC model 2 according to ASTM D 495-1999. The samples used for the evaluation of arc resistance had dimensions of 100 × 100 × 3 mm. The sample was exposed in an arc which was under a high current and low voltage condition. The sample was placed under the electrodes which were spaced at 6.35 mm. An arc is generated between these electrodes. The test consisted of seven cycles [7].
2.3.6 Dielectric strength
The dielectric strength of the nanocomposites was carried out according to ASTM D 149-2009. The samples used for the determination of dielectric strength had dimensions of 150 × 150 × 3 mm. The electrodes were made up of brass alloys which were in the form of a cylindrical shape. The measurements of the nanocomposites were done with an electrode surrounded by air at 25℃ and 30% RH. During the measurement high voltage was applied to the electrodes. It slowly increased until the dielectric broke down and a sudden increase of current occurred. The effect of breakdown on the dielectric was visually observed after the sample was removed from an opening that was created by a sudden rush of current. The dielectric strength is calculated as the quotient of the measured breakdown voltage and the thickness of the sample dielectric:
2.3.7 Comparative tracking index
The Comparative tracking index (CTI) test specimen is prepared according to the procedure described in IEC 60 112 - 2003. CTI is used to test the resistance of the tracking solid insulator or part of the insulator in the alkaline environment used in electrical appliances and accessories. Surface failure may arise from flashover or from progressive degradation of the insulating surface by small localized sparks. The rapid break in the leakage current produced an over voltage at the site of discontinuity causing an electrical spark. This spark may be causing carbonization on insulation and finally lead to a carbon track between points at different potentials.
The CTI will indicate the relative behavior of solid electrical insulating material with regards to their susceptibility to surface tracking when exposed, under electric stress, to water and other contaminant from the surrounding area. The test set is especially suitable for synthetic resin molding [7].
3.1 Morphological and spectroscopic properties
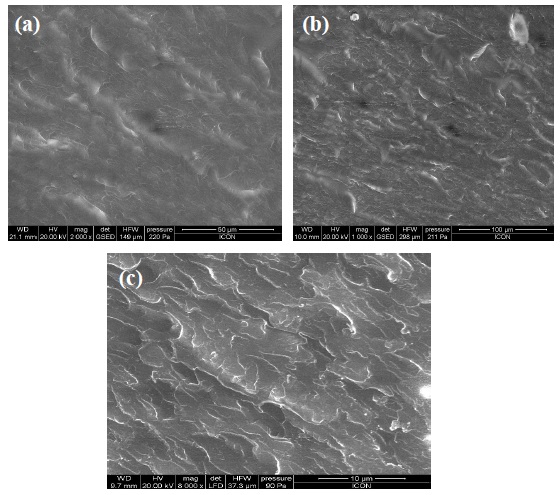
The composite film samples were subjected to scanning electron microscopy (SEM) to evaluate the dispersion of the GNS in the polymer matrix. SEM images (Fig. 3) were taken on the fracture structure of the GNS/UPR composite film at different concentrations. High quality GNS dispersion with a few small aggregates is observed in the cross-sectional area image in Fig. 3(c). It is observed that there is a good dispersion till 0.05% of concentration. But as seen in Fig. 3(c) there is agglomeration at 0.075% concentration.
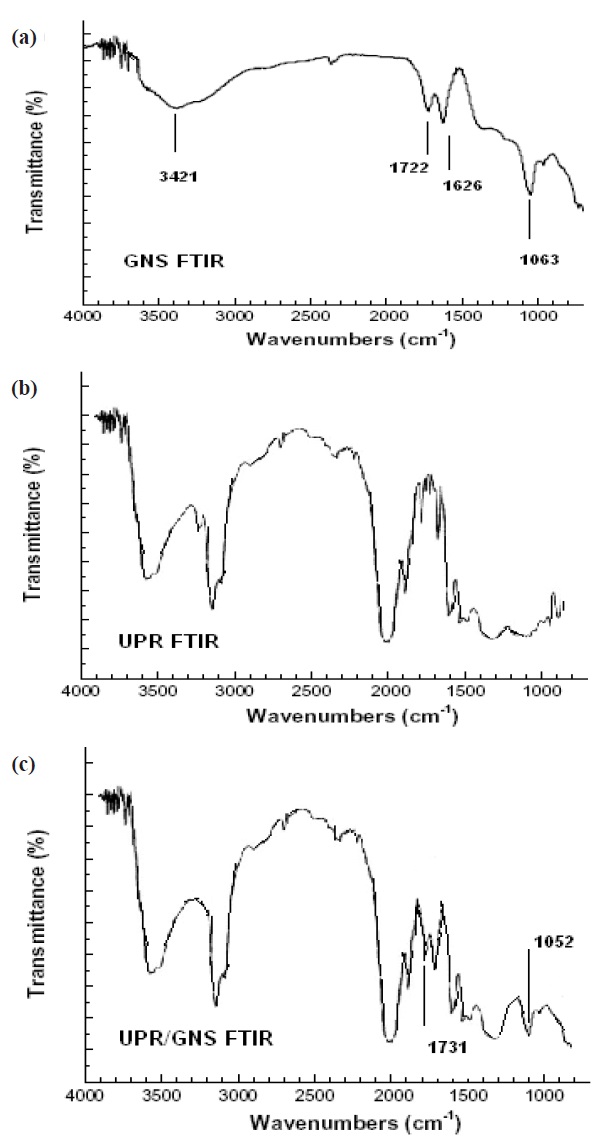
The composite film samples were subjected to FTIR to understand the interaction of the GNS and UPR matrix. In Fig. 4(a) the broad band in region 3,421 cm-1 was due to the hydroxyl group present in the GNS. Similarly, in Fig. 4(b) the broad band in region 3,400 cm-1 was due to the intermolecular hydrogen bonded -OH of the polyester molecule. In Fig. 4(c) we observe a sharp
peak around 1,600~1,620 cm-1 which represents the C=C stretching from the GNS. Again, in Fig. 4(c) a peak between 1,730 and 1,740 cm-1 was observed which corresponded to the C=O stretching vibrations of the carboxyl group in GNS and ester groups in UPR. The sharp peak at 1,731 cm-1 represents the formation of the ester group with the carboxyl of GNS. The C-O-C groups from GNS/UPR composite exhibit strong bands at 1,045~1,095 cm-1, which confirms that the UPR reacts with the carboxyl and hydroxyl group present over the GNS to form the composite.
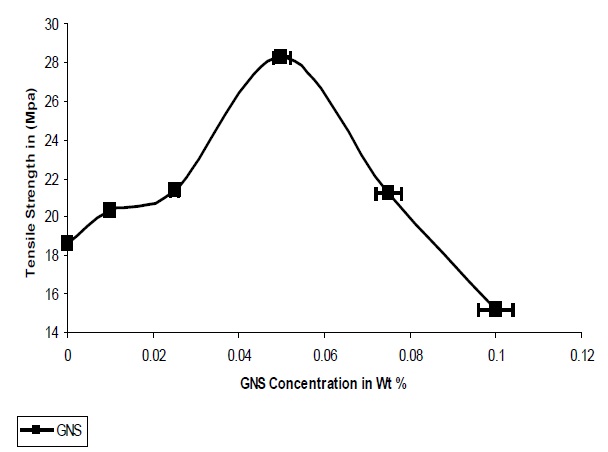
The addition of GNS resulted in an increase in the tensile strength of the composites; it was observed that agglomeration of the particles occurred after 0.075%, which the strength of the composites were seen to decrease. As seen from Fig. 5 the optimum concentration of GNS is 0.05% where a 52% increase in the tensile strength was observed, as compared to the pristine UPR. While in case of graphene the large increase in tensile strength concluded that the high specific surface area, enhanced matrix adhesion arising from the wrinkled surface of graphene and the two dimensional geometry of the material contributed to the result.
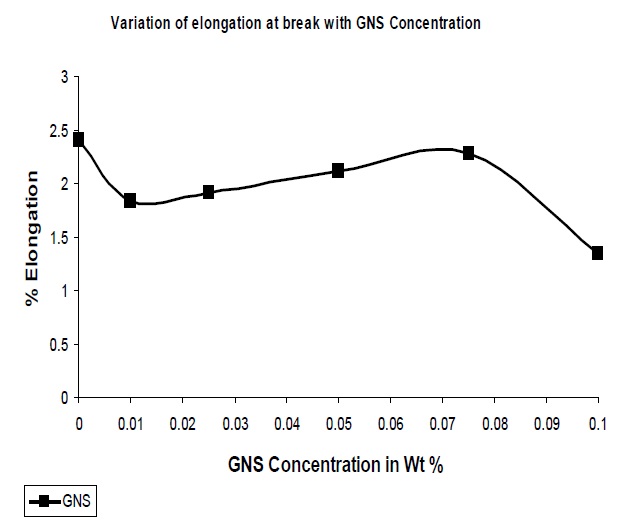
With the addition of reinforcing fillers it has been observed that the resultant composites showed a decrease in the elongation at break as compared to the pristine polymer matrix
The GNS added to UPR resulted in a decrease in the elongation at break. Due to the increased interaction between the polymer and the nano-particles improved rigidity of the system, resulting nanocomposites resist deformation as observed from Fig. 6. Though till 0.1% GNS concentration the elongation at break is lower than that of the pristine UPR but some fluctuation in the trend is due to agglomeration as GNS has the tendency to roll down to tubular form than that of sheet form.
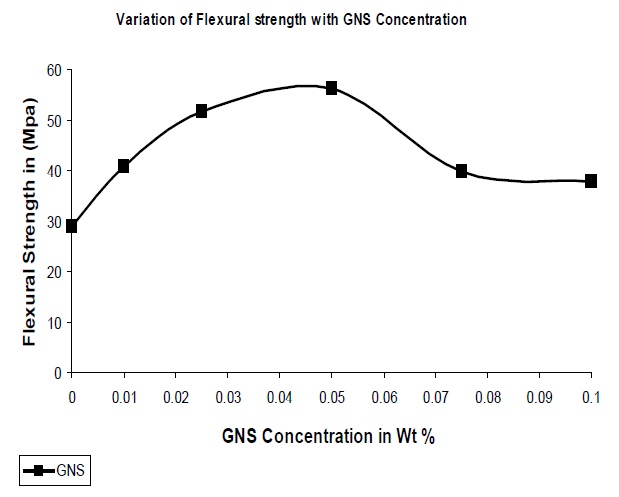
As in the case of tensile strength, due to the increase in interaction between the polymer and the filler, the flexural strength of GNS based composites were higher than that of UPR as observed from Fig. 7. The optimum concentration of GNS was seen to be at 0.05% with an increase in flexural strength of 92% with reference to the pure UPR. Many factors can contribute to the improvements in flexural strength in these GNS/UPR composites. One obvious factor is the improved dispersion of the GNS in the UPR matrix (as evidenced from the SEM images). Another factor might be an interfacial bonding between the GNS and UPR matrix that facilitates load transfer. To explore this possibility, FT-IR spectra of the samples were collected, which revealed the chemical interaction between the GNS & UPR matrix.
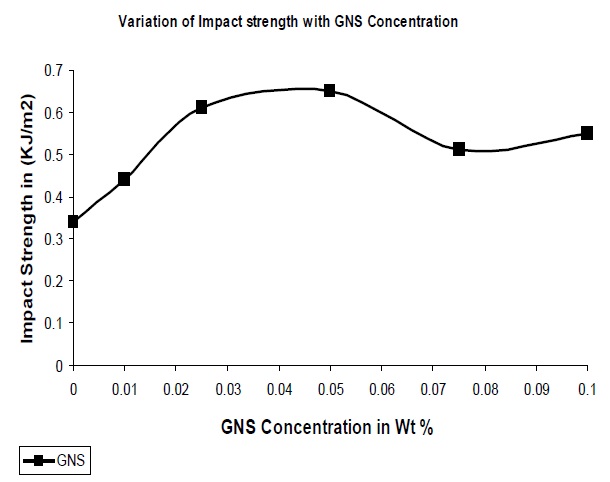
The impact properties of the composites were also evaluated and the results are shown in Fig. 8. From the figure it is clear that the addition of GNS to the polymer matrix results in an increase in the impact strength of the resultant composites.
The addition of GNS allows for the stress transfer from the polymer matrix to the filler which would lead to the dissipation of this force, resulting higher energy requirement to break the composite which results increase in impact strength of the composite. In addition, in this instance the optimum concentration of GNS was seen to exhibit a 91% increase as compared to pure UPR.
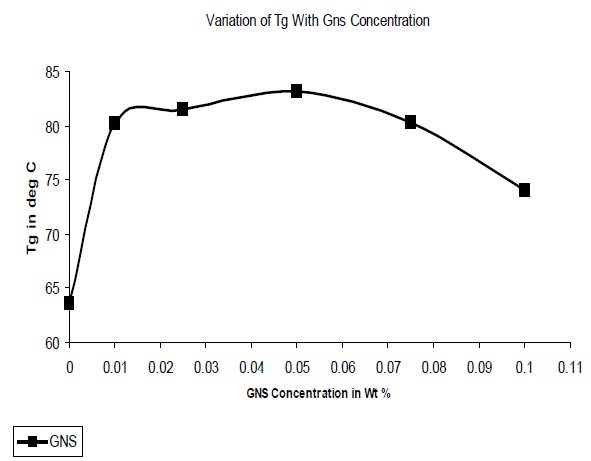
The glass transition temperatures (Tg) of the composites were determined and Fig. 9 illustrates the variation of Tg with GNS concentration. It was observed that the Tg increased on addition of GNS, due to the restriction in polymer chain mobility on interaction with the filler. At concentrations above 0.05% it was observed that the Tg decreased due to the formation of agglomerates which are not as effective in the restriction of chain mobility.
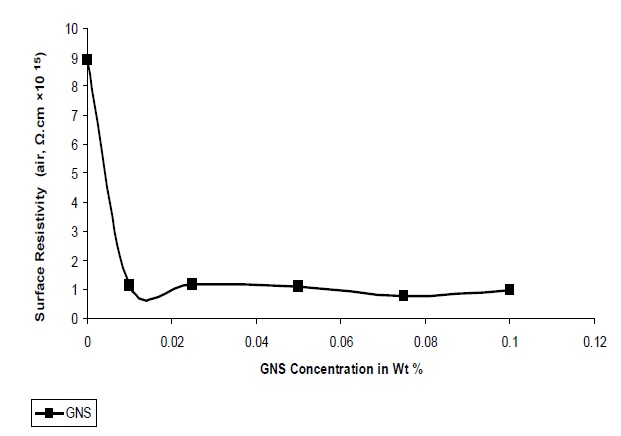
Figure 10 shows the effect of GNS filler on the surface resistivity of UPR nano composites. Surface resistivity of a material is the electrical resistance to leakage current along the surface of the insulator. As observed from Fig. 10 the surface resistivity decreases with increase in the concentration of GNS which can be explained: due to the platelate structure and larger surface area of GNS, a larger free path is available within the polymer matrix
for the free electrons to propagate. The surface resistivity value varies in between 0.99 × 10¹⁵ Ω-cm to 0.14 × 10¹⁵ Ω-cm from 0.01 to 0.1 concentrations of GNS. The lowest resistivity value 0.99 × 10¹⁵ Ω-cm was obtained at the GNS concentration of 0.1.
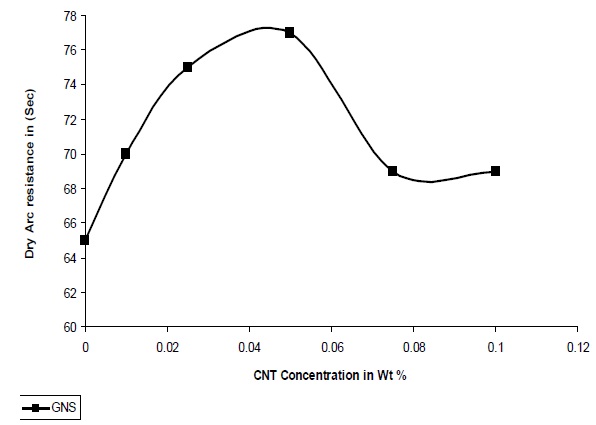
The resistance to high voltage arcing is tested according to ASTM D-495, 1999. In this test high voltage arc is ignited on the sample surface. Failure is characterized by carbonization of the surface (conductive), tracking, or burning. The result for arcing time is shown in Fig. 11. It was observed that for GNS/UPR composite the high voltage arc with stand capacity is 77 seconds at 0.05% concentration of GNS which is equal to 65 seconds from the pristine UPR system. There is an increase of 20% high voltage arc resistance in the GNS/UPR composite in comparison to that of pristine UPR. Due to the quasi dimensional structure of GNS and platelet structure it obtained the capacity to withstand high voltage arc for more time and therefore the UPR/GNS composite can withstand high voltage arc for more time with the increase concentration of GNS. After 0.05% concentration of GNS the dry arc resistances decreases due to the agglomeration of GNS in the polymer matrix as observed from the graph in Fig. 11.
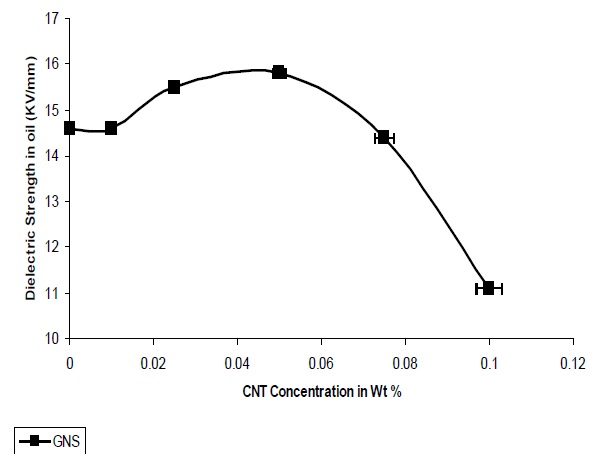
Figure 12 presents the variations in dielectric strength with different concentrations of GNS. It is observed that the dielectric strength increases with the addition of GNS into the polymer matrix and the highest value of dielectric strength is 15.8 Kv/mm at 0.05 Wt%. The increase in dielectric strength was observed till 0.05%, after which the strength decreases.
The dielectric strength of nanocomposites containing GNS is more due to the quasi dimensional structure of GNS and also the platelet structure.
3.7 Comparative tracking index
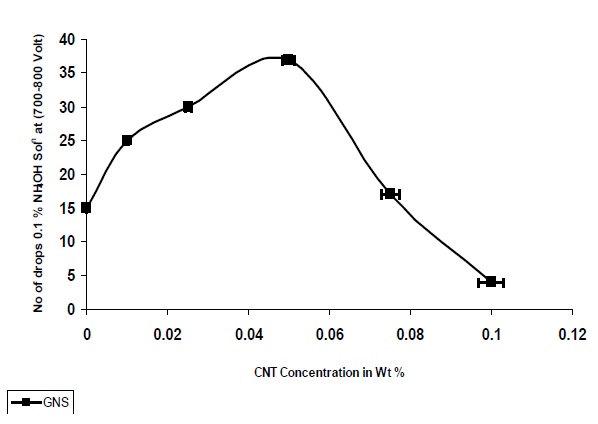
Figure 13 shows that the CTI of nanocomposites increases with the addition of nanoparticles, up to a concentration of 0.05%, after which it is decreased. As observed from Fig. 13 nanocomposites based on GNS demonstrated a larger increase in the CTI as compared to the pristine UPR Matrix, whicht the UPR/GNSsites is also exhibiting very high resistance to the alkaline environment and can withstand high voltage arc generated during the presence of moisture in the substrate surface.
The nanocomposites were prepared by ultrasonically dispersing GNS at different Wt% (0.01% to 0.1%) into the UPR matrix. The extent of dispersion was also observed by using the Scanning electron microscopy (SEM) technique. The mechanical properties like tensile, elongation, flexural and impact & thermal properties of the prepared nanocomposites were evaluated. Also, the electrical properties like surface resistivity, dry arc resistance, comparative tracking index, and dielectric strength were evaluated to observe the electrical behavior of the nanocomposites. The tensile strength of the nanocomposites improved with increase in the concentration of GNS. The highest tensile strength was observed at a concentration 0.05% where the increase in the tensile strength value is 52% in comparison to that of the pristine UPR. Again, the flexural strength also increased by approximately 92% at the concentration of 0.05% and the impact strength also increased around 91% at the same concentration. Similarly, the thermal properties for the nanocomposites were also improved. The nanocomposites based on GNS also demonstrated improvement in the electrical properties. The high voltage arc resistance properties also significantly improved by 20% at the concentration of 0.05% GNS. Furthermore, the dielectric strength also improved for the nanocomposites.