Epoxy resins have been well-known as insulation materials in the field of heavy electric equipments such as mold-type transformers, current transformers (CT), potential transformers (PT), metering out-fit (MOF),and gas switching gears, as they have good mechanical and thermal properties, as well as excellent electrical properties [1,2]. In the last two decades, many researchers have developed new epoxy-based composites in consideration of much higher performance with lower cost in electrical applications, and have found that well dispersed nanosized monolayers largely enhanced the electrical properties of epoxy systems [3,4]. When a multilayered silicate particle in micro- size was mixed with a polymer, the polymer chains penetrated into the interlayers, and separated the sheet-like monolayers from each other in the polymer matrix, forming intercalated or exfoliated nonocomposite [5-7].
There are five synthetic methods to prepare polymer/ organophilic clay nanocomposites: (1) in-situ polymerization, (2) direct melt intercalation, (3) solution intercalation, (4) direct layered silicate method, and (5) dispersion and aggregation method [8-10].
In this study,a solution intercalation process was used. An organophilic clay was dispersed in polar methyl isobutyl ketone (MIBK), forming swelled gel structure. Then, epoxy base resin was added to the swelled gel structures, and I-V characteristics, volume resistance and dielectric properties for the cured epoxy/ organophilic clay nanocomposite were estimated.
A commercial DGEBA (diglycidyl ether of bisphenol A) type epoxy resin, whose trade name was YD 128 (Kukdo Chem. Co. Korea), was used. The epoxy equivalent weight (EEW) was 184~190 g/eq, and the viscosity was 11,500-13,500 cps at 25℃. The curing agent was Me-THPA (3- or 4-methyl-1,2,3,6-tetrahydrophthalic anhydride), whose grade name was HN-2200 (Hitachi Chem. Co., Japan). It is widely used in the field of electrical insulation. The tertiary amine type accelerator was BDMA (benzyl-dimethyl amine, Kukdo Chem. Co., Korea).
The organophilic clay was lithium magnesium sodium silicate modified with N-polyoxypropylene N-diethyl N,N-methyl ammonium chloride, whose trade name was Lucentite SPN (Kobo Products, Inc., Japan).
Methyl isobutyl ketone (MIBK, The Lab Depot, Inc., USA) was used as a solvent for swelling the organophilic clay.
Organophilic clay (5 g) or hydrophilic clay (5 g) was swelled in MIBK (200 ml) for 12 hr, and DGEBA (95 g) was mixed with a planetary centrifugal mixer (DH.MX DM1KV, Daihan Sci. Co., Korea) at 2,000 rpm for 12 hr. Then, MIBK was removed at 140℃ in a vacuum oven for 2 hr, and THPA (80 g) and BDMA (0.9 g) were mixed and degassed at 2,000 rpm for 10 min in the same apparatus. The mixture was poured into moulds, in order to carry out I-V test, dielectric test and dynamic mechanical analysis (DMA), and they were cured at 140℃ for 4.5 hr.
2.3.1 DMA analysis
To measure the glass transition temperature (Tg), a shear test was carried out by a dynamic mechanical analyzer (DMA2980, TA Instrument Ltd.) at a frequency of 1.0 Hz and a heating rate of 10 ℃/min. The specimen dimensions were 12.5×7.0×3.0 mm, and the nitrogen purge rate was 110 ml/min.
2.3.2 I-V test
To study the I-V characteristics, specimens of 100 mm diameter and 30 μm thickness were prepared, and were adhered by silver paste between plate electrodes, which were made of 30 mm diameter copper. The I-V curve was obtained by measuring the leakage current in the range of 20 mA ~ 10 pA, using a Keithley model 2410 through a voltage applying rate of 10 V/s till max. 1,100 V, using an equipped source meter.
The atmospheric temperature was controlled at 10~250℃ in a dry oven (Jeio Tech, Model OF-22GW). The resistance was obtained from the slope at each point of the I-V curve, therefore volume resistance was calculated by multiplying the resistance at each point to the value dividing the electrode area by the insulator thickness. The unit was in Ω·cm.
2.3.3 Dielectric test
To study dielectric properties, specimens of 100 mm diameter and 300 μm thickness were prepared, and were arranged between plate-plate electrodes which were made of 30 mm diameter copper. Broadband Dielectric Spectroscopy (BDS) controlled by Novo control Quatro Cryosystem was employed, in order to measure dielectric properties in the frequency range from 10-2 Hz to 106 Hz, and temperature range from 20℃ to 170℃. The BDS was combined with a Solartron SI 1260 impedance analyzer. The analysis was carried out in a nitrogen atmosphere, to avoid the adsorption of humidity from the air.
2.3.4 TEM observation
The morphology of organophilic clay or hydrophilic clay in the epoxy matrix was observed by a high-resolution transmission electron microscope (TEM, Hitachi S-4100). The nanocomposite was cut into ultrathin sections of about 70-90 nm by a Power TOME X microtome equipped with a diamond knife, and the ultrathin sections were placed on a 200 mesh copper grid. The
measurement was performed using an accelerating voltage of 200 kV.
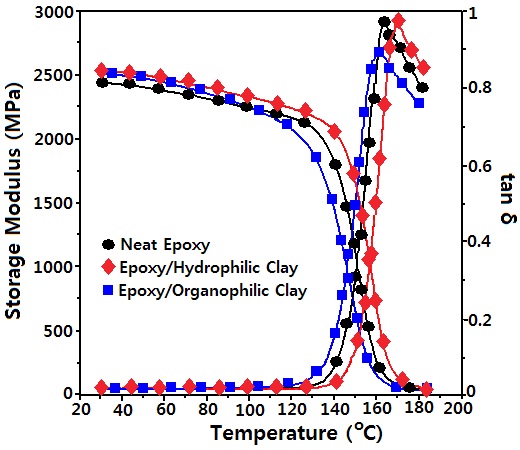
Figure 1 shows DMA curves for neat epoxy, epoxy/ hydrophilic clay composite and epoxy/organophilic clay composite. The storage modulus (G') of the neat epoxy at 30℃ (at glass state) was 2,453 MPa, and those for clay composites were 2,553 MPa, which was ca. 8% higher than that of the neat epoxy. As the atmosphere temperature increased, G' decreased, and abruptly dropped. In epoxy/hydrophilic clay composite, the decreasing rate of G' was lower, and a more rapidly dropping temperature was shown at higher temperature than those of the neat epoxy, while those for epoxy/organophilic clay composite were reversely displayed. As the atmosphere temperature increased, the loss modulus (G") abruptly increased at the glass transition state, which was displayed in the form of tanδ = G"/G'. Glass transition temperature (Tg) was estimated from the peak temperature of tanδ. The Tg value of neat epoxy was 164.1℃, and that of epoxy/hydrophilic clay composite increased by 6.8℃, while that of epoxy/organophilic clay composite decreased by 3.0℃.
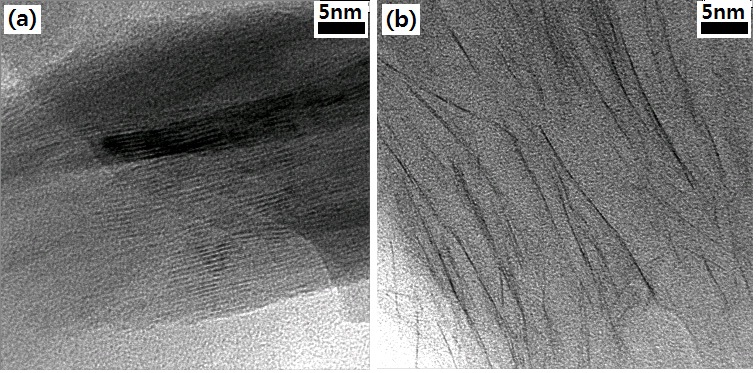
Figure 2 shows the morphology of clays in the epoxy matrix, where the silicate layers are displayed as dark lines. In Fig. 2(a), the silicate layers are orderly arranged, with narrow interlayer distance. This implies that hydrophilic clays were not dispersed into nanolayers within the epoxy matrix. In contrastry, organophillic clay was in an exfoliated state (Fig. 2(b)), as was expected.
From the results of DMA data and TEM observation, hydrophilic clays with micro-scale may be attributed to increment of Tg value, owing to the hydrogen bonding between a hydroxyl
group in the epoxy matrix and the silanol group on the silicate surface. However, when organophilic clays were exfoliated into nano-scaled monolayers, their surface area became broader, so that the hydrogen bonding site increased. However, an increased number of .nano-scaled monolayers may have interrupted the cure reaction between the epoxy resin and the curing agent, resulting in low Tg. Therefore, the Tg value was decreased in epoxy/ organophilic clay composite.
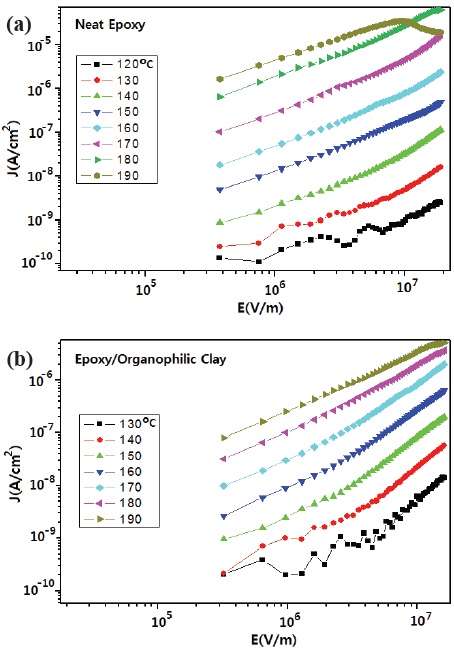
Figure 3 shows electrical conduction curves according to a high electrical field for neat epoxy and epoxy/organophilic clay nanocomposite. As the atmospheric temperature increased, current density, J (A/cm2) increased in the neat epoxy, and in the epoxy/ organophilic clay nanocomposite. This meant that all data were measured at a thermally excited state, and were affected by number of electron carriers, electrostatic capacity and electrical conductivity. Current density at 130~170℃ for each system had two regions, with two linear expressions having different slopes. This increased slowly with increasing electric field, and then the slope increased steeply after ca. 2×10⁶ V/m. However the slope increased steeply from the beginning, at over 180℃. This was due to the fact that the free volume in the epoxy resin abruptly increased over the Tg, so that the epoxy polymer end-chains could easily move in the rubbery state. That is to say, the conduction mechanism of the current density was changed at the inflection points, from ohmic component, to space charge limited current (SCLC) component [11].
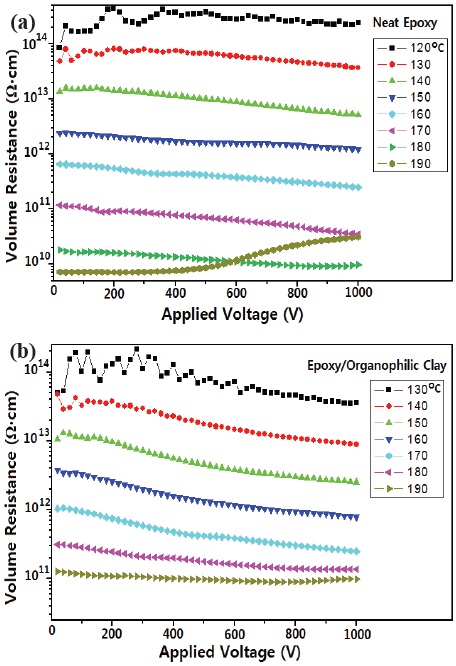
Volume resistance was calculated at each point in Fig. 3, and is displayed in Fig. 4. At the same temperature, volume resistance of the epoxy/organophilic clay composite was higher than that of the neat epoxy. As atmospheric temperature increased, the decreasing rate decreased.
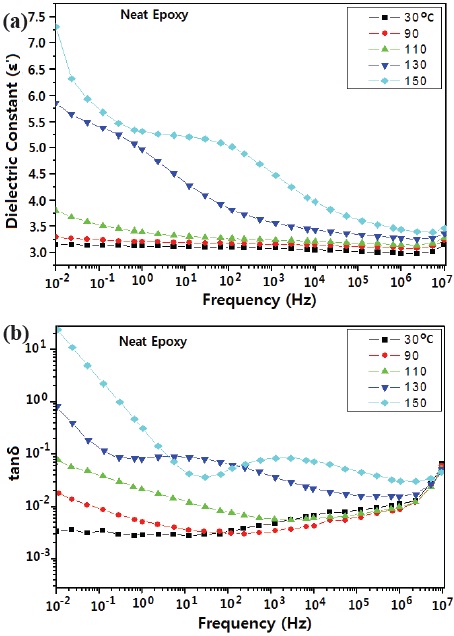
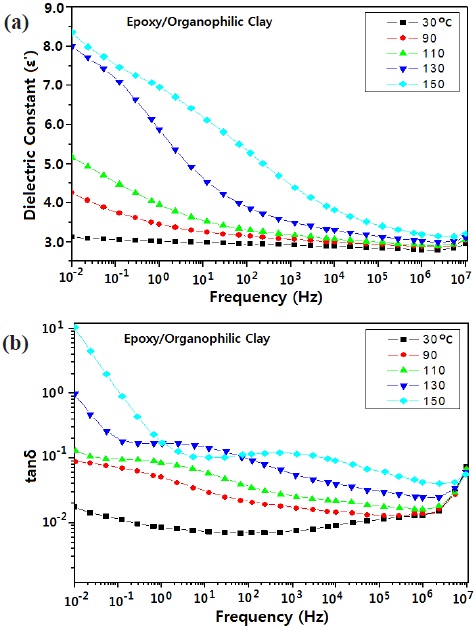
Figures 5 and 6 show the effects of temperature and frequency on the (a) dielectric constant, and (b) dielectric loss (tanδ) for the neat epoxy system and epoxy/organophilic clay nanocomposite. As the temperature increased, the dielectric constant and tanδ increased, and the increase rate around Tg of the epoxy matrix was higher than that below Tg, regardless of the clay addition. When nano-sized clay was added to the epoxy matrix, the dielectric constant increased; this was because nano-sized clay having
higher value (ε = 5.4~8.7) was added to the epoxy matrix (ε = 3~4) [12].
As the frequency increased, the dielectric loss value decreased in the low frequency area, and then increased in the high frequency area, regardless of the nano-sized clay addition; and as temperature increased, the inflection point shifted to higher frequency. Generally, if an inorganic filler has been added to a polymer matrix, it acted as a charge carrier, so that the dielectric loss value increased. This agreed well with Debye's result [13,14]. That is, in the low frequency region dielectric loss was due to interfacial polarization; however in the higher frequency region, electron mobility was disturbed by nano-size clay.
Epoxy/organophilic clay (2.8 wt%) nanocomposite was synthesized by a solution intercalation process, and I-V characteristics, volume resistance and dielectric properties were estimated. TEM observation showed that organophillic clay was in an exfoliated state to form nanocomposite, and the DMA curve showed that the Tg value was lowered by the exfoliated nano-clay. The current density at 130~170℃ for neat epoxy and epoxy/organophilic clay nanocomposite had two regions, with two linear expressions having different slopes. This meant that the conduction mechanism of the current density was changed at the inflection points, from ohmic component, to space charge limited current (SCLC) component. Current density, volume resistance and dielectric constant of the epoxy/organophilic clay composite were higher than those of the neat epoxy.