Nanotechnology applications in coatings have shown remarkable growth in recent years. This is the result of two main factors: 1) increased availability of nano-scale materials, such as various types of nanoparticles, and 2) advancements in processes that can control coating structure at the nanoscale [1-4].
Nano-particles can be incorporated into polymeric coatings to enable significant improvement in targeted properties, i.e. scratch resistance, UV resistance, conductivity, etc. A variety of nano-fillers, such as nano-particles, nano-tubes, and nano-clay, are being incorporated into polymeric materials to enhance material properties, and are increasingly replacing traditional coatings in many commercial applications [1,2].
The desired properties include enhancements in stiffness, toughness, UV absorption, flame resistance, ionic conductivity, and biodegradability [2-4].
For example, incorporating metal-oxide nano-particles, such as nano-alumina and nano-silica, into polymer coating to enhance mechanical durability has become widely utilized in the current anti-scratch and anti-mar technologies [2]. On the Mohs scale of hardness, alumina and silica have hardness numerals of 9 and 7, respectively, and hence are the favorite nano-particles for scratch and abrasion resistant coatings. Silica nano-particles, colloidal or fumed, and clays are among the most widely studied inorganic fillers for improving the scratch/abrasion resistance of transparent coatings. These fillers are attractive from the standpoint that they do not adversely impact transparency of coatings, due to the fact that the refractive indices of these particles closely match those of most resin-based coatings. The drawback to silica-based fillers is that high concentrations of the particles are generally required to show a significant improvement in the scratch/abrasion resistance of coating, and these high loadings can lead to various other formulation problems, associated with viscosity, thixotropy, and film formation.
The use of higher refractive index inorganic oxides in clear coatings, such as alumina, zinc oxide, and titanium dioxide (RI = 1.76, 2.00, 2.50-2.70, respectively), has grown in recent years. As the refractive index difference between the inorganic material and the resin matrix increases, particle size must be reduced, to prevent scattering of light that leads to haze in the composite clear coating [3]. It has been reported that nanosilica can increase the hardness and scratch resistance of a coating, and keep the coating clear at the same time [4,5]. Nano-silica particles could more effectively improve the hardness, abrasion resistance, and scratch resistance of acrylic-based PU coats than micro-silica particles [6]. Nanosilica has enhanced the tensile strength and elongation of PU elastomers; however the modulus and hardness are lower than those of corresponding micro-size filled PU [7]. As a class of polymers, PU are used in large numbers of applications, such as in fibers, foams, elastomers, adhesives, surface coatings, and medical applications [8,9]. PU has been extensively used, due to its excellent physical properties, such as flexibility at low temperature, abrasion resistance, controllable hardness and transparency. However, PU has the drawbacks of low thermal stability and low mechanical strength. Efforts have been devoted to improving the properties of PU by chemical modification of the molecular structure, and by addition of organic or inorganic fillers [10-12]. PU coating is an attractive coating for the automotive industry, because of its excellent properties. These properties, for example, include dimensional stability, adhesion to various substrates, resistance to chemicals, solvent, water, abrasion resistance, thermal stability, flexibility, and toughness [8-12].
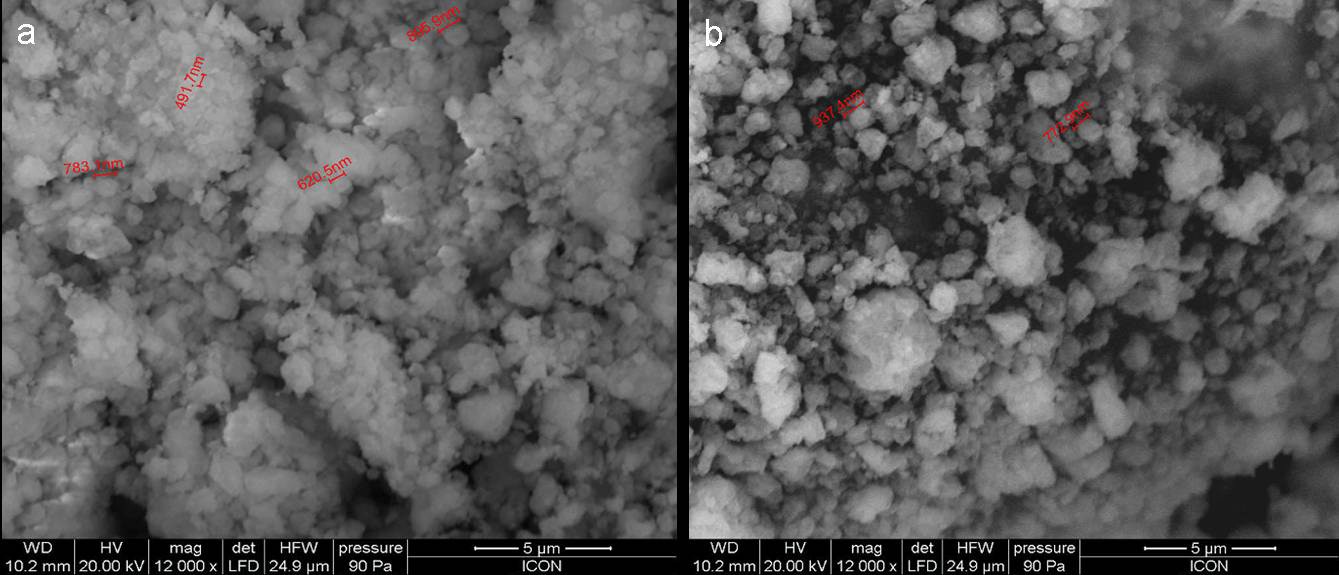
The PU resin used in the study was obtained from M/s Shree Surya coatings, Nasik, India and was used as such with the sold percentage of 70%. The hardener used for the curing of the polyol was from Shree Surya coatings, Nasik. The nano-alumina with trade name AEROXIDE® Alu C, which is basically highly dispersed fumed metal oxide with a specific surface area (BET) of 100 m2/g and primary particle size of 13 nm, and nano-silica with trade name AEROSIL®300, which is basically hydrophilic fumed silica with a specific surface area (BET) of 300 m2/g and primary particle size of 7 nm, were obtained from Evonik Industries. Scanning electron microscope (SEM) images (Figs. 1(a) & 1(b)) show the presence of agglomeration in both the nano fillers, and particle size in the range of (300-900) nm. Organic solvents, such as xylene, were of laboratory reagent grade, and were distilled before being used for the experiments, the solvent fraction falling between ± 1℃ of the respective boiling points.
2.2 Preparation of the nanocomposites
The silica and alumina nanoparticles were dispersed in PU matrix at different concentrations of 0.1, 0.5, 1.0, 1.5, 3.0 and 5.0 wt %, by means of a shear mixer with ultrasonicator (30 W, total energy up to 8 kJ). The polyol as such is very viscous, having 70% solids, so before mixing it was diluted to about 45%, with xylene as the solvent. Good dispersion was achieved by continuous mechanical stirring with RPM 1500, and ultrasonication for 6 hours at 50℃. Films of ~ 1 mm thickness were formed by casting over a pool of mercury in a Petri-dish at room temperature, after adding the hardner in 2:1 volume ratio in the PU resin, followed by curing for 12 hrs at room temperature. The films were post cured for 2 hours at 80℃. Films of various filler concentrations were prepared through careful control of the processing parameters. The composites were then allowed to stabilize for 7 days at 25 ± 1℃ and 50% relative humidity, before any testing was carried out.
2.3 Preparation of the coated panels
Mild steel (MS) panels of size (10 × 10 cm) were de-greased and cleaned, and then roughened mechanically with emery paper (grade no. 600), prior to coating. Both nano-silica dispersed nano-alumina dispersed coating formulations were applied using spray painting onto the MS substrate, to achieve uniformly coated panels with good finish. The coated panels were allowed to oven cure for 20 min at 80℃.
2.4.1 Morphology
For the morphological observations, the obtained composites were frozen in liquid nitrogen anal, then quickly fractured. The fractured surfaces were observed using field emission SEM (FEI Quanta 200 machine) with a tungsten source, working distance of 10mm and beam intensity of 30 kV.
2.4.2 Mechanical properties
The mechanical properties of the composites were evaluated using a Lloyd 50 universal testing machine with a 5 kN load cell in the case of tensile properties, with a jaw speed of 25 mm/min and a gauge length of 5 cm. The samples used for evaluation of mechanical properties had dimensions of 25.5 × 12.6 × 1 mm.
2.4.3 Thermal properties
The glass transition temperature of the composites was evaluated on a Mettler Toledo DSC822e machine with a sample weight of 10-20 mg and a heating rate of 10℃/min. The sample was cycled from 25-250℃ and 250-25℃, and the same repeated. The glass transition was evaluated from the second run, to eliminate thermal history from the sample. The test was conducted under a N2 flow of 10 ml/min. Thermo gravimetric analysis was evaluated on a Mettler-Toledo TGA/DSC1 machine with a heating rate of 10℃/min in a nitrogen atmosphere, maintained at a flow rate of 20 ml/min. For each test, 10-20 mg of the sample was taken, and the test was carried out in a 50 ml alumina crucible. The sample was cycled from 25-500℃.
2.4.4 Water absorption behavior
The water absorption test was carried out in reference to the specifications of ASTM D570. The samples were molded into the form of discs 5 cm in diameter and 3.2 mm in thickness. The discs were washed with acetone, dried completely and weighted to the nearest 0.0001 g to get the initial weight, and then immersed in deionised water with a temperature of 25±5℃. After certain time intervals, the samples were taken out of the water; the surface water was completely removed using a dry cloth, and the specimens were immediately weighted. The sample mass change resulting from the water uptake (expressed as a percentage) was calculated.
2.4.5 Physical properties of the coating
2.4.5.1 Viscosity
The viscosity of the polyol-nanoparticles dispersions were evaluated on a Brookfield DV II Proviscometer at 50 rpm with 600 ml of the sample being maintained at 25℃ using a constant temperature bath, as per the ASTM D 4016 test method.
2.4.5.2 Dry film thickness
The dry film thickness was measured by using a dry film thickness gauge, as per the ASTM D1400 standard.
2.4.5.3 Adhesion
The test for adhesion was carried out on coated MS panels. The test was done using a Cross hatch tester of hatch gaps of 2.54 cm, as per the coating thickness, using the test method ASTM D 3359-90.
2.4.5.4 Flexibility
The flexibility of the coating was measured in terms of the “crack resistance”, and the tests were carried out on a standard conical mandrel using coated MS panels, as per ASTM D 4145. If a crack formed, then the length of the crack (measured in centimeters) from the narrow end of the cone to the opposite edge of the crack was reported. If no crack was observed, then a value of “0” was reported.
2.4.5.5 Hardness
The pencil hardness of the films was evaluated on MS panels, using a range of pencils from 6B to 6H, as per the standard test method ASTM D3363.
2.4.5.6 Falling ball impact test
The test was carried out on MS panels. The test was carried out by dropping a 0.9 kg weight from a maximum height of 50.8 cm and from 6.35 cm. The weight was dropped onto a coated surface i.e. “intrusion”, and on the reverse of the panel with reference to the coated surface i.e. “extrusion”, using the standard test method ASTM D 2794.
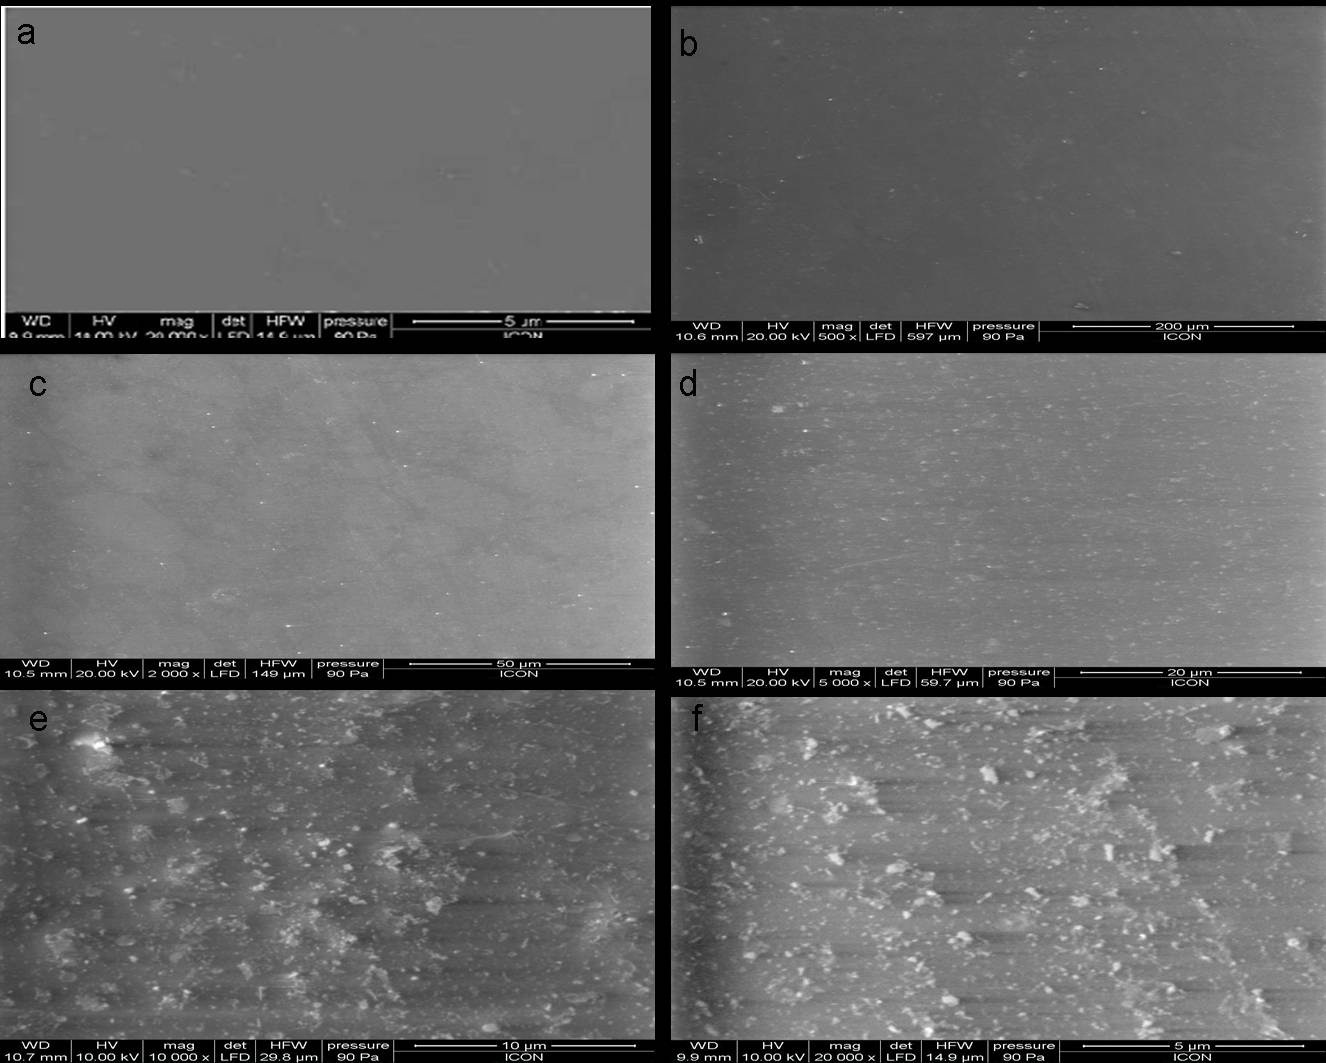
Figure 2 shows the SEM micrographs of neat-PU film and the films modified with nano-silica particles at different loading levels. Figure 2(a) represents the SEM micrograph of neat PU film, and it can be clearly seen that the film formed is uniform, and free from heterogeneity on the surface. After modifying PU with nano-silica particles, the composite film modified with 0.1% nano- silica particles (Fig. 2(b)) shows uniform surface morphology,
indicating proper dispersion of nano-particles. Similar uniform surface morphology is also seen with a nano-silica loading of 0.5%, as seen in Fig. 2(c). The surface micrograph of the composite film modified with 1.0% nano-silica particles (Fig. 2(d)) shows good uniform dispersion all over the polymer matrix, while surface micrograph of the composite film modified with 3.0% & 5.0% nano-silica particles (Fig. 2(e) & Fig. 2(f)) show white spots all over the surface, indicating agglomeration of the nano-particles.
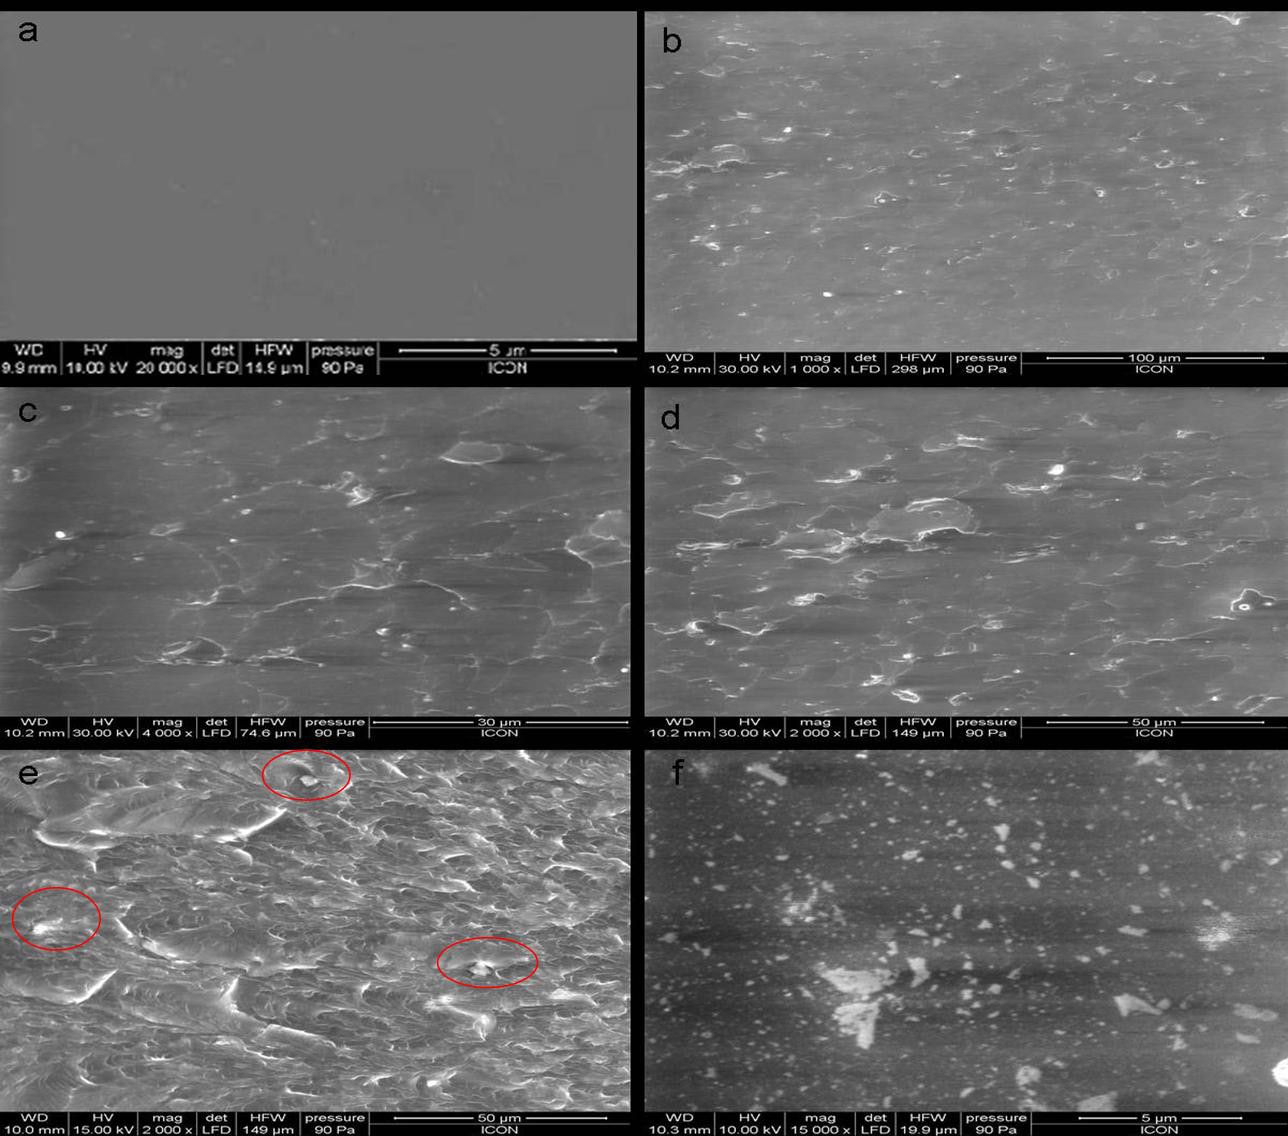
Similarly, Figure 3 shows SEM micrographs of neat-PU film and the films modified with nano-alumina particles in different loading levels. Figure 3(a) represents a SEM Micrograph of Neat PU film, with a uniformity and homogeneity that is clear from the figure. Figures 3(b), 3(c) & 3(d) show SEM micrographs of nano-alumina loadings of 0.1%, 0.5%, and 1.0% respectively into the polyurethane matrix. In Figs. 3& 3(d), it is observed that there is even distribution of nano-alumina into the
PU matrix, which reveals good dispersion of nano-alumina in PU. Similarly, Fig. 3(e) shows the 3.0% nano-alumina loaded PU. In the surface micrograph of 3.0% nano-alumina loaded PU (Fig. 3(e)), although there is a good dispersion of nano-alumina into the polymer matrix, there is presence of small agglomeration, marked in red. The surface micrograph of the composite film modified with 5.0% nano-alumina particles (Fig. 3(f)) shows white spots all over the surface, indicating agglomeration of the nano-particles.
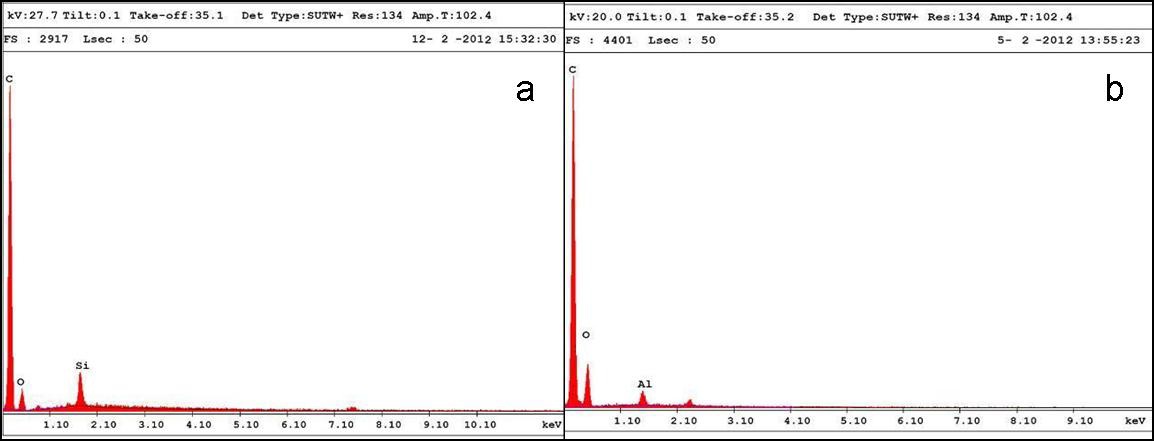
The presence of silica and alumina is confirmed from the EDAX results (Fig. 4), with 1.0% of silica and 1.0% of alumina in the PU matrix.
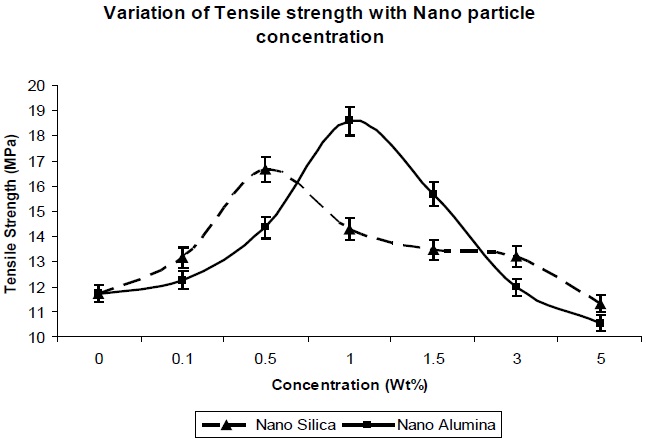
Figure 5 and Fig. 6 show the effects of addition of nano-particles on the tensile strength and elongation at break, respectively, of the resultant composites. As the nano-particle concentration increases, the tensile strength increases (Fig. 5) up to a certain limit, but once percolation is achieved, there is a decrease in the tensile strength with increase in the concentration of nano particles. The increase in tensile strength for both the nano particles can be explained due to the large specific surface area of the nano-particles, which leads to an increase in the mechanical properties of the polymer.
Nano-silica particles showed better tensile strength at lower concentration (from 0.1 Wt% to 0.5 Wt%), in comparison to nano-alumina at the same concentration (Fig. 5), which is due to the higher surface area of the nano-silica, in comparison to nano-alumina. But as seen in Fig. 6, at 1.0 Wt% & 1.5 Wt%, nano-alumina has high tensile strength, in comparison to nano-silica. This is due to better mechanical reinforcement of alumina nano-particles
in the polymer matrix. There is no agglomeration at this concentration for nano-alumina, due to its lower surface area in comparison to nano-silica, so there is better dispersion and interaction of nano-alumina, in comparison to-nano-silica. With further increase in the concentration, there is decrease in the tensile strength value for both the composites, due to agglomeration of the nano particles in the polymer matrix, which leads to the reduction in the reinforcement action of both the nano fillers.
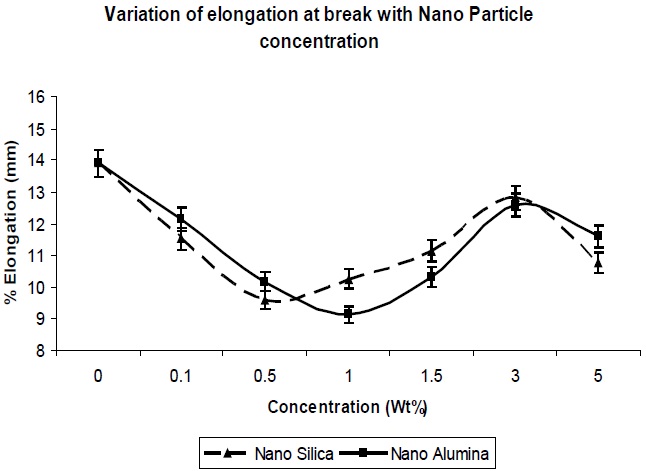
The elongation at break was also determined for the composites, and its trend can be seen in Fig. 6. In general, the tensile strength and the elongation at break are antagonistic in nature [10]. The addition of nano-particles resulted in a decrease in the elongation at break of the resultant composites, up to a concentration level of 1.0 Wt% (Fig. 6); this was expected, since nano-particles behave as reinforcing fillers. The presence of nano-particles in free volume limits the chain segmental motion, and reduces the flexibility of the matrix chains, so there is a decrease in the elongation at break. Again Fig. 6 shows that as the concentration of nano-particle increased further, the elongation at break increased, since agglomeration of particles would result in a reduction of the reinforcing action of the filler. This is reflected in the reduction in tensile strength, as well.
3.3.1 Differential scanning caloriemetry
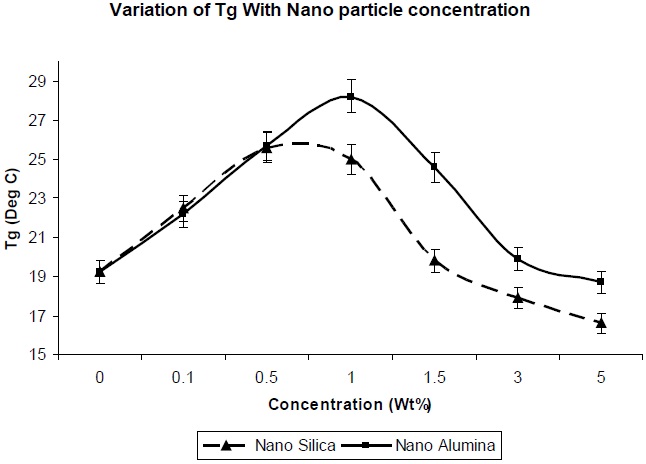
Figure 7 shows the effect of addition of nano-particles on the glass transition temperature of the resultant composites. The glass transition temperature is dependent on the molecular mobility of the polymer chains in the network. The greater the mobility of the chains, the lower the glass transition temperature. Since the surface area of nano-particles is high, a high polymer-filler interaction would restrict polymer chain mobility, and hence increase the glass transition temperature. The entanglements between chains could increase the Tg of the polymer [12]. As observed in Fig. 7, there is a decrease in the Tg value of nano-silica/PU composite, in comparison to nano-alumina/PU composite at the same level of filler concentration, which is due to the lesser entanglement of nano-silica between the polyol soft segments. This is because the regularity of the PU chain was distributed, partly because of the reaction between NCO group and the OH group of the nano-silica, and the soft segment of the PU chain became comparatively more mobile.
3.3.1 Thermo gravimetric analysis
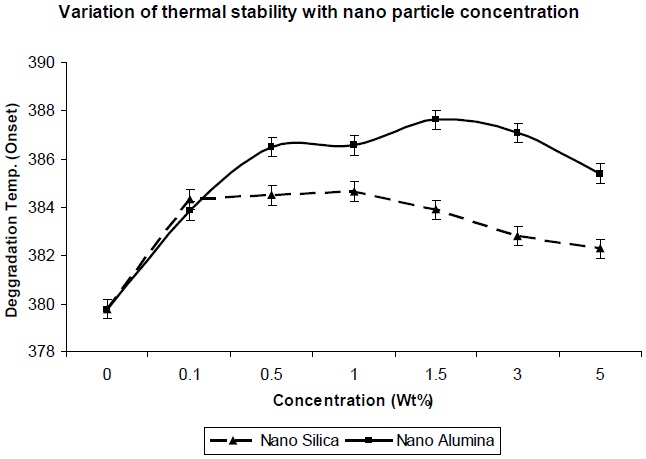
Figure 8 shows the effect of addition of nano-particles on the thermal degradation temperature of the resultant composites. From Fig. 8 it was observed that degradation temperature increases with increase in nano-particle concentration, which can be explained in that if surface area of the nano-particles is high, a high polymer-filler interaction would restrict polymer chain mobility, and hence increase the glass transition temperature; and hence the degradation temperature also increases. As observed in Fig. 8, the thermal degradation temperature for nanosilica/ PU composite is lower, in comparison to nano-alumina/ PU composite at the same level of filler concentration, which is due to lesser entanglement of nano-silica between the polyol soft segments. But in both the cases,al degradation temperature is higher than the pristine PU matrix.
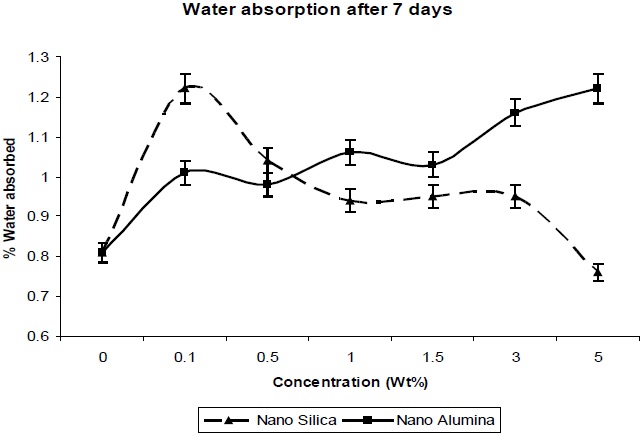
From Fig. 9 it was observed that slight or very less absorption occurred in distilled water, water being a nonsolvent for polyurethanes. Nanocomposites absorb more water than does unfilled polyurethane. Also, the absorption of water increases with the content of nano-filler. This may be due to the high specific interfacial area (particles area per composite volume) where water may collect, and the nano-composites may increase volume [13].
Nano-particles create free volume in the polymer matrix; thereby water molecules penetrate into the polymer matrix easily, without restriction. The absorbed water quantity is very much less.
3.5 Physical properties of coating
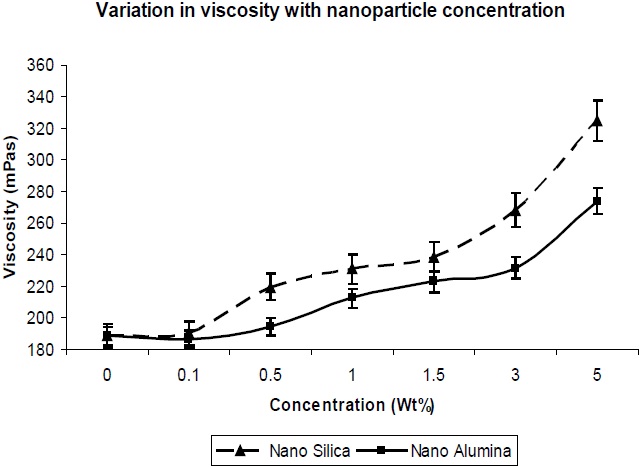
The viscosity is important, in terms of the processability of the composition, and hence was measured. It could be observed that the addition of silica and alumina to the composition resulted in a large increase in viscosity. This would indicate that the silica and alumina nano-particles have interaction with the polymer with reference to interfacial interaction, as well as the highest surface area available for contact with the polymer. In Fig. 10, it is observed that the viscosity increase with nano-silica is much higher in comparison to that of nano-alumina, which is due to the larger surface area and finer particle size of nano-silica in comparison to nano-alumina, which leads to better interaction of the nano-silica particles with the PU matrix, and results in higher viscosity.
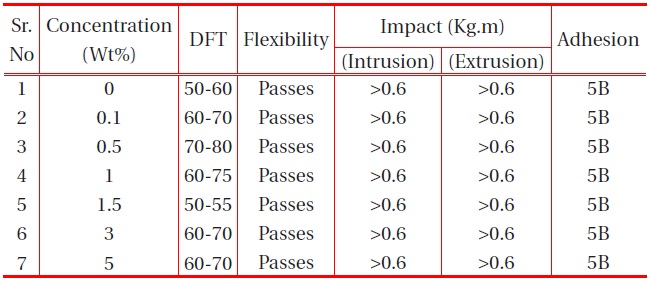
The other physical properties, like dry film thickness (DFT), adhesion, flexibility, hardness and falling ball impact of the coating were studied, and the results are provided in the table below:
It is observed from Table 1 and Table 2 that all the polyurethane coating samples passed the flexibility test, which indicates that the polyurethane coatings were sufficiently flexible, but tough. Moreover, increase in nano-particle concentration did not
[Table 1.] Effect of nano-silica filler on the physical properties of PU films on MS.

Effect of nano-silica filler on the physical properties of PU films on MS.
[Table 2.] Effect of nano-alumina filler on the physical properties of PU films on MS.
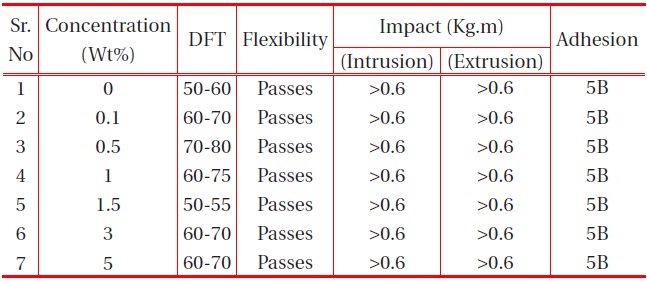
Effect of nano-alumina filler on the physical properties of PU films on MS.
affect the flexibility. It was also observed that the adhesions of all polyurethane nanocomposites coatings were excellent, regardless of cross-linking density. The pencil hardness was observed to increase slightly with an increase in nano-particle concentration and cross-linking density. This can be explained by the fact that the alumina and silica nanoparticles on Mohr’s scale of hardness have hardness numerals of 9 and 7, respectively; and also hardness of the coating is proportional to the cross-linking density of the coating. An increase in cross-linking density would decrease the ability of the surface coating to withstand rapid deformation. However, the addition of a small concentration of nano-particles did not affect the impact of the coating.
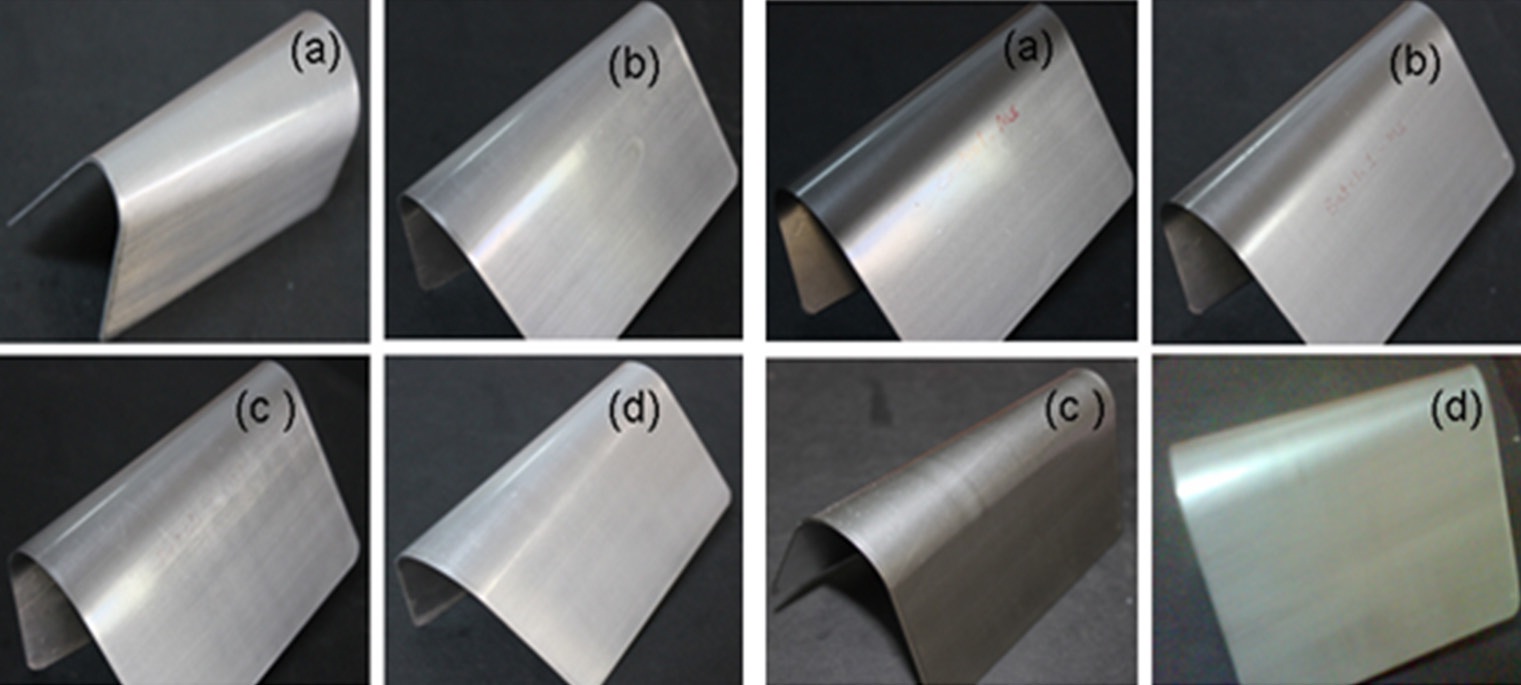
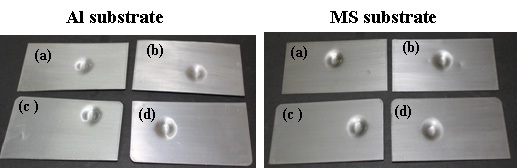
The coating withstands the deformation forces, without a break in the coating. Figure 11 shows the coated panels with neat PU and at different concentrations of nano particle samples subjected to impact test. After careful examination of the samples (Fig. 11), no traces of cracks were observed, indicating excellent impact resistance of the coatings. Similarly Fig. 12 coated panels with neat PU and the nanoparticles at different concentrations subjected to the flexibility test. As observed from Fig. 12, no trace of crack was observed at the bend angle, which implies the best flexibility of PU, which is not affected by the lower concentration of the nano particles.
3.6 Effect of moisture absorption
3.6.1 Effect of moisture absorption on Tg
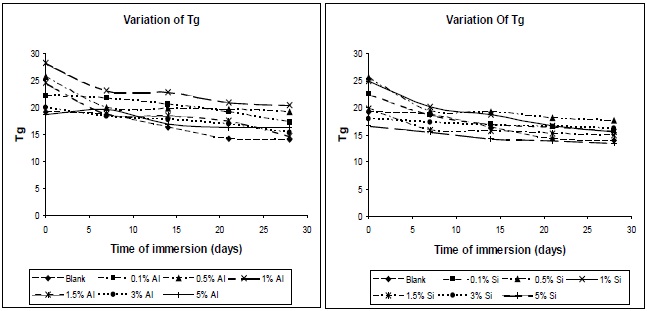
The variations in glass-transition temperature of polyurethane composite specimens with time of immersion at different filler concentrations are shown in Fig. 13. The glass-transition temperature of polyurethane materials drops with the increase in moisture content; this finding is confirmed by the results of DSC. The effect of water on the plasticization of the polymeric network can be measured by the change of Tg with the water content. The fact of this is that water acts as a plasticizer of the matrix, and lowers the Tg. The water molecule interferes with the hydrogen bonds
between the polymer chains, and this increases the chain mobility, and decreases the glass transition temperature.
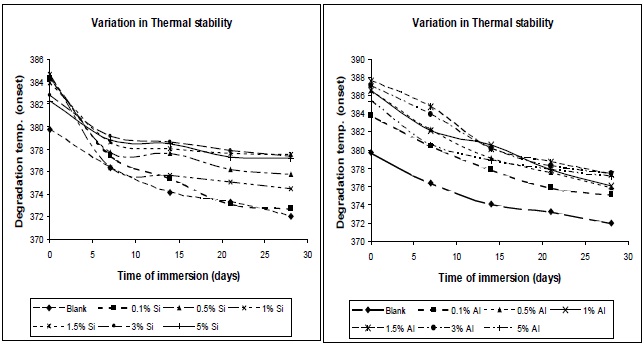
3.6.2 Effect of moisture absorption on thermal stability
From Fig. 14, it was observed that thermal stability decreases with moisture absorption. The absorbed water causes plasticization of the polymer matrix; due to this chain mobility increases, and glass transition temperature and degradation temperature decrease.
3.6.3 Effect of moisture absorption on mechanical properties
The permeation of water into the composites caused debonding to occur at the polymer-filler interface, which resulted
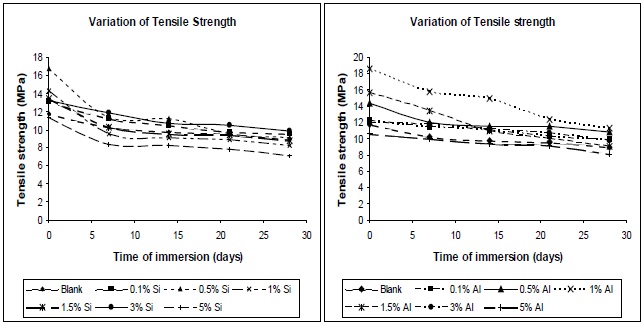
in a reduction in the stress transfer efficiency, leading to a reduction in the mechanical properties of the composites. Figures 15 (a) and (b) show the tensile variation of the composites with time of immersion, at different filler concentrations. From the plots it can be seen that the composites show a decrease in tensile strength on immersion in water, irrespective of the type of filler used. Pure polyurethane also evidenced a decrease in its tensile strength. At higher concentrations, the tensile strengths of the composites, both before and after water immersion, were found to be lower; this was due to the formation of aggregates in the composites.
The decrease in tensile strength with water absorption is due to the diffusion of water in composites, which plasticizes the matrix. The uptake of water is usually measured by wt. gain, and the mechanism of water diffusion is characterized by Fick’s law. At higher silica and alumina concentration, the interface between the inorganic fillers and matrix might be de-bonded by water. The higher the concentration of nano-particles, the more bonds are de-bonded, and the more water can be contained in this interfacial region, hence more plasticization of film, hence lower tensile strength. The initial uptake of water results in plasticization of the polymer matrix, such that further ingression of water into the void spaces within the sample does not significantly alter the mechanical performance. After 21 days of water immersion, all the composites showed a steady tensile strength. These results can be proven also on the basis of Tg. The decrement of glass transition temperature suggests there may be a degradation of mechanical properties of polyurethane nano-composites, due to water absorption [14].
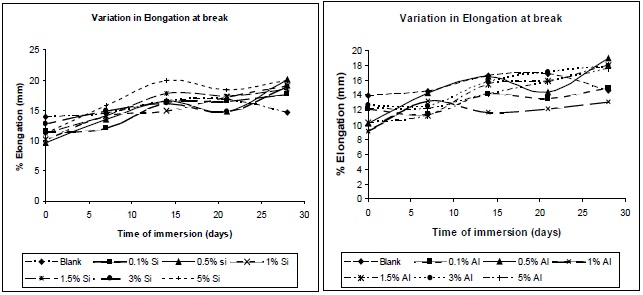
Figures 16 (a) and (b) illustrate the nature of the elongation of break of the composites with variation of immersion time, at different filler concentrations. A similar trend as that observed for the tensile strength was observed for the elongation at break, allowing this residual water to act as a plasticizer in the composite, hence chain mobility increases, resulting in increase in elongation at break.
In the present study, it can be concluded that the addition of nano-particles to polyurethane resin resulted in an increase in mechanical and thermal properties. The optimum concentration for silica was found to be 0.5 wt%, and for alumina 1.0 wt%, based on polyurethane resin, after which there was a decrease in properties, caused by particle agglomeration.
i) At 1.0 wt% concentration nano-alumina, and at 0.5 wt% nano-silica have high tensile strength; this is due to mechanical reinforcement nano-particles. The increase in tensile strength is also explained by increase in cross-linking density, with the addition of nano - particles.
ii) Thermal properties, like the thermal degradation temperature and glass transition temperature, also improved with the addition of nano particles.
iii) The absorbed water plasticizes the polyurethane matrix, hence mechanical and thermal properties decreases. The tensile strength of pure polyurethane sample decreased much more after water absorption than did polyurethane nano-composite. After 21 days of absorption, there was not much effect on properties.