Rapid advances in biotechnology have enabled the development of transgenic crops with various beneficial traits that provide resistance to herbicides, herbivores, and pathogens (James 2010). When properly managed, herbicide-resistant crops are effective and useful because the successfully controlled application of herbicides creates strong selection pressure for the growth and survival of transgenic genotypes that harbor herbicide resistance (Owen and Zelaya 2005). Transgenic plants are expected to achieve greater agronomic performance and yield benefit than non-transgenics. However, underlying costs associated with resistance to herbicides, herbivores, or pathogens may lead to a decrease in plant performance (reviewed by Warwick and Black 1994, Bergelson and Purrington 1996).
The expression of transgenic resistance may incur costs, which is evident under conditions that do not provide benefits of having transgenic traits (Purrington and Bergelson 1997). A number of empirical studies detected fitness costs of transgenes for transgenic crops grown in environments where the transgene is not beneficial, such as environments with a lack of herbicide treatments (Brandle and Miki 1993, Hails et al. 1997), herbivores (Vacher et al. 2004, Chen et al. 2006, Kim et al. 2008, Xia et al. 2010), pathogens (Ortelli et al. 1996, Bartsch et al. 2001, Romeis et al. 2007), or abiotic stresses (Hsieh et al. 2002a, b, Jackson et al. 2004). Most of these studies simply compared plant performance or fitness measures between transgenic plants and non-transgenic counterparts, while relatively little research has evaluated the relationship between transgenic resistance and a decline in competitive ability (but see Fredshavn et al. 1995, Fredshavn and Poulsen 1996, Ramachandran et al. 2000).
Transgene escape to non-transgenic crop populations is a cause of crop management problems (Hails 2000, Hails and Morley 2005). Seeds of herbicide-resistant crops may be dispersed into the nearby non-transgenic field, or pollen containing transgene may form hybrids with nontransgenic plants. Consequently, transgenic plants may flourish in mixed stands with non-transgenic plants in environmental conditions that do not provide benefits to herbicide-resistant plants (
In this study, we examined whether transgenic rice bears costs to agronomic performance and competitive ability that are not incurred by its parental non-transgenic rice. We used an herbicide-resistant transgenic line (Line 1, T3) developed by inserting a protoporphyrinogen oxidase (PPO) gene into ‘Dongjin’, a conventional cultivar (Yang et al. 2006). Originally obtained from a soil bacterium,
Our competition experiment was conducted in a glasshouse at the Korea Research Institute of Bioscience and Biotechnology (KRIBB), Daejeon, Korea (36° 22´ N, 127° 21´ E). On 8 August 2005, seeds of transgenic and nontransgenic rice were sown in Wagner pots (surface area 0.02 m2) filled with a mixture of commercial potting soil and sand (1:1, v/v). Prior to planting, all seeds were treated with 25% prochloraz solution to prevent fungal infection. We used a multiple deWit replacement series design (or “response surface design”; Inouye 2001) in which plants are grown at various proportions over multiple densities. Seedlings were thinned to four densities (4, 8, 12, or 16 plants per pot), which was equivalent to 200, 400, 600, or 800 plants per m2. For each density, we set up replacement series of five treatments that varied the proportions of transgenic vs. non-transgenic plants at ratios of 0:1, 0.25:0.75, 0.5:0.5, 0.75:0.25, and 1:0 within individual pots. Our purpose here was to examine whether planting proportion affects the performance of transgenic and nontransgenic plants while accounting for a broad range of density situations where transgenic plants are allowed to grow nearby non-transgenic plants. All treatments were replicated four times for a total of 80 pots. Plants were grown under a 16-h photoperiod and a 30℃/25℃ thermoperiod. When seedlings were 3 to 5 cm tall, their pots were flooded to simulate the condition of a rice paddy field. After flowering, all plants received standard fertilizer solution described previously (Yoshida et al. 1976).
On 19 December, the aboveground parts of the plants were harvested and dried in a convection oven at 80℃ for 120 h. At the time of harvesting, their agronomic traits were quantified on a per plant basis to compare performances between transgenic and non-transgenic rice: plant height; biomass,
An analysis of variance (ANOVA) was used to test the effects of genotype (non-transgenic vs. transgenic), plant density, genotype proportion (monoculture vs. mixture), and their interactions on plant performance. Prior to analysis, data for the nine traits (on a per-plant basis) were transformed to meet the assumptions of normality and homoscedacity. Plant height, biomass, numbers of tillers and panicles, seed weight, and flag leaf area were log-transformed, while the number of seeds was squareroot transformed. Shattering rate and the proportion of ripened grains were arcsine-transformed. Differences in performance between transgenic and non-transgenic plants in monocultures and mixtures were detected by applying Tukey’s HSD tests.
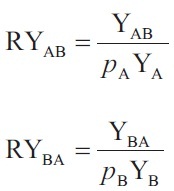
We also evaluated the competitive ability of transgenic vs. non-transgenic plants based on relative yields for biomass and seed weight per pot. Relative yield (RY) is defined as the ratio between yield of species A in a mixture containing species B and the yield of species A in monoculture (Fowler 1982). The relative yields of A (RYAB) and B (RYBA) are calculated as:
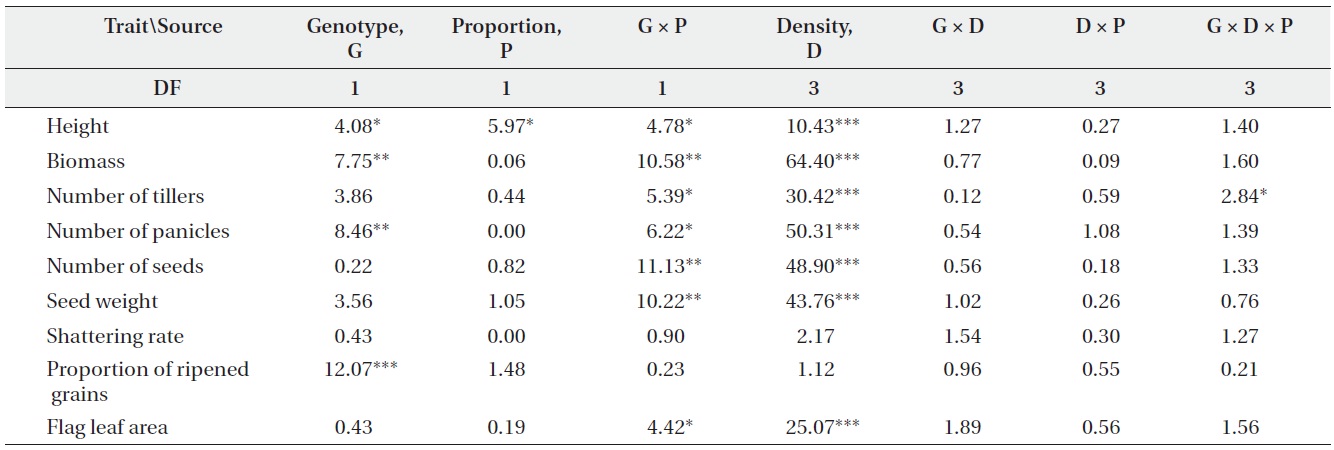
F-values from ANOVA testing the effects of genotype (non-transgenic vs. transgenic), plant density, genotype proportion (monoculture vs. mixture), and their interactions on plant performance (DF, degrees of freedom; *, P < 0.05; **, P < 0.01; ***, P < 0.001).
where YAB is the yield of A when grown in mixture with B, YBA is the yield of B when grown in mixture with A, YA is the yield of A when grown in monoculture, YB is the yield of B when grown in monoculture,
Only a few traits were significantly affected by either genotype or planting proportion, whereas genotype by proportion interactions were significant for most traits (Table 1). These results suggest that different competitive environments may shift the relative performance between transgenic and non-transgenic plants. Those performance traits also varied widely with density, but there were almost no significant differences caused by density and its interactions with other variables. The changes in plant performance under competition were closely examined
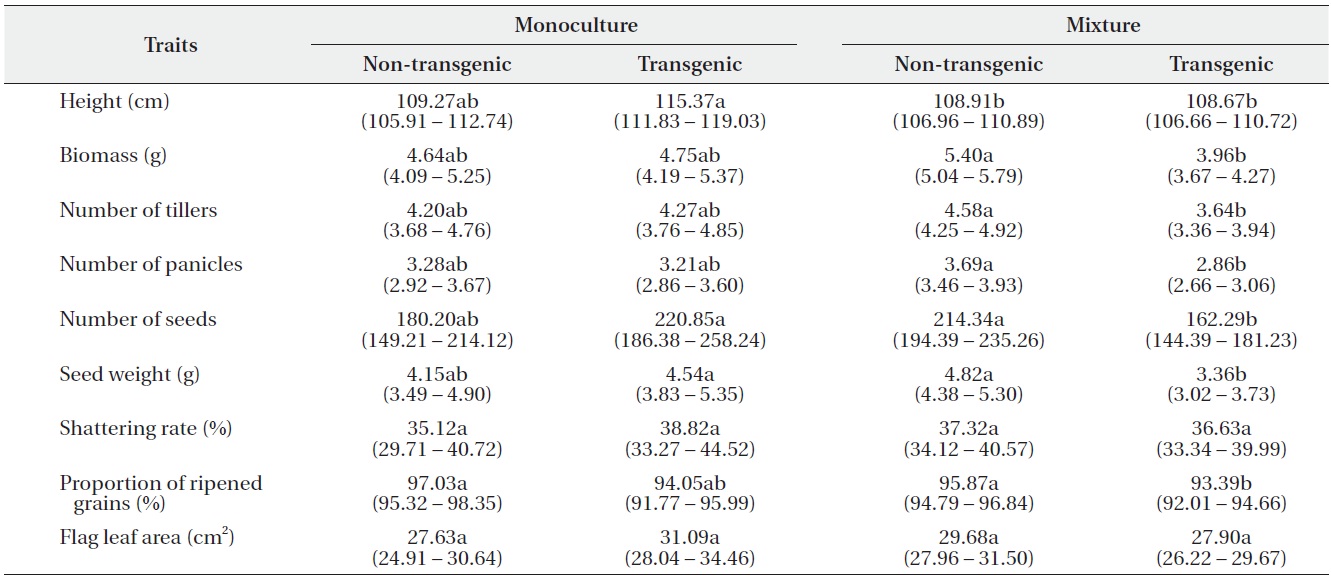
using Tukey’s test (Table 2). In monocultures, performance did not differ significantly between transgenic and non-transgenic rice. However, when grown in mixtures, the performance of non-transgenic plants was significantly greater than transgenic plants with regard to biomass; numbers of tillers, panicles, and seeds; seed weight; and the proportion of ripened grains.
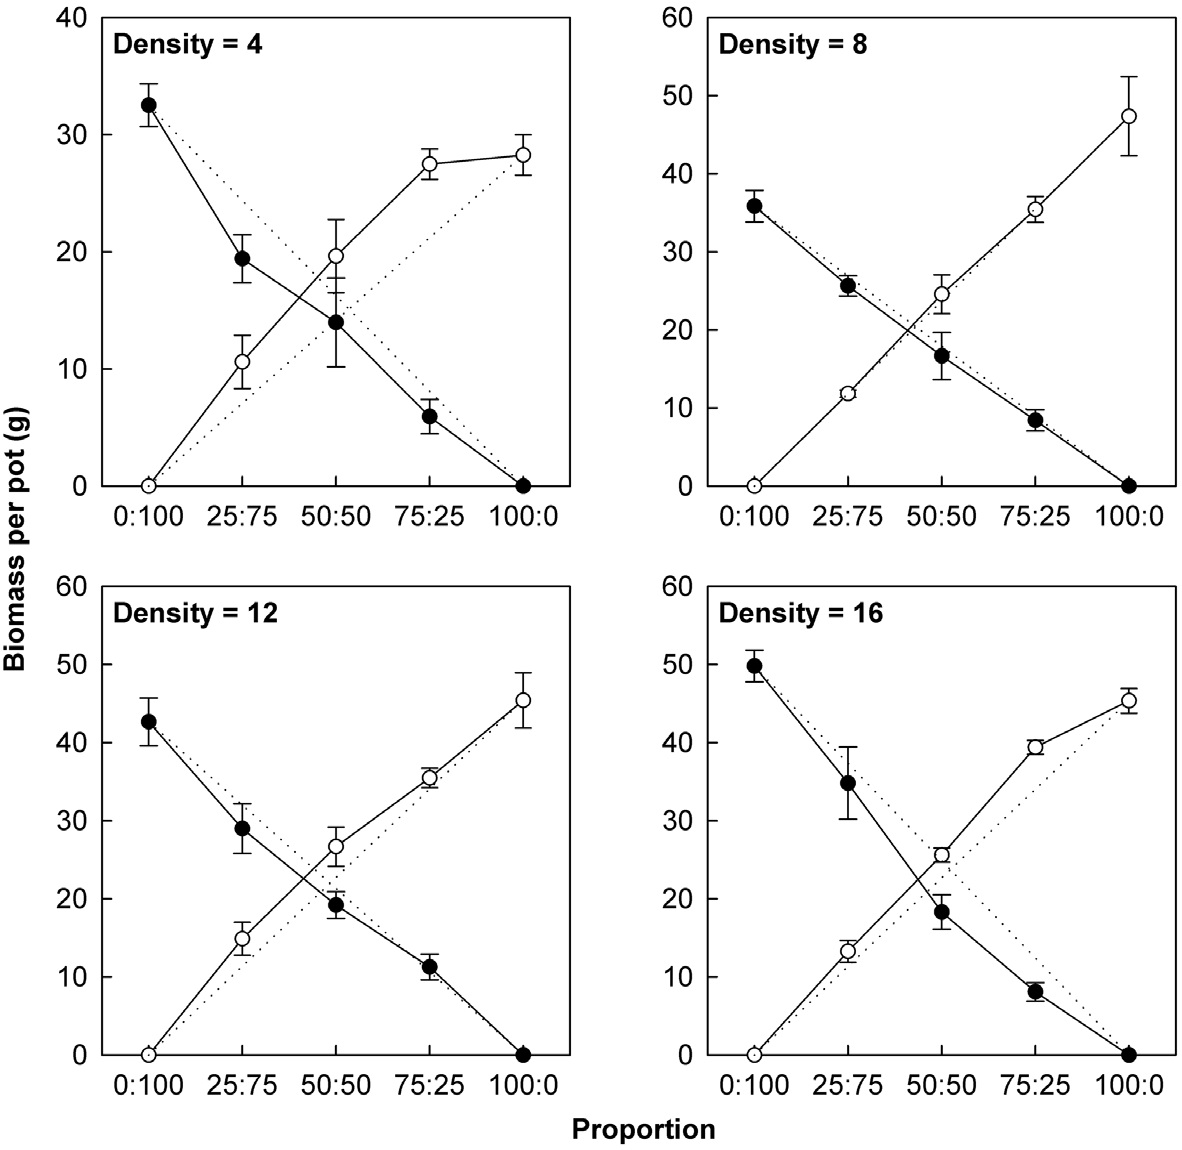
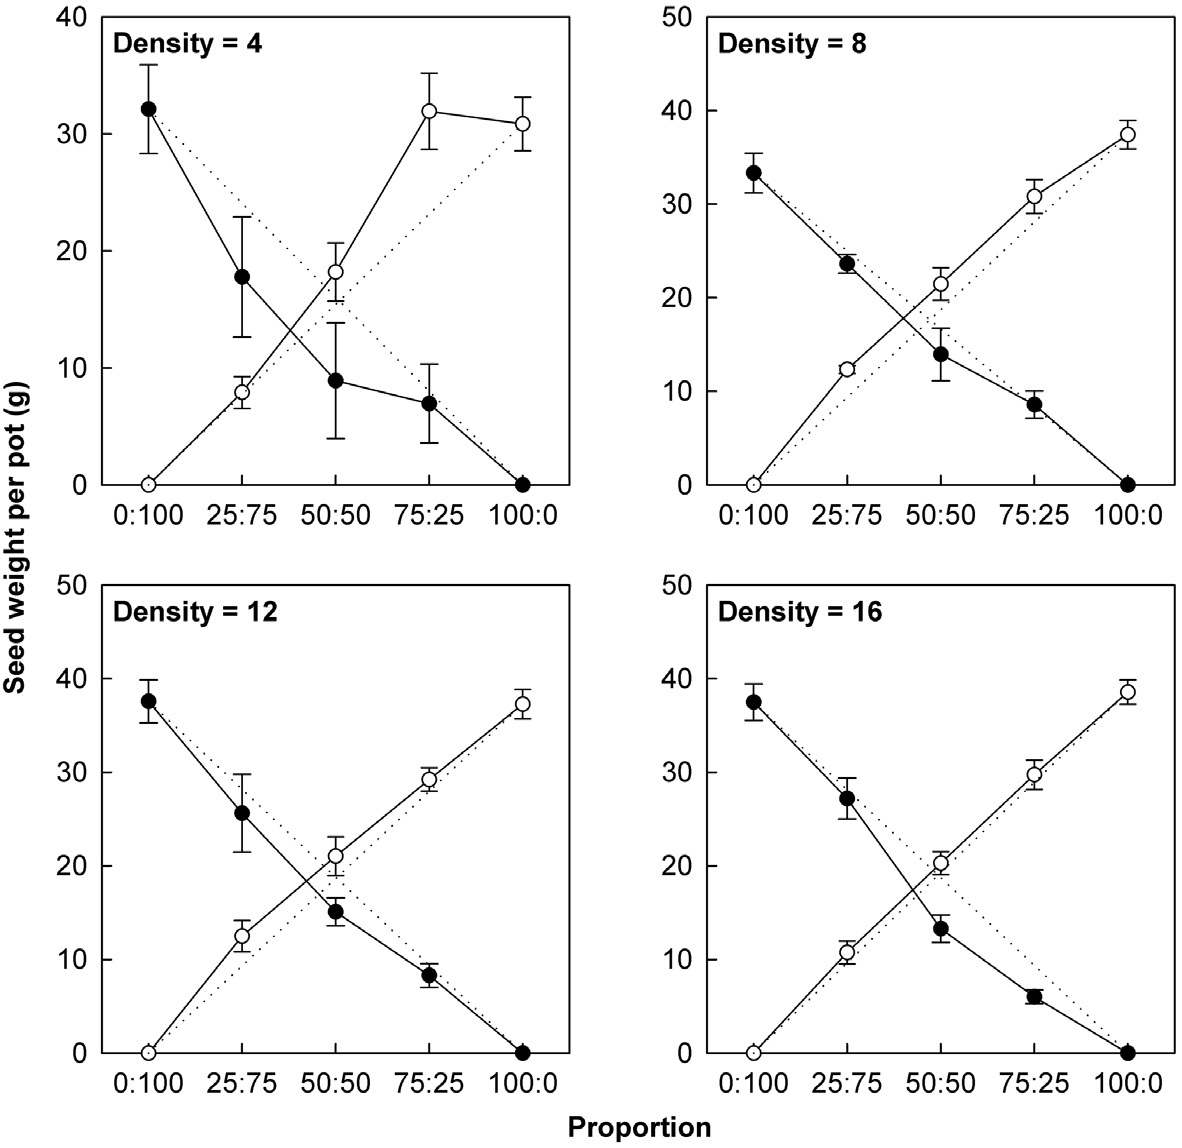
Actual yields by transgenic and non-transgenic plants at each density were quantified in terms of biomass and seed weight (Fig. 1, 2). At certain proportions and densities, we noted that the yields of non-transgenic plants were greater than expected, whereas those of transgenic plants were smaller than predicted. These findings were

Least square means (95% confidence intervals) for nine traits (per-plant basis) of non-transgenic and transgenic rice grown in monocultures or mixtures. Trait means followed by different letters in the same row are significantly different at α = 0.05, after Tukey’s HSD test.

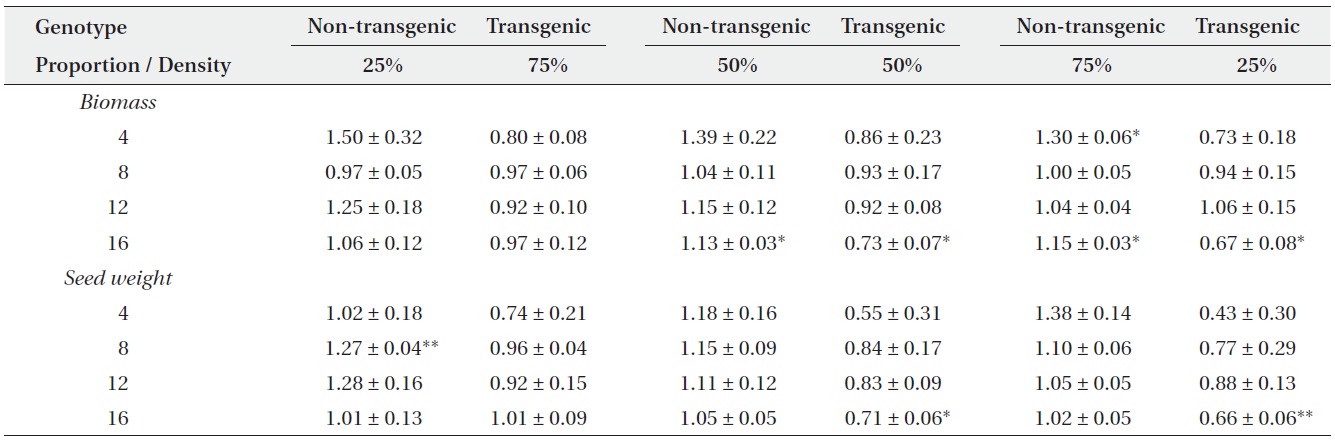
Mean relative yields (± SE) for non-transgenic and transgenic plants grown in mixtures of three genotype proportions (25, 50, or 75%) over four densities (4, 8, 12, or 16 plants/pot). Two-tailed t-tests were used to compare each relative yield with a value of ‘1’ (*P < 0.05, **P < 0.01).
consistent with our results that RY values for non-transgenic plants were significantly greater than 1, while those of the transgenic plants were significantly smaller than 1 (Table 3). Thus, the non-transgenic plants were more competitive than transgenic plants, but only at certain combinations of planting proportion and density.
Although our results indicated no actual differences in performance between transgenic and non-transgenic plants in monocultures, transgenic plants outperformed non-transgenic plants when the two types were grown in mixtures. Moreover, the analysis of relative yield suggested that transgenic plants were competitively inferior to non-transgenics in terms of biomass and seed production at certain planting densities. Previous studies found no significant differences in the competitive ability between transgenic and non-transgenic plants in environmental conditions that do not provide benefits of having transgenes (Fredshavn et al. 1995, Fredshavn and Poulsen 1996, Ramachandran et al. 2000). In contrast, transgenic plants were competitively superior to non-transgenic plants under conditions that provide selection pressure for transgenes (Ramachandran et al. 2000). These studies indicate that the benefit of a resistance trait may not incur costs with regard to competitive ability. However, our results suggest that transgenic herbicide resistance incur a significant loss in competitive ability.
With this in mind, our results cannot be generalized to other plants engineered to be herbicide-resistant because fitness cost is not the property of a particular resistance trait (Chapman and Burke 2006). Even when the same type of resistance is applied to a certain species, the fitness cost will be evident for some transgenes but not for others (Jackson et al. 2004). This holds true for our study system. Although we did not detect any performance cost of monocultured transgenic plants when compared to non-transgenic plants, a previous study reported reduced yield of a transgenic rice line transformed with a PPO gene that is different with ours (Jung et al. 2010). Therefore, such a cost must be studied case-by-case for a given trait, species, and transgene. This may partly explain why some studies have found that transgenic benefits occur without costs (Hilder and Gatehouse 1991, McHughen and Holm 1991, Bartsch et al. 1996, Snow et al. 1999, 2003, Burke and Rieseberg 2003, Di et al. 2009).
Although we tested transgene costs in greenhouse conditions, our study must be extended to examine the variation in fitness costs under agronomic field conditions over multiple growth seasons. Because the costs associated with a transgene can disappear under conditions that create selection pressure for transgenes (Jackson et al. 2004, Vacher et al. 2004, Chen et al. 2006, Damgaard and Kjær 2009), field experiments with different levels of selection pressure will allow us to understand how much selection pressures are needed to allow transgenic plants to shift from “costly” state to “beneficial” state. On the other hand, the degree of fitness cost may be mitigated or aggravated depending on other biotic and abiotic factors, such as light and temperature (Plowman and Richards 1997), nutrients (Purrington and Bergelson 1997, Cipollini 2010), or herbivores/pathogens (Gassmann and Futuyma 2005, Sasu et al. 2009).
Several explanations are possible for the decline in performance and competitive ability by transgenic crops. First, the continuous expression of a herbicide-resistance gene may cause the allocation of resources to be reduced toward growth processes (physiological cost; Regal 1988). One approach for testing this would be to include multiple transgenic lines that are homozygous and hemizygous for transgenes to determine if the fitness cost of transgene- homozygotes is greater than hemizygotes. Second, the transgene controlling for the expression of defensive traits may have negative pleiotrophic effects on fitnessrelated genes (Dale and McPartlan 1992, Bergelson et al. 1996). Third, the expression of a selection marker gene (here,
There is biotechnological concern regarding the diminished commercial value of transgenic crops because severe fitness costs may entail retarded growth or fruit production. To overcome this problem, transgenic technologies have advanced to employ inducible promoters rather than constitutive promoters (Kasuga et al. 1999, Gurr and Rushton 2005). The former allow for low expression of a resistance gene in the absence of selection pressure while causing that gene to be more readily expressed when plants are exposed to selective agents. Because inducible resistance decreases the physiological load on fitness, this approach may be useful for developing transgenic crops that exhibit efficient resistance without incurring a penalty to their fitness (Cipollini 2010).
There is a general concern that transgenic plants escaped from an agricultural system may persist in natural habitats and spread transgenes to wild or weedy relatives. Hybrids between transgenic plants and their wild relatives may also incur additional costs associated with interspecific hybridization (Halfhill et al. 2005, Warwick 2007). However, such hybrids may persist in nature even in the absence of long-term selection pressure (Warwick et al. 2008), and may promote the evolution of invasive weeds, subsequently posing unwanted environmental and ecological challenges (Ellstrand et al. 1999, Ellstrand 2003, Warwick et al. 2009). Therefore, although we found here that transgenic, herbicide-resistant rice had a fitness cost in the absence of herbicide applications, additional research is needed to monitor carefully the possibility of transgene release and its ecological consequences.