Activated carbons (ACS) are a processed material with a highly developed porous structure, high surface area, large total pore volume, and wide pore volume distribution. They consist of carbon (87-97%), but also contain such elements as hydrogen, oxygen, sulpher, and nitrogen as well as various compounds either originating from the raw material or generated during its manufacture. ACs have the ability to adsorb various substances both from the gas and liquid phases [1,2]. ACs are produced from a solid carbonaceous material that is rich in carbon, but low in inorganic content. The First World War was the starting point of ACs production at a large scale, and in the second half of the last century, production of ACs increased due to stricter regulations regarding water resources, clean gas, and recovery of valued chemicals [3]. ACs are produced from coal, petroleum coke, and other carbonaceous materials such as wood, coconut shells, and fruit stones. Recently, ACs have been produced from agricultural wastes to reduce their manufacturing costs; these agricultural wastes are highly available and renewable. Cotton is one of the most important crops in Egypt and about four million tons of cotton stalks are available annually with no economical use, particularly as their use as a fuel in the countryside has waned.
ACs are developed either by chemical or physical activation. In the former, the processed precursors are impregnated in an aqueous solution of an activating agent such as zinc chloride or phosphoric acid, followed by carbonization in limited air or in a nitrogen atmosphere at 500-600℃. Physical activation, on the other hand, is obtained first by carbonization at 600℃ followed by gasification with an oxidizing gas at 900-1100℃ to a certain percentage of burn-off, usually ranging between 20 and 80% according to the required pore structure. For physical activation, steam-activation is the most frequently used method [4].
With rising population, industrial and urban transformation in the last two centuries has led to a considerable demand for ACs, particularly for air purification, as well as water and soil treatment. Various techniques have been used to remove organic and inorganic pollutants from air and water. The techniques available can be divided into three main categories: physical, chemical, and biological. Traditionally, biological treatment, adsorption, reverse osmosis, ion exchange, catalytic oxidation, and solvent extraction are the most widely used approaches; among these methods, the adsorption technique has proven to be the most efficient, economical, and feasible. Also, among the different adsorbents used, ACs have exhibited the highest efficiency as well as ease of regeneration [5,6].
In the present investigation seven-steam ACs with different burn-off ranging between 10-66% were developed from cotton stalks. The textural properties were determined by nitrogen adsorption at -196℃. The chemistry of the carbons was determined using the surface pH of the carbon, pHpzc, FTIR, and Boehm's acid- base neutralization [7]. The textural properties and the chemistry of the surface were different but are related to the % burn-off. This allowed the development of a theoretical model considering the percentage burn-off as an independent factor and the textural parameters, surface acidity, and/or basicity as dependent variables. The suggested model can be used to suggest properties of the ACs sample; accordingly, when an AC of certain properties is required for a certain application, % burn-off can be considered to help to save material, time, and cost.
2.1. Preparation of steam-AC samples
A carbonization product C was first obtained by carbonization of pure, dried, and crushed cotton stalks in the absence of air at 600℃. Seven samples of steam-ACs were obtained from the carbonization product C sample by gasification at 900℃ with steam. The time was appropriately adjusted to obtain 10, 16, 22, 35, 55, 60, and 66% burn-off. These samples were designated CS10, CS16, CS22, CS35, CS55, CS60, and CS66.
The textural properties (surface area, total pore volume, and mean pore radius) were determined from nitrogen adsorption at -196℃ using a conventional type volumetric apparatus. Prior to adsorption, the sample was degassed at 200℃ for 8 h under reduced pressure of 10-4 torr.
The ash content of carbon C and the steam-activated samples was determined by burning a known weight of a sample in a crucible at 600℃ until a constant weight is attained.
The pH values of the supernatant were obtained by soaking 0.5 gm of carbon in 25 mL of CO2-free distilled water and shaking for 48 h. The pH of the supernatant water was then determined using an Orion pH meter. The determination of the pHpzc of the samples was carried out by the procedure described in Youssef et al. [8]. Initially, 50 mL of 0.01 M NaCl solution was put into several closed Erlenmeyer flasks. The pH within each flask was adjusted to a value between 2 and 12 by adding HCl 0.1 M or NaOH 0.1 M solutions. Aportion of the sample (0.15 gm) was then added to each flask, and the flasks were agitated for 48 h and the final pH was then measured. The pHpzc is defined by the point where the curve pHfinal vs. pHinitial crosses the line pHfinal = pHinitial. The procedure was repeated for all the activated samples. Blank tests without carbon were also conducted in order to eliminate the influence of CO2 from air on the pH.
Base neutralization capacities (meq./g) were calculated by the adsorption of NaOH, Na2CO3, and NaHCO3 by shaking 0.2 gm of sample with 50 mL of 0.2 N base solution in a Pyrex glass bottle for 48 h and titrating an aliquot of the clear supernatant liquid against 0.1 N hydrochloric acid.
The functional carbon-oxygen groups on the carbon surface were identified by using a Fourier transform infrared (FTIR) technique, where FTIR spectra were recorded by a Mattson 5000FTIR spectrometer.
3.1. Textural characterization of carbons
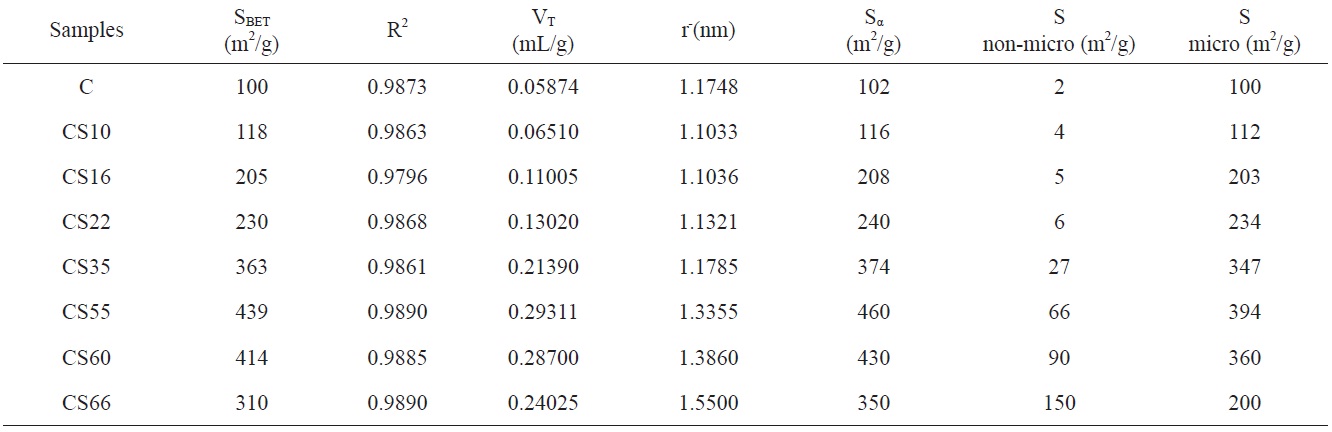
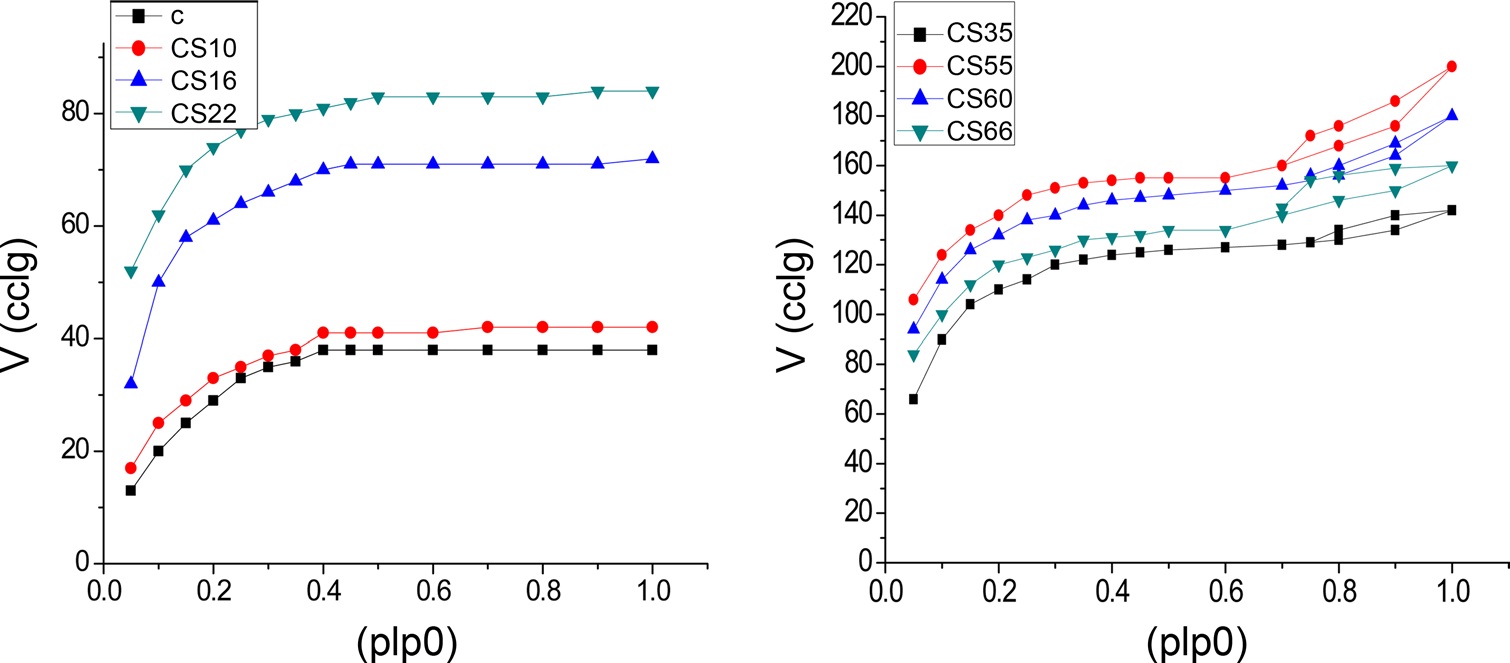
N2 adsorption isotherms of ACs at -196℃ was investigated. Fig. 1 were used to determine the surface area and porous structure using the Brunauer-Emmett-Teller (BET) method and αs method. For all carbon preparations, the adsorption isotherms are either type I or a mixture of type I and type IV according to the classification of Sing et al. [9]. It is evident from Fig. 1 that CS35, CS55, CS60, and CS66 exhibited closed hysteresis loops, which may be related to pore widening, which can be ascribed to the increase of burn-off [10]. The linear BET plots of nitrogen adsorption at -196℃ for the samples give straight lines with more or less all the points in a relative pressure range of 0.05-0.35. The BET surface areas SBET are given in column 2 of Table 1. The nitrogen adsorption isotherms for non-AC “C” and for steam-ACs of low % burn-off ≤22% (i.e., CS10, CS16, and CS22); the nitrogen adsorption isotherms are parabolic in shape. In other words, they show a typical type I characteristic of physical adsorption in microporous materials. Also for C, CS10, CS16, and CS22, the adsorption of nitrogen is reversible (i.e., the desorption points lie on the same adsorption isotherms). For steam-ACs with higher % burn-off (CS35, CS55, CS60, and CS66), the isotherms are type I in their initial stages but show some characteristics of type IV. Moreover, steam-ACs CS35, CS55, CS60, and CS66 exhibit hysteresis loops due to the existence of relatively wider pores.
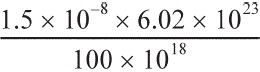
The total pore volume VT (the volume of liquid nitrogen expressed in mL/g), at a relative pressure approaching unity, for example, at p/po = 0.95, could be calculated by multiplying the volume of nitrogen gas (cm3/g) at p/po = 0.95 by a factor of 15.5 × 10⁻⁴. The total pore volumes of the investigated carbons are given in column 4 of Table 1. Assuming a cylindrical pore radius, r-(the average pore radius) in nanometers can also be calculated from the following equation:

Adsorption parameters as calculated by BET and α-methods for the investigated carbon samples via nitrogen adsorption at -196℃
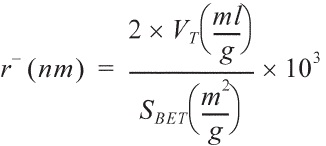
The average pore radii of the investigated carbons are given in Table 1. Table 1 reveals that the following: 1) SBET of the non-AC was measured to be 100 m2/g, which means that all the pores are accessible to nitrogen molecules at -196℃, and the average pore radius
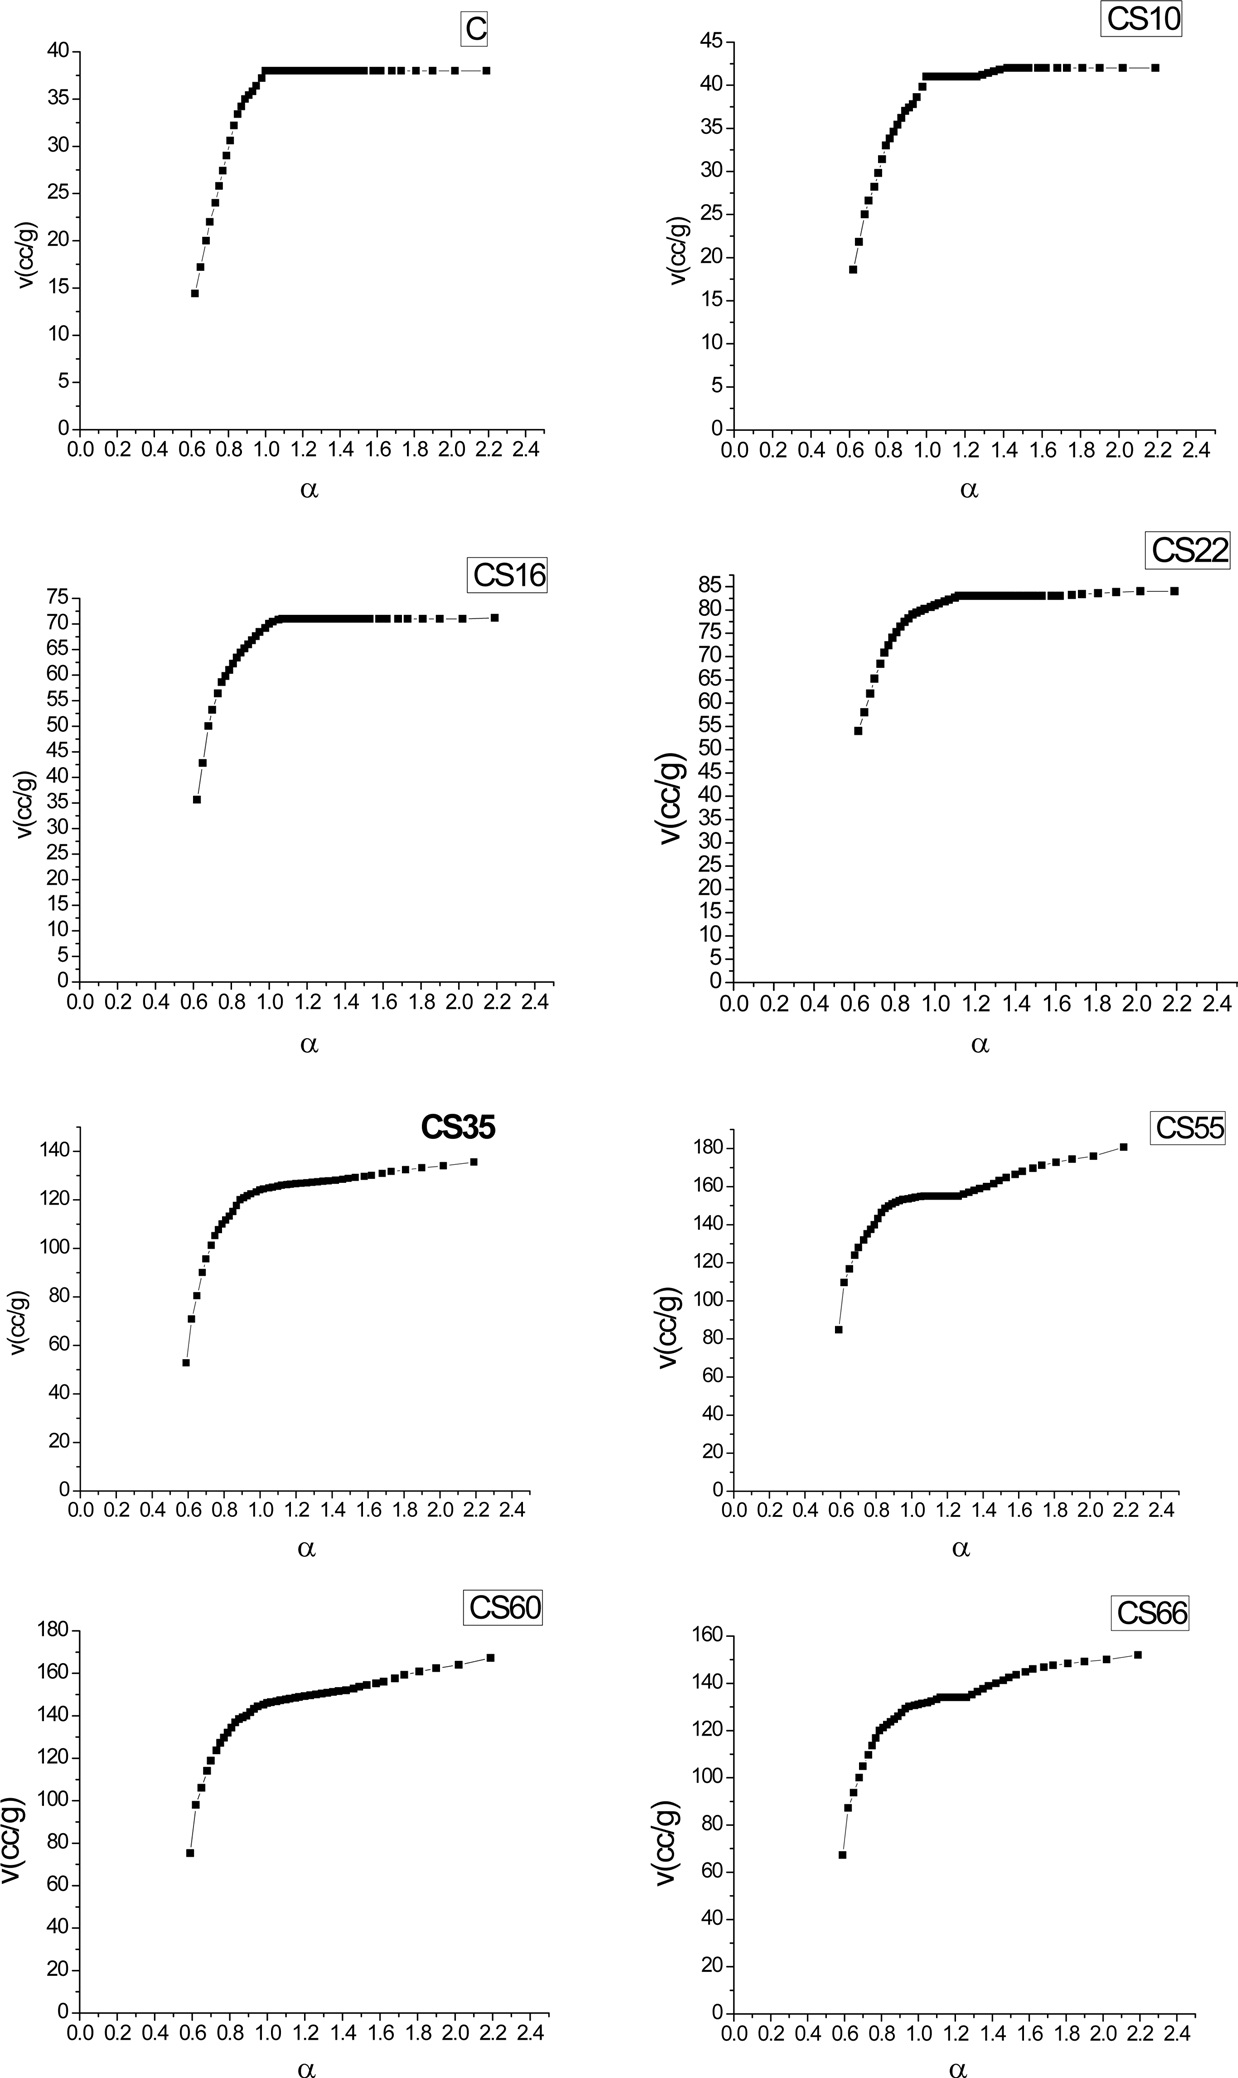
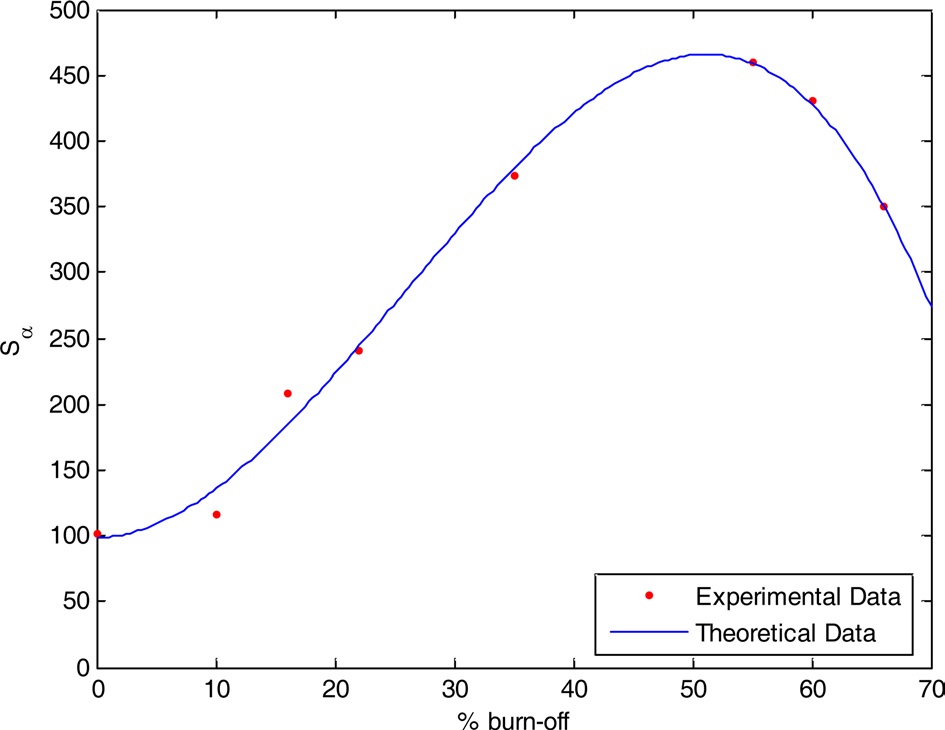
Fig. 2 shows αs- plots for the non-activated and steam ACs. There are some features that could be considered: 1) extrapolation to the origin of coordinates in the αs- plots cannot be done for all carbons unless some low relative pressure points are neglected. The curved nature of the αs-plot in the low relative pressure region [11,12] makes extrapolation to the origin very difficult. This could arise from slandered reference material or to the existence of narrow microporosity in the AC. 2) For αs > 1.0, a straight line represents the adsorption points; this straight line does not pass to the origin but intersects Vα and its slope can be used to calculate the surface area located in non-micro porosity, (Snon-micro). The slope of the straight line passing to the origin is meanwhile used to determine the total surface area, Sα [13]. The total surface area is determined by the αs method, and Smicro and Snon-micro are given in Table 1. Sα(m2/g) shows an increase <4% for all samples except CS66 with a 12.9% increase in surface area compared with SBET. This can be explained on the basis that the αs-method considers a reference material (non-porous carbon) as a standard isotherm. On the other hand, the BET method has received serious criticism, particularly when the location of a knee on the isotherm is problematic or when the isotherm shows a rounded inflection. Rounded inflections are expected for solids with a majority of mesoporosity, which is not the present case. On this basis one may consider that the BET and αs-method are complementary methods for the determination of precise and accurate surface areas; non-microporosity accounts for a considerable fraction of the total surface and continues to increase with an increase of the percentage of burn-off. Thus, Snon-micro contributes to the total surface of CS10 by about 2% while for CS66 the Snon-micro of the surface area
is measured to be about 43%; this indicates that further steam activation at 900℃ leads to pore widening at higher burn-off.
The last data in Table 1 are consistent with the mechanism of steam activation: first, clean, dried, and crushed cotton stalks were carbonized at 600℃ in limited air. During carbonization, some carbon atoms are deposited in the micropores, leaving these pores partially occupied with less oriented carbon atoms. The less oriented carbons lead to a carbonization product with low surface area and a developed porous structure. Gasification with oxidized gas (steam) at 900℃ is associated with a loss of the carbon content; the loss starts with the less oriented atoms, which are the most active component. After the complete burning of these activated components, more time is needed for further gasification at 900℃ with steam. This brought about further loss of well oriented carbon atoms, leading to erosion of narrow pores, i.e pore widening, which continued with further gasification with steam. At a high percentage of burn-off, the total pore volume increases and the pore size distribution become wider. This process leads to a decrease in surface area. However, at a burn-off ≥55%, the rate of increase of the total pore volume decelerated. and the surface area may start to decrease.
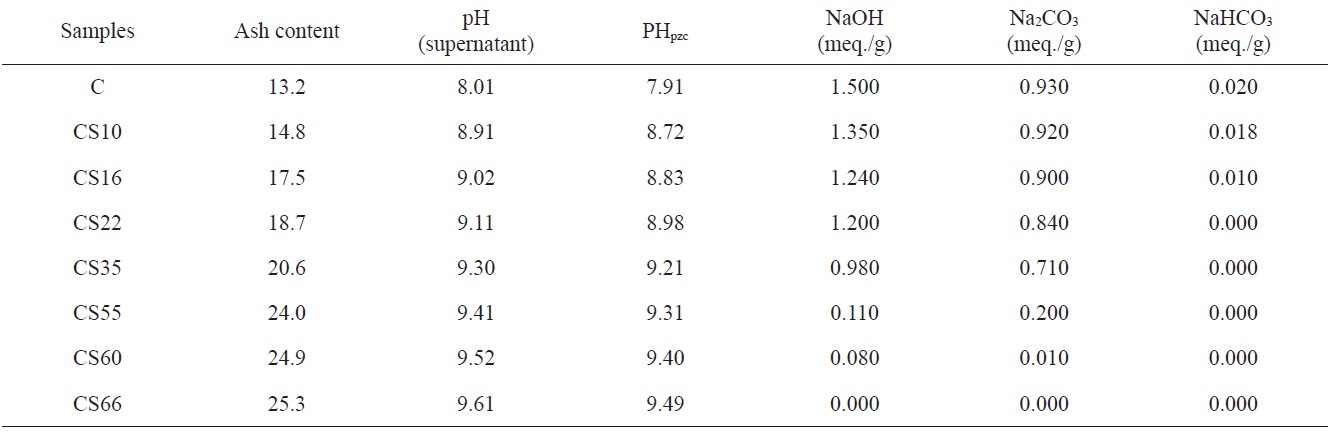
Ash content, pH of aqueous supernatant, pHpzc, and base adsorption capacities of the investigated carbon samples
3.2. Ash content, pH of supernatant, pHpzc, and base neutralization capacities
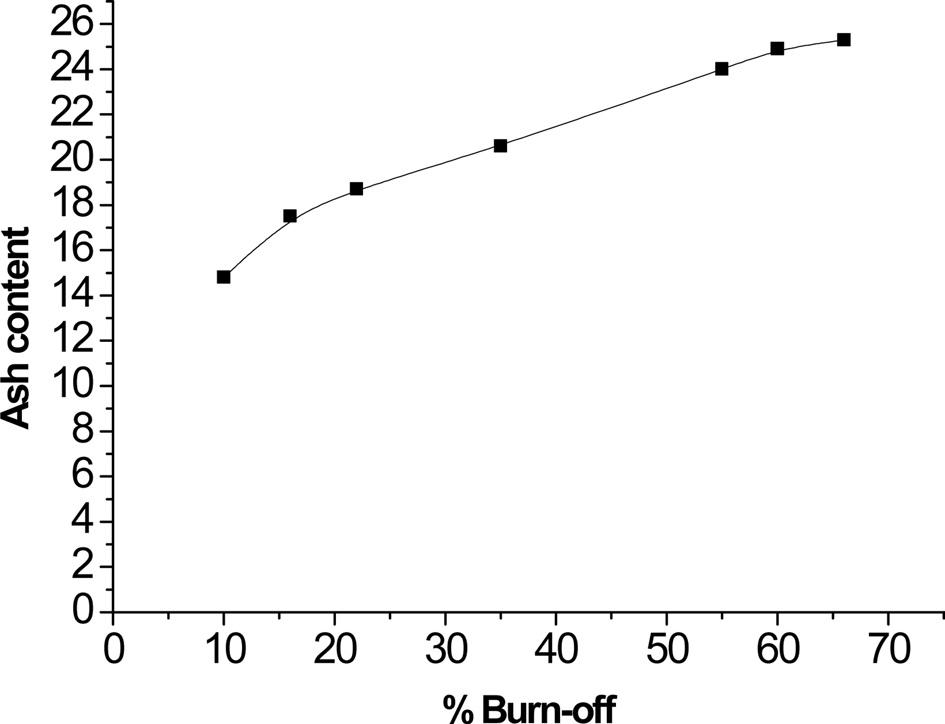
Table 2 lists the estimated ash content, pH values of aqueous suspended carbons, pH values of points of zero charge, and base neutralization capacities. Table 2 reveals that: 1) ash content of steam-ACs is higher than that of non-AC, and increases with an increase of % burn-off. This is not surprising because an increase in % burn-off is associated with a decrease in the carbon content and consequently an increase in ash content. Fig. 3 shows the linear relation between % burn-off and ash content, indicating that when the previously carbonized sample “C” is gasified with an oxidizing gas such as steam, the loss of carbon is associated with an appreciable increase in the inorganic content. 2) The pH of the aqueous supernatant of carbons ranged from 8.01 to 9.61; i.e. the pH increased with an increase in % of burn-off. This indicates a basic surface of carbon C and all CS samples, thus agreeing with the determined pH at the point of zero charge, which ranged from 7.91 to 9.49. As expected, the total surface basicity of the steam activated samples is higher than that of the carbonized sample and the surface basicity increased further with an increase in % burn-off, where the hydrogen ion concentration in the acid solution decreased after the solid carbon samples were
contacted with steam. 3) Non-ACs exhibit neutralization capacities of 1.500 meq./g for NaOH, 0.930 meq./g for Na2CO3, and 0.020 meq./g NaHCO3, indicating that the total number of acid sites =
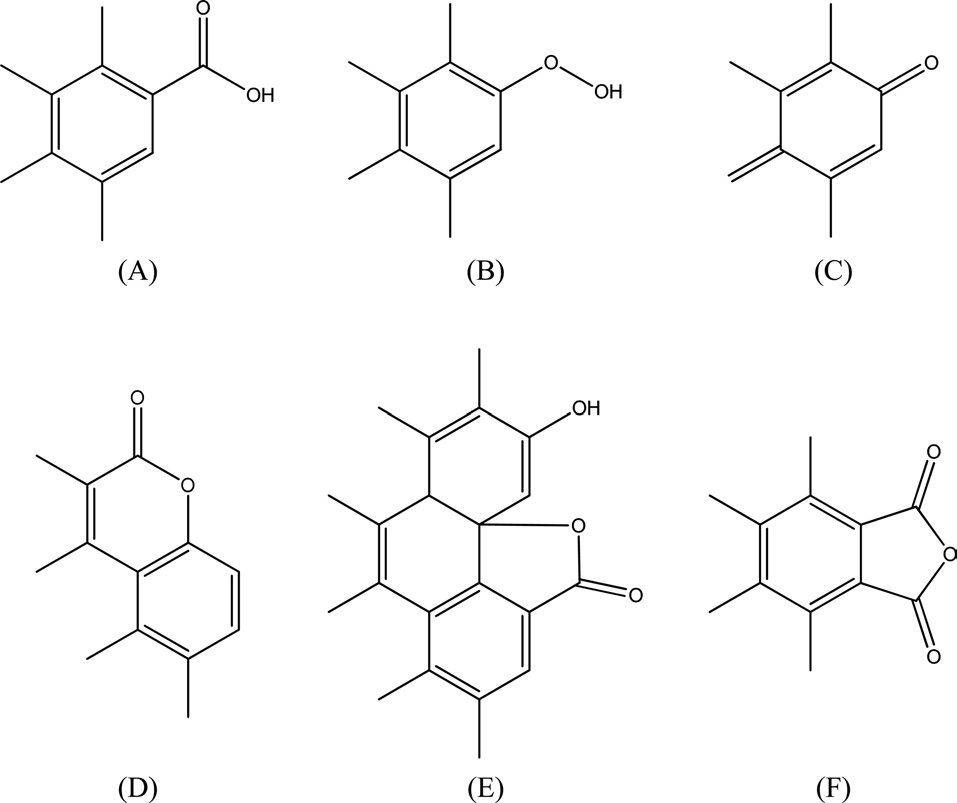
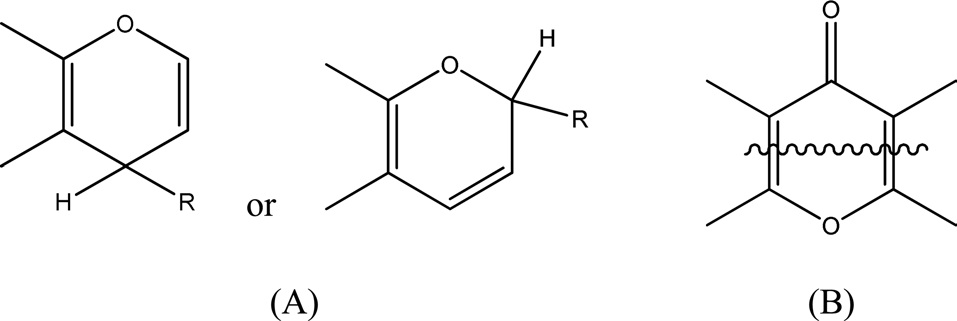
= 9 Nacid/nm2. This predicts that only a fraction of the surface is occupied by carbon?oxygen groups regardless of whether they are acidic, basic or both. Steam-ACs are less acidic than non-AC. Moreover, the surface acidity decreased with increasing extent of activation with steam, i.e., with % burn-off, where the number of acid sites for CS10 ? 7 Nacid/nm2 and for CS66 ? 1 Nacid/nm2. 4) Carboxylic groups are not observed on the surface of steam-ACs. Thus only lactones and phenols exist. Generally, oxygen surface compounds are usually divided into two main types: functional groups of acidic nature (undergoing neutralization by bases) and basic groups, which may be neutralized by acids. The acidic groups are exemplified schematically in Fig. 4. The basic groups are much less well-characterized compared with the acidic groups [14]. Usually structures corresponding to chromene or pyrone-like structures, illustrated in Fig. 5, are attributed to them. It should be noted that the basic properties of particular sites of the active carbon surface are not necessarily associated with the presence of oxygen [15].
Infrared spectroscopy is one of the most frequently used instrumental analysis methods to characterize the surface functionalities in ACs [16]. FTIR spectroscopy has found wide application in the qualitative analysis of carbon materials. One of the major sample handling problems in FTIR analysis of carbon materials is that many of them are effective black body absorbers; they are too opaque for direct transmission analysis in the mid-infrared spectral region. Traditionally, the carbon materials are diluted with an appropriate transparent medium to allow sufficient signal intensity (typical KBr) to obtain transmission infrared spectra. This approach, however, is not entirely satisfactory. It is time consuming and grinding conditions and moisture are known to affect the spectrum of
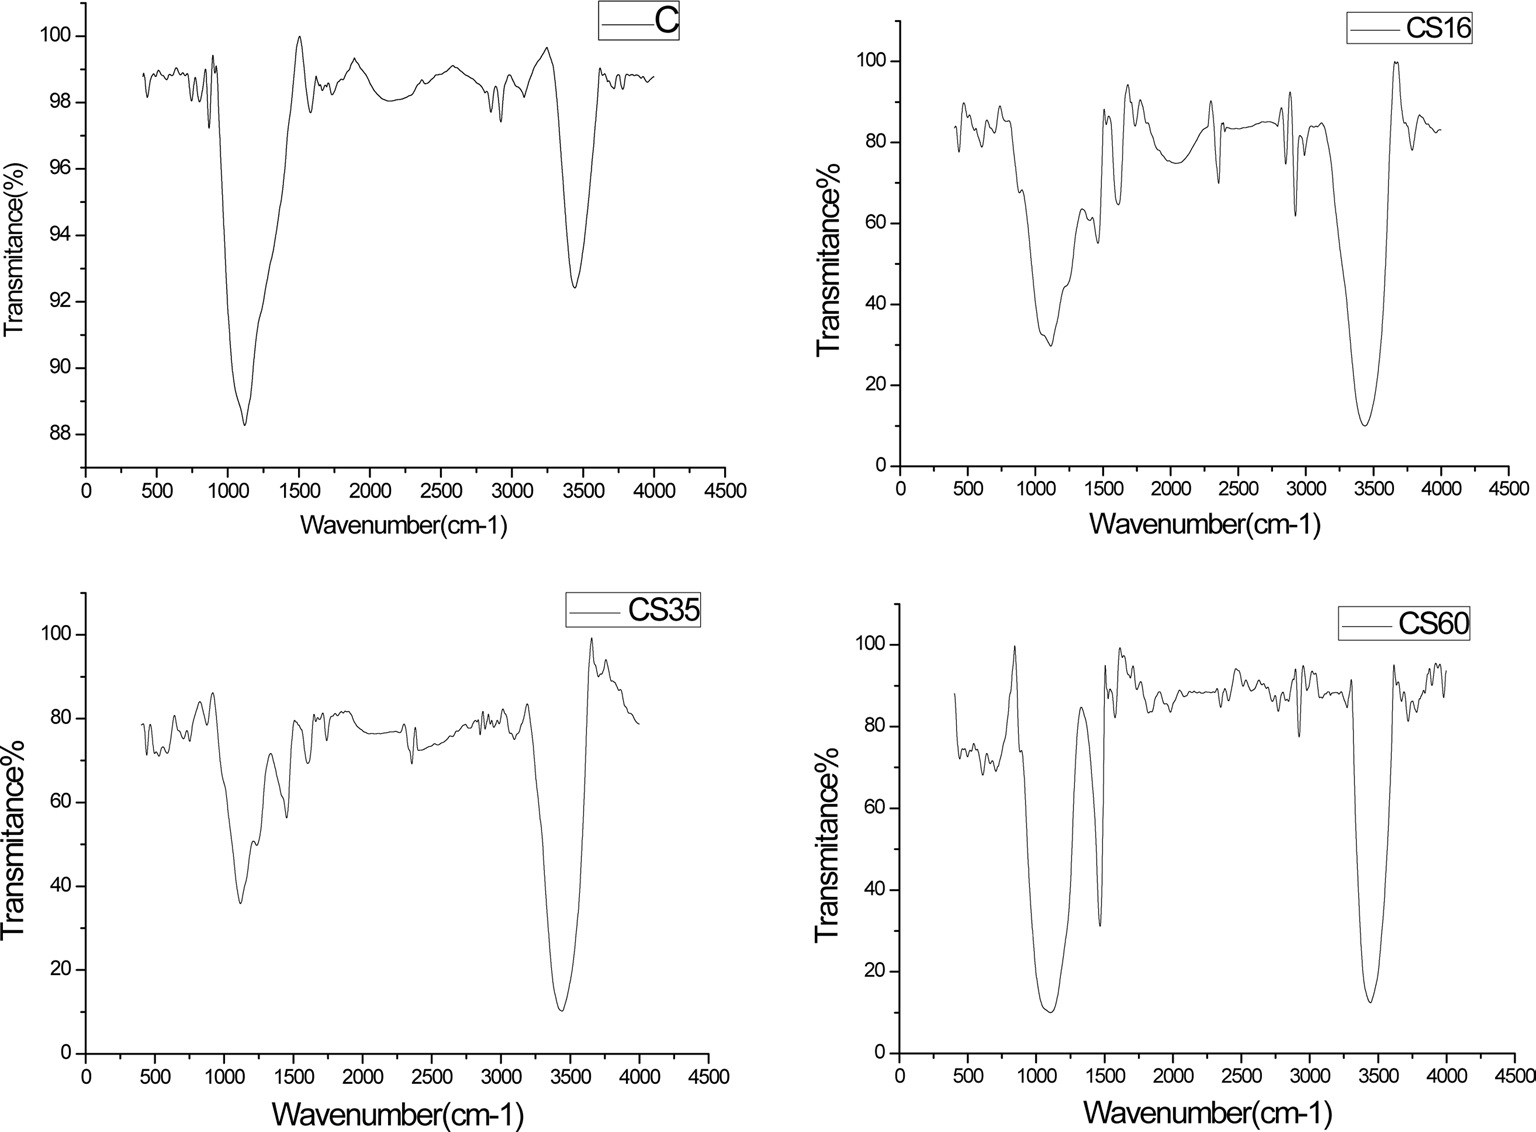
the sample. Those factors are difficult to control during the pellet preparation [17]. Fig. 6 shows FTIR spectra of nonactivated, CS16, CS35, and CS60 as selected samples. Depending on the % of burn-off, various functional groups are represented in the FTIR spectra.
From Fig. 6, one can identify that the broad bands at 3429-3443 cm-1 are attributed to O-H axial deformation of hydroxyl functional groups, including hydrogen bonds with decreased transmittance with an increase in % burn-off: about 92% transmittance for the non-activated sample and 10% transmittance for CS16. The band at ~2900 cm-1 is ascribed to C-H axial deformation [18] and the band with its maximum located at 1770 cm-1 is attributed to lactones. The band near 1600 cm-1 is due to C=C stretching vibration in the aromatic ring and is observed for all samples with a very small shift; bands in the region 1000-1300 cm-1 can be attributed to various C-O bands such as those in ethers, phenols, and esters [19]. The bands in the region 850-440 cm -1 are ascribed to alkene vibrations.
Experimental data show that the chemical and textural properties of steam ACs are related to the % burn-off, where any small change in % burn-off leads to a change in the specific surface area, pore radius, total pore volume, and surface functions groups. The degree of changes did not follow the same trend for all variables, and thus theoretical trials were conducted to choose the suitable % burn-off for required steam AC properties considering % burn-off as an independent factor and all the other properties as dependent factors.
3.4.1. Ash content and % burn-off model
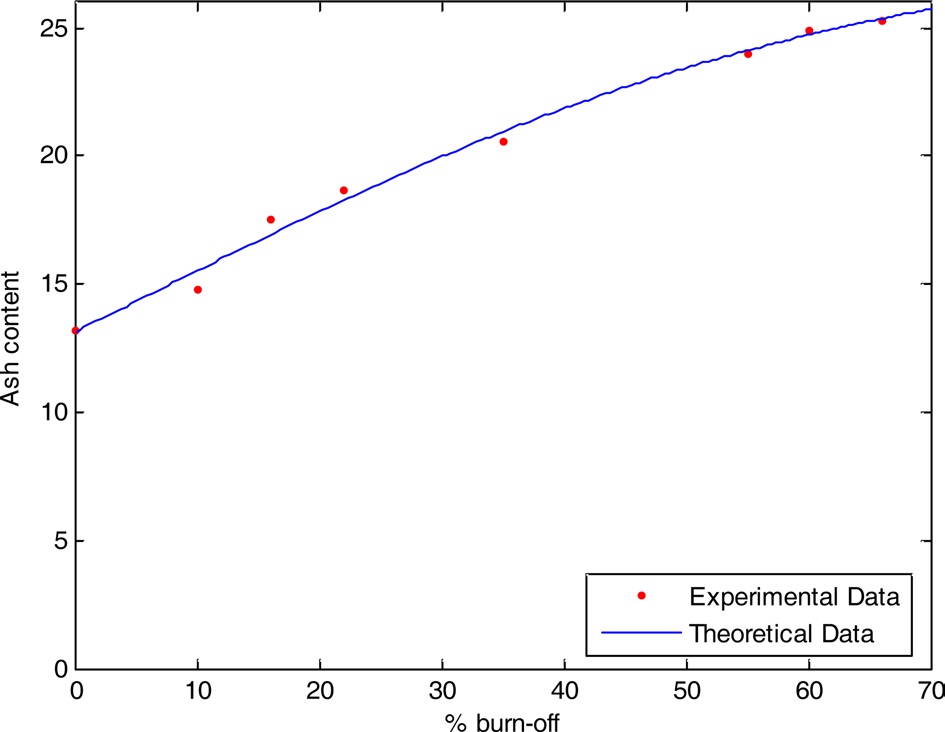
Taking ash content to be a dependent factor and % burn-off as an independent factor, one can evaluate a relation between them. Given that y1 is the ash content of the steam-activated sample and x is the %burn-off, the following relation between them can be derived:
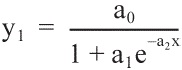
where a0, a1, and a2 are constants:
a0 = 28.7498,
a1 = 1.1876,
a2 = 0.0331
From Fig. 7 we observe a very small difference between the experimental and theoretical values.
3.4.2. Effect of % burn-off on specific surface area
The relation between specific surface area and % burn-off is not a linear relation due to the pore widening process. The specific surface area is also a very important property for AC. It would then be interesting to prepare a steam-activated sample with a certain specific surface area by a definite % burn-off. Given that y2 is the specific surface area and x is the % burn-off, we obtain the following equation:

where:
b0 = 34.225012674,
b1 = 9.8646993071,
b2 = -0.120046331,
b3 = -0.005536899,
b4 = -3.343934e-6,
b5 = 33.
From Fig. 8 we observe a small difference between the theoretical and experimental values.
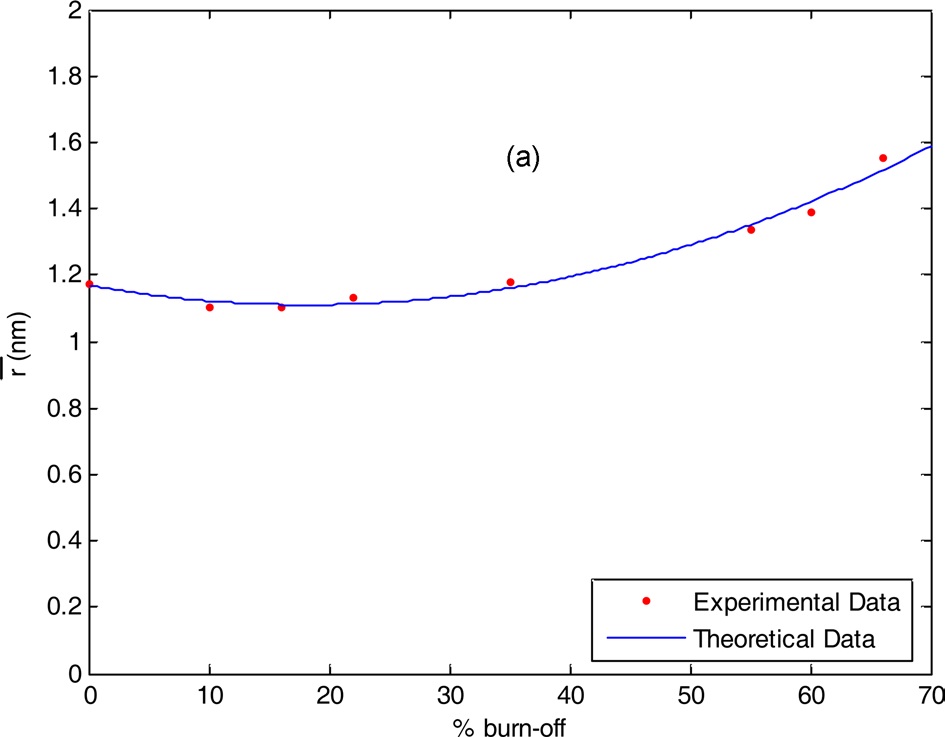
3.4.3. Relation between pore radius and % burn-off
Pore radius is an essential factor for solid adsorbents and measures the suitability of pores in relation to the molecular size
of the adsorbate. If y3 is the pore radius and x is the % burn-off, then the following relation between them can be derived:
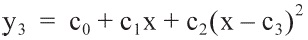
where C0, C1, and C3 are constants:
c0 = 1.1673915419,
c1 = -0.005401976,
c2 = 0.0001778177,
c3 = 3.
Steam-ACs prepared from cotton stalks in a range of burnoff of 10-66% showed textural properties and chemical surface properties that depend mainly on the % of burn-off. At the early stages of activation with steam at 900℃ micropores were formed with increasing surface area until about 55% burn-off. Further activation with steam led to pore widening associated with a decrease in surface area and an increase in the average pore radius. The total pore volume increased for AC to burn-off ≤55%; further activation with steam to burn-off >55% showed a decrease in the total pore volume, which is related to pore widening. Surface chemistry of the activated samples is slightly basic and involves C-O functional groups that are either acidic or basic, or both. The suggested mathematical model can perhaps help save material, energy, time, and cost.