In the fairy tale of “Snow White,” the evil queen asks the magic mirror the following question: “Mirror, mirror, on the wall, who is the fairest of them all?” From a research perspective, this is a loaded question that invites consideration of a range of issues on quality assessment. How do we assess beauty? Is it quantifiable? Is there an objective standard for beauty? After all, isn’t beauty in the eye of the beholder? Research assessment, being ultimately an exercise in quality assessment, shares much in common with assessment of beauty, although one may argue that research is much more tangible than beauty and therefore easier to quantify.
When we evaluate a researcher, however, we often assess the person for his or her research potential rather than simply basing our judgments on the one-dimensional examination of existing research outcome. The determination of research potential encompasses consideration of three key aspects: capability, experience, and impact. The main component of research capability is the researcher’s knowledge and skill set, which is accrued initially by education and then by experience. Although its impact is secondary, the computational, organizational, and operational support infrastructure of the organization the researcher is affiliated with also influences research potential. The third component of research capability is networking ability, which grows in importance as collaboration becomes the norm rather than the exception in a modern day research environment. Research experience, with the typical lifecycle of grant proposal, project management, and publication, is directly related to research capability in that it is the natural outcome of research capability.
Research impact, on the other hand, is not necessarily proportional to research capability and experience. For instance, a capable researcher with plenty of experience may not have as much impact as a young researcher on the trail of a hot topic. If the research experience is the quantitative outcome of research capability, the research impact is the consequence of research quality and significance. Just as research capability and experience reinforce each other, research impact and experience feed off one another. The impact of a researcher, demonstrated by citations to and extension of his or her work in related studies, helps the researcher to obtain funding, which fuels his or her research productivity and thus increases the impact potential.
Among the three aspects of research potential, experience and impact are more readily measurable than capability since they are tangible outcomes of research activity as opposed to qualitative conditions for producing those outcomes. In fact, research experience and impact are components of research performance, which is typically the main target of assessment in bibliometric analysis. The bibliometric approach to research assessment, however, does not adequately capture all the facets of research performance. In bibliometric analysis, research quantity, i.e., how much research has been done, is usually measured in terms of the number of publications the research generates, and impact, i.e., how significant the research contribution is, is approximated by the number of citations to the publications that the research produces. To properly assess the quality of research, however, one must look at not only the count of citations but also the sources and contexts of citations so that the true impact of research that each citation implies can be ascertained.
1.1. Research Assessment Metrics
There are several research assessment metrics which are often used in bibliometric analysis. Citation count, i.e., the number of citations to a publication, is a document-level measure used to approximate the impact or importance of a paper, whereas publication count, i.e., the number of publications, is an author-level measure that represents an author’s research productivity. Another authorlevel measure that takes into consideration both the impact and productivity of a researcher is
[Table 1.] Example: h-index vs. g-index
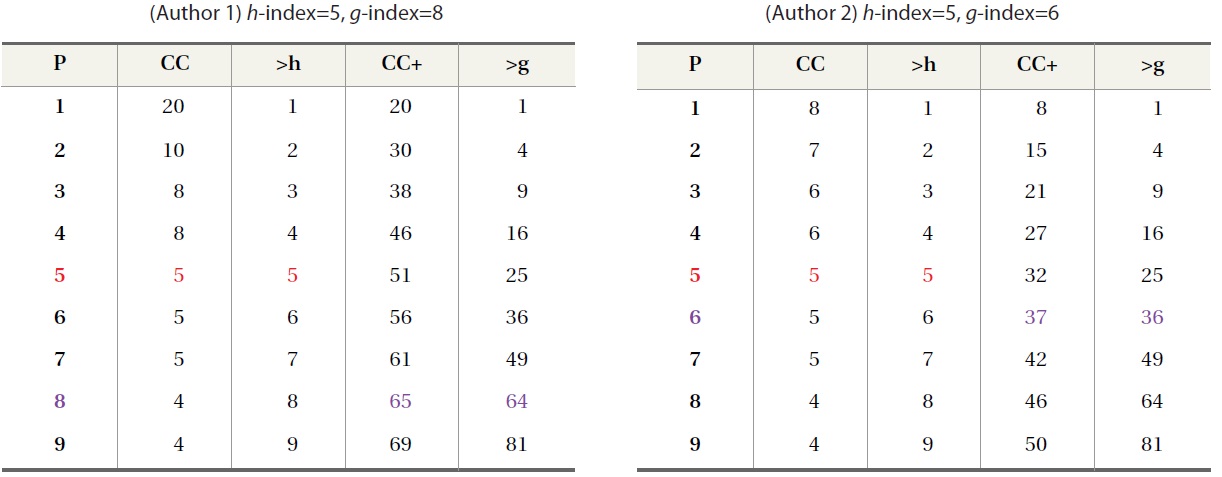
Example: h-index vs. g-index
Another way to assess the quality of publications other than citation count is to consider the venue of publication. A paper published in a high impact journal can be regarded to be of higher quality than a paper published in a low impact journal. The popular metric for assessing the impact of a journal is given by the impact factor, which is computed by dividing the number of citations in a given year to papers published in a journal during the prior two years by the number of publications in those years (Equation 1). Impact factor, being the average number of citations to a paper for a journal, suffers from the same weakness as the citation counts which estimate the impact of a publication in that they treat all citations to be of equal importance, which can be a gross oversight in reality.
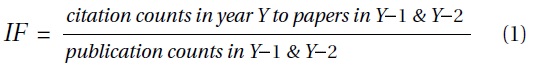
papers that cites
1.2. Challenges for Research Assessment
Like the assessment of beauty, research assessment is an inherently subjective task that strives for objective standards by means of commonality. The input, outcome, and methods for research assessment depend on who is evaluating whom for what purpose and in what context. At the same time, research assessment should be a consistent and methodological process that produces a valid and robust outcome. Consequently the first issue in research assessment is whether to take a qualitative approach, in which subjective criteria suitable for the purpose and context of assessment can be applied to evaluate research performance in a comprehensive manner, or to take the quantitative approach that employs standard evaluation metrics to generate comparable assessment outcomes.
The qualitative approach has the advantages of human judgment, flexibility, and customization, but is a resource-intensive process with a lack of standardized criteria and methodology that can lead to inconsistent or biased results. The quantitative approach is a fairly standardized process which can be applied to evaluate and compare a large amount of data in an efficient manner. However, the evaluative outcome, which is based on only those facets of research performance that are readily quantifiable, is neither as holistic nor personalized as that arrived at by the qualitative approach. Furthermore, the quantitative approach typically does not adequately take into consideration the differences among base units of evaluation (e.g., citations, publications), thus sacrificing the accuracy of assessment for the sake of simplification. On top of these challenges, properly assessing the contribution of each author for a collaborative work is a troublesome undertaking. Estimating author contributions by the order of authorship (i.e. author rank) in a multi-author paper is guess work at best and does not always correspond to the true contributions that authors put forth to the publication in question.
In addition to the challenges inherent in assessment approaches are the sources of evaluation data, especially for the quantitative approach. The publication and citation data that feed into research performance assessment are collected from citation databases such as Web of Science, but citation databases suffer from lack of comprehensive coverage and standard data inclusion criteria that can lead to inconsistent outcomes (Meho & Yang, 2007; Yang et al., 2012). Moreover, citation databases are not yet very user-friendly for research assessment tasks that require more than raw publication and citation counts.
Faced with these challenges for research assessment, meaningful and consistent analysis of bibliometric data is no trivial task. Until the coverage, quality, and usability of citation databases are significantly enhanced, we must keep in mind that bibliometric indicators are only as reliable as their data sources and methods employed to produce them. Although the approach to citation database enhancement is one of the core issues in our project (Yang & Meho, 2011), we focused on examining bibliometric measures for research assessment in the current study. Specifically, we investigated how robust different bibliometric indicators are in assessing research performance.
In order to test the reliability and stability of bibliometric indicators (BI) for research assessment, we compared the rankings of faculty members by various BI scores, such as publication count, citation count, and
1.3.1. Study Data
For the study data, we used the publication and citation data of 159 tenure-track faculty members of Library and Information Science (LIS) departments in 34 Korean universities (Yang & Lee, 2012). The study data included 2402 peer-reviewed papers published between 2001 and 2010, 2232 of which were Korean journal papers, 111 international journal papers, and 59 international conference papers. We collected 2811 citations to 871 papers (1531 papers had no citations), 1452 of which were citations to Korean journal papers, 1116 were to 93 international journals, and 243 citations were to 38 international conference proceedings.
We initially compiled the publication list of 146 faculty members from the National Research Foundation’s (NRF) Korean Researcher Information (KRI) system, which was supplemented by 4 author-supplied publication lists and publication information for 9 additional authors from the Korea Institute of Science and Technology Information’s (KISTI), Science and Technology Society Village (STSV), and Nurimedia’s DBPIA citation database. KRI publication data was then validated and supplemented by double-checking with STSV, DBPIA, and Naver’s Scholarly Publication Database service, after which Google Scholar was searched to update the international publication data (e.g., SSCI journal papers).
After all the publication data was compiled, we collected the citation data from KISTI’s Korean Science Citation Index (KSCI) and NRF’s Korea Citation Index (KCI). Since the KCI data appeared to be sparsely populated at the time of data collection, we used the KSCI to obtain citations to the five major Korean LIS journals and used KCI to obtain citations to other miscellaneous journal papers.1 The citations to international publications were collected from Web of Science and Google Scholar. The inclusion criteria for publication were as follows: For Korean publications, only the papers published in KCI journals were included.2 For international publications, only the papers published in peerreviewed journals as indicated in Ulrich’s Periodicals and peer-reviewed conferences as verified in the conference websites were included.
Although counting citations to estimate the quality of scholarly publication is fundamental to citation analysis (Garfield, 1979; Smith, 1981; Cronin, 1984), the effectiveness of citation count as a surrogate measure for publication quality has been questioned by researchers (MacRoberts & MacRoberts, 1996; Seglen, 1998). Limitations reported in literature range from the problems associated with limited data sources, sparse coverage of non-English publications, and omission of citations from nonjournal sources (e.g., books, conferences), to many technical problems dealing with synonyms, homonyms, and authority control (Funkhouser, 1996; Meho & Yang, 2007; Seglen, 1998).
Meho and Yang (2007) conducted a citation study that further demonstrated the necessity of using multiple citation sources. The study used citations to more than 1,400 works by 25 library and information science faculty to examine the effects of adding Scopus and Google Scholar data on the citation counts and rankings of these faculty members as measured by WoS. The study found that the addition of Scopus citations to those of WoS significantly altered the relative ranking of faculty in the middle of the rankings. The study also found that Google Scholar stands out in its coverage of conference proceedings as well as international, non-English language journals. According to the authors, the use of Scopus and Google Scholar, in addition to WoS, reveals a more comprehensive and complete picture of the extent of the scholarly relationship between library and information science and other fields.
Despite criticisms, which are largely concerned with the comprehensiveness of citation data sources, proponents have reported the validity of citation counts in research assessments as well as the positive correlation between them and peer reviews and lists of publications. In citation studies that compared peer assessment to citation counts (Oppenheim, 1995; Holmes & Oppenheim, 2001), researchers found that peer ratings of academic departments are strongly correlated to the citation counts for the publications by the members of departments. In a study that compared the results of expert surveys with citations to 10 German-language journals, Schloegl and Stock (2004) found strong correlation (+0.7) between reading frequency and the regional impact factor,3 the impact factor of journals, while finding slightly negative correlation (-0.11) between reading frequency and the overall impact factor. In addition to giving more evidence to the validity of citation count as a measure of research impact, Schloegl and Stock’s study underscored the importance of appropriate application of citation analysis by showing how simple adjustment for region resulted in a much different outcome. Li et al. (2010), who conducted a study correlating the results from an expert survey of publications by researchers with citation-based author scores (e.g.,
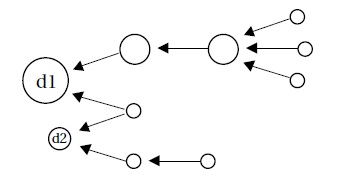
While the bulk of citation analysis studies has been focused on validating citation-based measures against the gold standard of human judgment, some researchers have explored the idea that not all citations are created equal (Cronin, 1984). Google’s PageRank (Brin & Page, 1998) can be regarded as an adaptation of Pinski and Narin’s algorithm to the setting of the Web to estimate the importance of web pages. A recent application of link-propagated citation weighting is the Eigenfactor score (Bergstrom, 2007), which calculates the impact of journals by aggregating citation weights that are computed in a manner similar to the PageRank score.
Aside from differentiating articles according to their importance or impact, a publication by multiple authors may be assigned a weight that corresponds to the contribution of each author. Zhang (2009) proposed a citation weighting scheme that multiplies the raw citation count by “co-author weight coefficients”4 based on author rank (i.e., the order of authors) to differentiate among contributions of multiple authors. Zhang extended an earlier reciprocal-rank based weighting proposal (Sekercioglu, 2008) that assigned the weight of 1/
Literature on bibliometric assessment of Korean faculty research is limited mostly to studies that analyze the publication data. A few studies that make use of the citation count rely on Web of Science, which does not have the complete citation data for Korean publications. Chung (2009), who evaluated the scholarly work of 41 Korean LIS professors published between 2003 and 2007 (239 journal articles and 49 monographs), compared the publication counts of authors with publication counts weighted according to faculty evaluation guidelines used in typical Korean universities.6 Chung emphasized the importance of qualitative over quantitative analysis of scholarly publications; however, his study did not delve deeply into specifics of the qualitative approach beyond the simple application of somewhat arbitrary publication quality standards (i.e., faculty evaluation guidelines). Yang and Lee (2012), in an analysis of 2,401 publications authored by 159 Korean LIS professors between 2001 to 2010, ranked LIS departments in Korea by publication counts in various categories, such as domestic (i.e., Korean) papers, international papers, per faculty, and overall, to highlight the effect of different bibliometrics on evaluative outcomes.
1 KSCI covers only science and engineering journals whereas KCI covers journals in all disciplines. Since the five major LIS journals covered in KSCI make up the bulk of LIS publications, it is likely that other journals may be of non-LIS disciplines and covered in KCI rather than KSCI.
2 KCI journals are those journals selected by the NRF to be included in KCI. They are similar to ISI journals in that they are regarded as high quality publications. There are 4 KCI journals in the LIS field.
3 To adjust the journal impact factor for a given region, the regional impact factor was computed by adding journal self-citation counts and numbers of citations from regional journals to the numerator of the impact factor formula.
4 First and corresponding authors are each given weights of 1 while the weights of remaining authors sum to one with co-author weights being inversely proportional to author ranks.
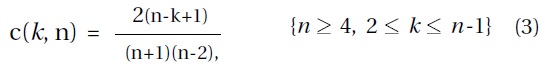
5 In the special case of c(2,3), the weight of 0.7 is assigned.
6 In many universities in Korea, faculty evaluation guidelines specify how research performance should be assessed. For instance, the guidelines may specify that articles published in SCI or SSCI journals receive 150 points while articles published in Korean journals of equivalent status obtain 100 points.
In order to test the reliability and stability of bibliometric indicators (BI) for research assessment, we compared the rankings of faculty members by various BI scores, such as publication count, citation count, and
3.1 Publication Count vs. Citation Count
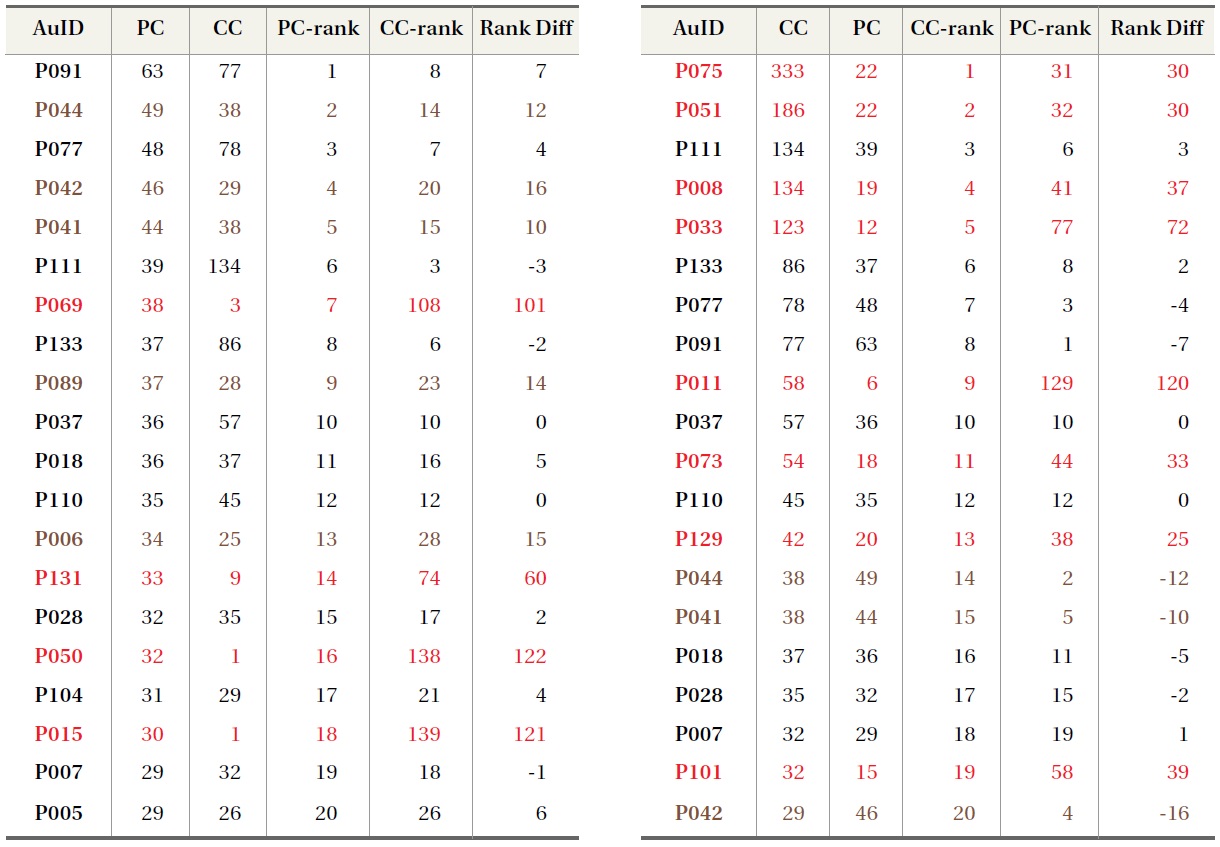
We first compared the ranking of the authors by publication count (PC) with the ranking by citation count (CC). Table 2 shows the top 20 faculty members ranked by PC versus the top 20 by CC. It can be seen that in the left table where authors are ranked by PC, large PC and CC rank differences (rows in red) are due to high PC and low CC. In other words,
[Table 2.] Top 20 Authors by Publication Count (PC) and Citation Count (CC)

Top 20 Authors by Publication Count (PC) and Citation Count (CC)
at least 4 out of 20 most-published authors in the study sample have very few citations to their work despite the high numbers of papers that they produced. On the other hand, large rank differences in the right table, where authors are ranked by CC, are caused by a handful of highly cited papers. For example, the top ranked author (P075) had four papers cited 179, 30, 26, and 18 times respectively, and the second ranked author had a paper with 87 citations and another with 45 citations. Similarly, the fourth and fifth ranked authors (P008 and P033) had 29, 20, 19, and 19 citations and 27, 23, and 21 citations respectively, and so on. Another interesting fact is that these highly cited papers are all international publications, whereas most of the papers with few citations in the right table are published in Korean journals.
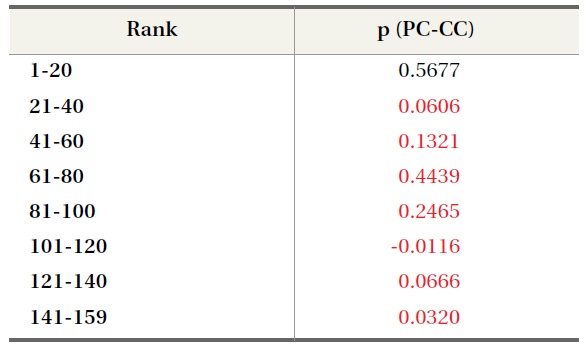
To ascertain whether PC and CC measure the same or different aspects of research performance, we computed the Spearman’s rank order correlation. For the entire rank of 159, Spearman’s rho showed positive association (p = 0.7045). PC and CC both being the measures of research performance, overall association between two indicators showing positive correlation seemed reasonable since pockets of differences are likely to be hidden when averaged over the entire ranking. To examine the rank differences at a finer grade, we computed the rank correlation for the rank intervals of 20 (Table 3). We can see clearly that PC and CC are not correlated at rank intervals, which indicates that PC and CC measure different aspects of research performance. Table 3 also shows that the strength of association gets weaker at lower rank intervals, which suggests the importance of citation counts for authors with low publication counts.
[Table 3.] Spearman’s Rank Order Correlation at Rank Intervals: Publication Count vs. Citation Count

Spearman’s Rank Order Correlation at Rank Intervals: Publication Count vs. Citation Count
Collaborative research projects produce publications with multiple authors. Typically, the first author is the main contributor with co-authors listed in the order of contribution amount. An exception to this format occurs when there is a corresponding author, who may sometimes be listed as the last author but whose contribution can be comparable to the first or the second author. A corresponding author may be someone akin to the principal investigator of a research project, who architected and directed the research that produced the publication, while the first author did the leg work and wrote the bulk of the paper. In such an instance, the contribution of the corresponding author should be counted heavily regardless of the author order. Zhang (2009), for example, assigns an author weight of 1 to both the first author and corresponding author, while remaining co-authors are assigned weights that diminish with the author order.
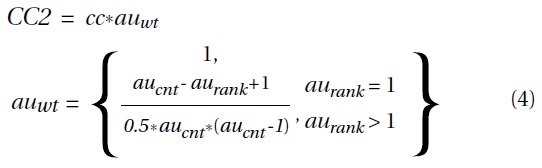
However, there is no guarantee regarding the contribution of the corresponding author and the order of authorship linearly corresponding to the contribution amount. Co-author contributions will probably vary from case to case, so the most accurate assessment should come from authors themselves. Since such information is impractical to collect in a large scale as well as being subject to personal bias and subjective interpretations, one must turn to readily available evidence, which is the order in which authors are listed in a publication. Based on the assumption that an author’s contribution to a collaborative work should correspond to what we call the “authorRank” (i.e. author order), we compared the raw citation count (CC) with citation counts weighed by their estimated contribution to the paper that is being cited. The first weighting formula (CC2) is a modified version of Zhang’s (2009) co-author weights. Since our study data did not include information on who the corresponding authors are, we assigned the first author the weight of 1 and the co-authors diminishing weights that sum to 1. The formula for CC2 is shown in Equation 4.
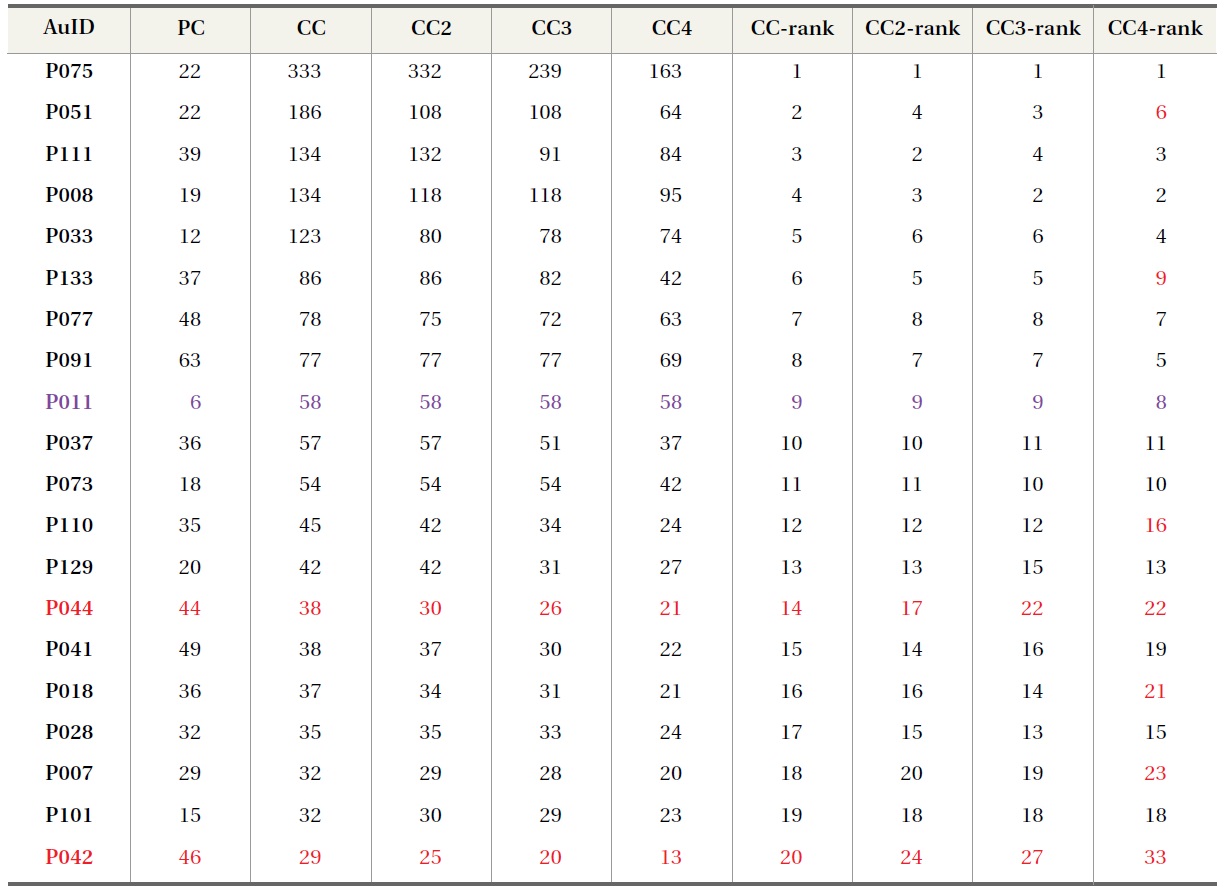
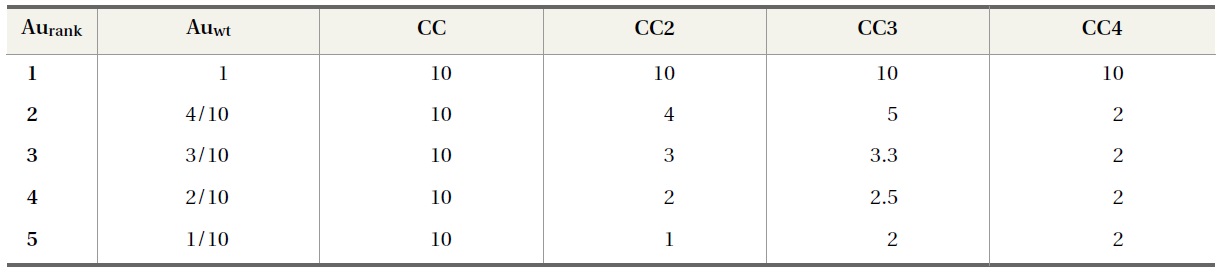
We also computed the second co-author weighting formula for citation count (CC3) using 1 over authorRank (Equation 5) and the third formula using 1 over author count (Equation 6). CC3 uses diminishing author weights, the sum of which can exceed the first author weight of 1, while CC4 assigns all co-authors the same weights that can be a small fraction of the first author weight for publications with many authors. An example shown in Table 4 illustrates the differences in the authorRank formulas.
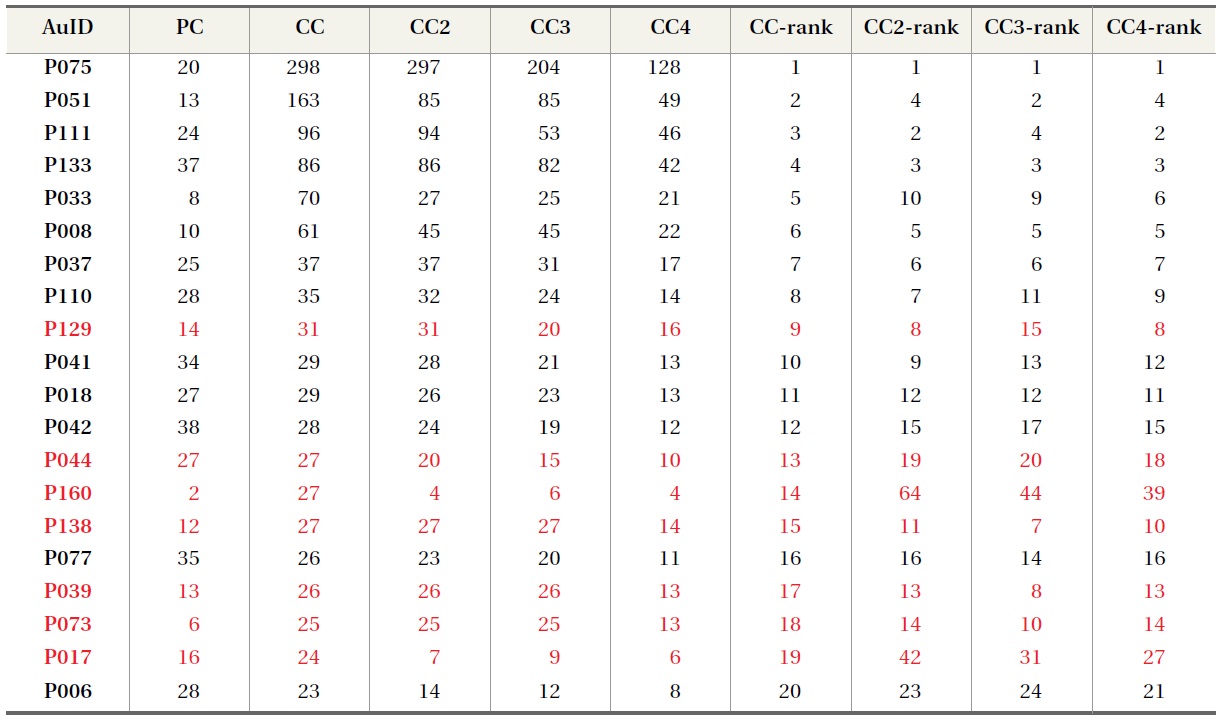
When we compared the rankings of authors by CC, CC2, CC3, and CC4, we observed only small differences
[Table 4.] Example: AuthorRank Weights Applied to Citation Counts
Example: AuthorRank Weights Applied to Citation Counts
[Table 5.] Top 20 Authors by Citation Counts, Using AuthorRank Weights

Top 20 Authors by Citation Counts, Using AuthorRank Weights
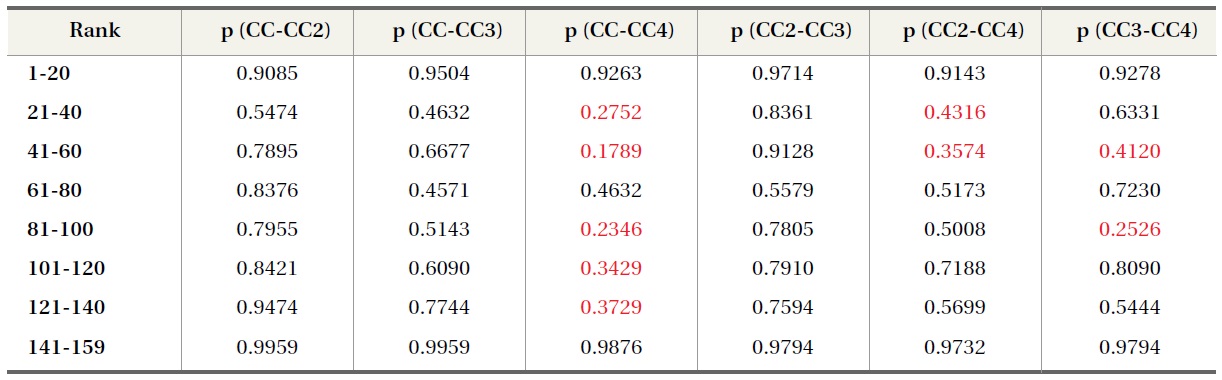
in rankings across authorRank weight formulas (Table 5). We attribute this to the fact that only about half of the study data is co-authored (31% with 2 authors, 16% with 3 or more authors). For the 51% of the single author papers, authorRank weights can have no effect, thus the authorRank effect is muted when averaged out over the entire study data. One notable occurrence in the Spearman’s coefficient table (Table 6) is the low numbers in the CC-CC4 column, which suggests that the raw citation count, which passes the entire impact indicator of a given paper to all authors equally, is quite different from CC4, which passes only a fraction of the impact indicator amount to the co-authors.
[Table 6.] Spearman’s Rank Order Correlation at Rank Intervals, Using AuthorRank Weights

Spearman’s Rank Order Correlation at Rank Intervals, Using AuthorRank Weights
[Table 7.] Top 20 Authors by Citation Counts, Using AuthorRank Weights (aucnt>1)
Top 20 Authors by Citation Counts, Using AuthorRank Weights (aucnt>1)
To isolate the effect of authorRank, we excluded single-author publications and redid the rank comparisons with authorRank. There were 1136 out of 2402 papers that were co-authored, 65% of which were written by 2 authors and 35% with 3 or more authors. As can be seen in Table 7, the rank differences are more pronounced without the single author papers, but Spearman’s coefficients still showed little differences and thus an insignificant effect of authorRank (Table 8). The strength of association, especially in the top rank interval, is weaker than when single-author papers were included, which may be due to a few authors who received many citations as co-authors. Restricting to coauthored papers reduced the total number of authors in the study data from 159 to 125, so the last row in the Spearman’s coefficient table spanned the rank interval of 5 instead of 20. The rho’s in the rank interval of 121-125 turned out to be all statistically insignificant, but we considered the ranking difference
[Table 8.] Spearman s Rank Order Correlation at Rank Intervals, Using AuthorRank Weights (aucnt>1)
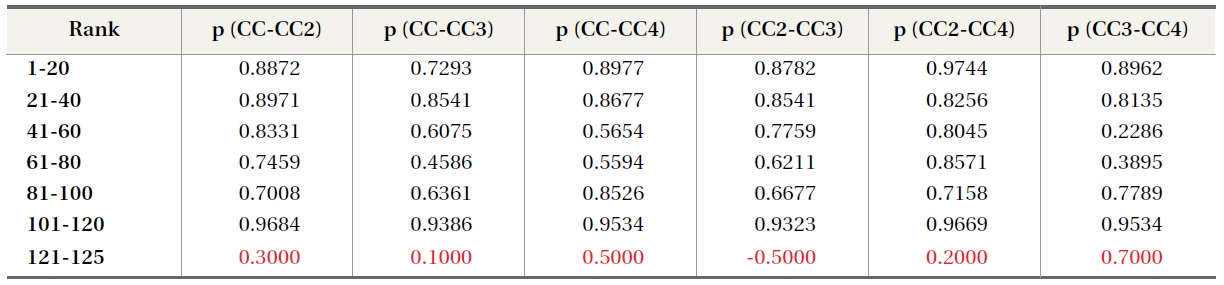
Spearman s Rank Order Correlation at Rank Intervals, Using AuthorRank Weights (aucnt>1)
[Table 9.] Author Rankings by Citation Counts Weighted by AuthorRank Weights (aurank>1)
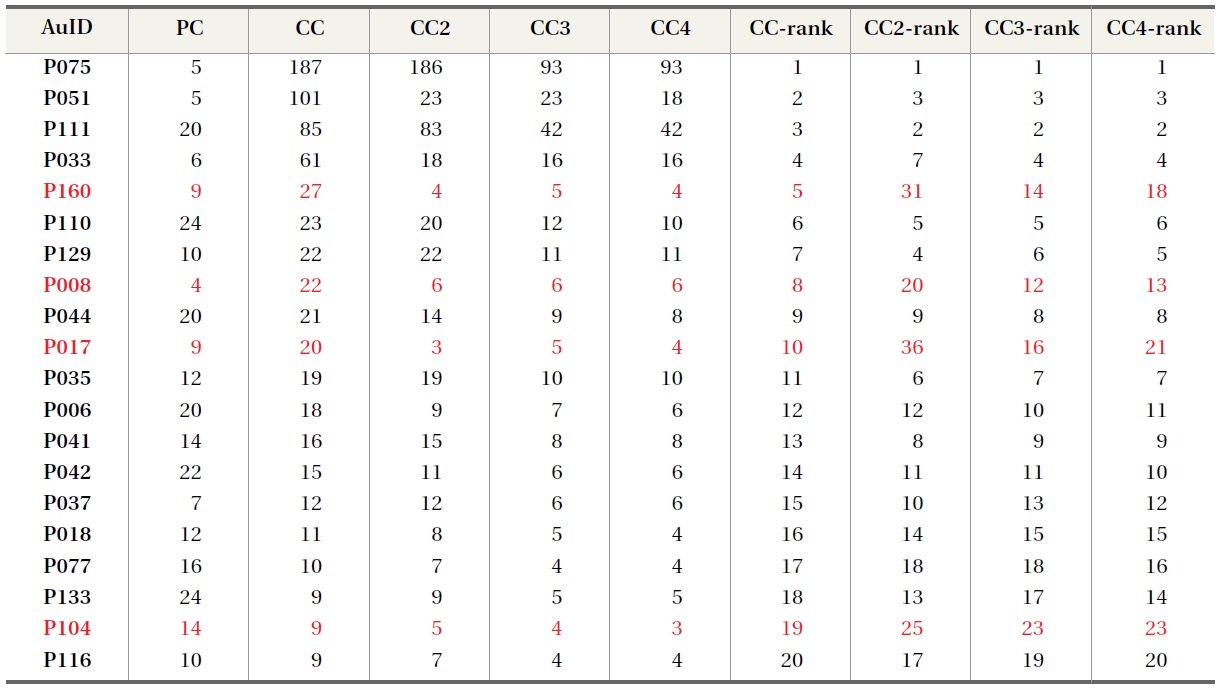
Author Rankings by Citation Counts Weighted by AuthorRank Weights (aurank>1)
in such a small interval to be not meaningful for gauging differences in bibliometric measures even if such outcomes were not spurious.
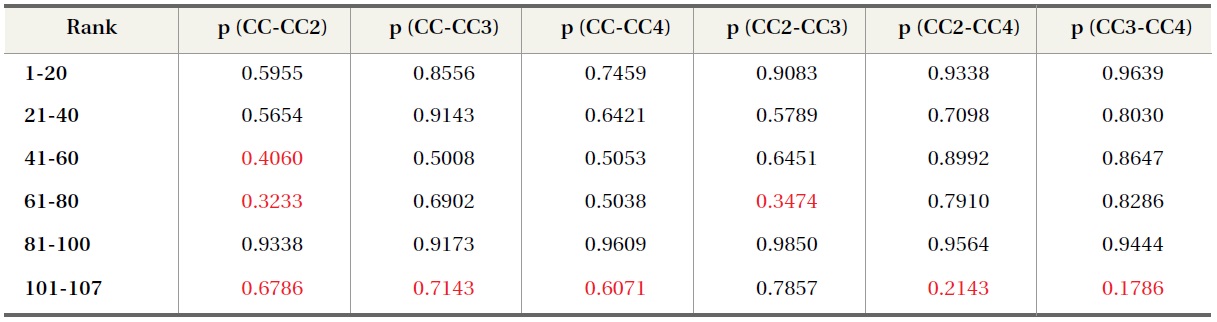
To isolate the authorRank effect further to the point of magnification, we excluded all publications from the study data where the faculty members in the study were listed as first authors. The resulting data subset included 107 authors that published 594 papers, where 61% were 2-author papers and 39% were papers with 3 or more authors. As expected, the rank differences became more pronounced with a restricted dataset (Table 9) with smaller rho across
[Table 10.] Spearman’s Rank Order Correlation at Rank Intervals, Using AuthorRank Weights (aurank>1)

Spearman’s Rank Order Correlation at Rank Intervals, Using AuthorRank Weights (aurank>1)
rank intervals (Table 10), which serves as evidence that non-primary author contributions should be treated differently from primary author contributions.
3.3. Publication Count and Citation Count vs. h-index and g-index
In addition to comparing publication count and citation count, which measure quantity and quality of research respectively, we investigated
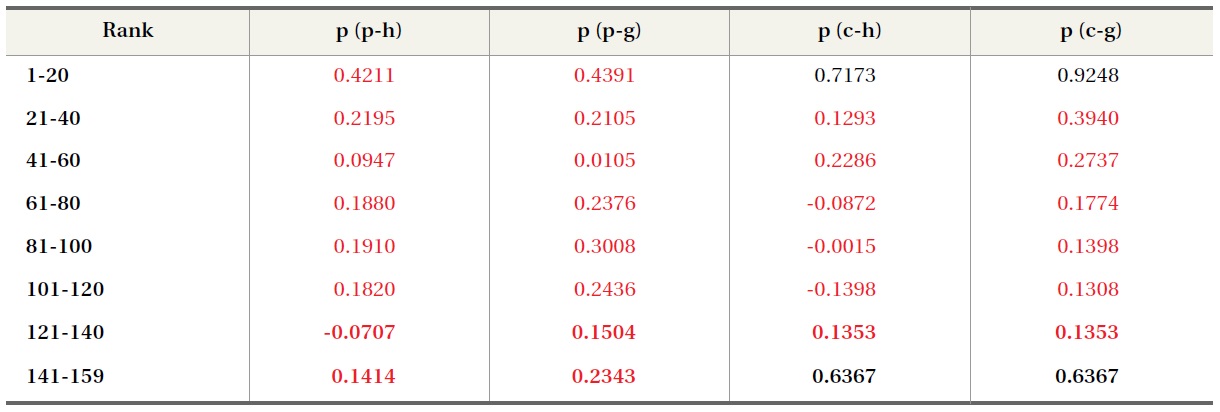
[Table 11.] Spearman’s Rank Order Correlation at Rank Intervals, Using PC/CC vs. h-/g-index

Spearman’s Rank Order Correlation at Rank Intervals, Using PC/CC vs. h-/g-index
differences in all rank intervals except for the very top and very bottom rank intervals, which could reflect the tendency of citations to overwhelm the
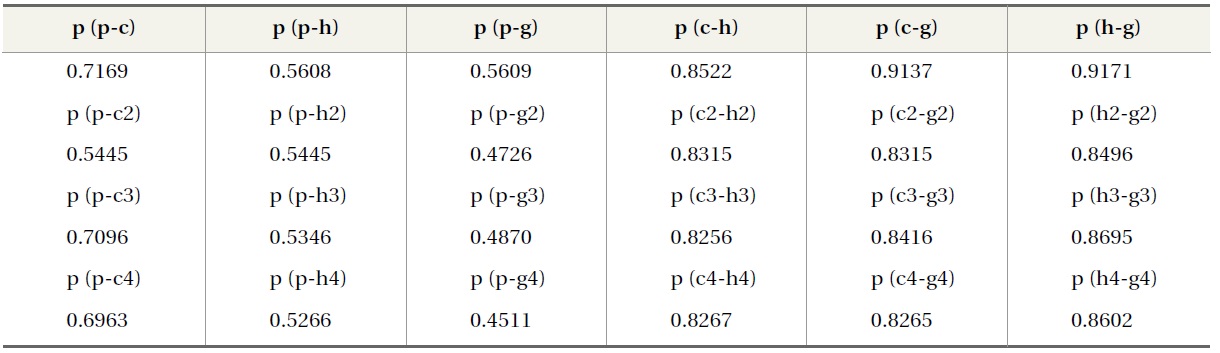
Table 12 shows the Spearman’s coefficients for the entire 159 authors with additional comparisons of authorRank weights, where suffixes correspond with authorRank formulas. For instance, h2 is ranking by
[Table 12.] Spearman’s Rank Order Correlation at Rank Intervals (Overall)

Spearman’s Rank Order Correlation at Rank Intervals (Overall)
We investigated how bibliometric indicators such as publication count and citation count affect the assessment of research performance by computing various bibliometric scores of the works of 159 Korean LIS faculty members and comparing the rankings by those scores. The study results showed correlation between publication count and citation count for authors with many publications but the opposite evidence for authors with few publications. This suggests that as authors publish more and more work, citations to their work tend to increase along with publication count. However, for junior faculty members who have not yet accumulated enough publications, citations to their work are of great importance in assessing their research performance.
The study data also showed that there are marked difference in the magnitude of citations between papers published in Korean journals and papers published in international journals. To say that this difference, which is over an order of magnitude in most cited papers, is due to the population size difference between Korean scholars and scholars in the world at large overlooks some important aspects of research impact. Specifically, we must keep in mind that the open access to a wide audience pool that most international journals enjoy increases the potential of research impact. In addition, research of significance should theoretically incur more citations than those exhibited in the study data regardless of its venue. Evidence to the contrary may be a reflection of citation behavior specific to Korean LIS researchers. Whether low citation counts to Korean journals reflect the impact of those journals or their environment, such as the size and characteristics of the user groups, remains to be seen. It may very well be that some of the papers published in Korean journals are of little interest to non-Korean scholars, in which case citation counts should be normalized accordingly. Papers with less than two citations, however, suggest low impact regardless of the size of the citation pool.
We also found that citation counts should be weighted according to authorRank for non-primary authors in multi-author papers. Though not conclusive, an author weighting formula that assigns decreasing weights to authorRank and sums to 1 may be the most robust approach to handling the authorRank effect. Another study finding is that
The study demonstrated that bibliometric approach to research assessment can produce different evaluation outcomes depending on how the data is analyzed. Such findings, even without the issue of data problems, should serve as a reminder that bibliometric methods have limitations and we should take care in interpreting their results. Research performance, let alone research potential, has many facets that quantitative methods cannot fully capture. Even the aspects of research performance that are quantifiable are not necessarily measured by the conventional bibliometric measures in a robust and consistent manner. We must therefore continue the investigation into research assessment approaches that can incorporate a wider spectrum of research performance in an efficient and effective manner. One of the key steps in future research must be to compare various measures across boundaries for the purpose of normalization. Evaluation of research performance using document-level versus journal level measures (e.g., citation count vs. journal impact factor) and analysis of impact factor differences across disciplines and countries would be good places to begin exploring ways to normalize these measures that in some cases are like apples and oranges.