Intercropping is the practice of growing more than one crop in a field at the same time. It was commonly practiced up until 1940 in areas where farmers had only limited access to the necessary agricultural equipment and mechanization that transformed agriculture into the specialized and uniform process which it is today. Modern industrialized agriculture typically plants monocultures in order to gain higher productivity and efficiency in crop management (Smith and McSorley 2000).
While weed control problems were low in a multiplecrop traditional form of agriculture, monoculture and intensive farming increased weed problems, and the use of herbicide rapidly became the primary method of weed control (Brainard and Bellinder 2004). Today, agricultural science is working to develop methods of sustainable agriculture, and one of the basic approaches is the intercropping of several species that can grow effectively together, with complementary nutrient requirements, and nutrient returns after harvest. Moreover, many intercropping combinations work through enhancing the secondary crop enhancing the availability of nutrients to the primary crop. The total uptake of nutrients (N, P, and K) in the study of Tian (2010) was greater in intercropping systems in comparison to that of sole cropping. In addition, intercrops have been shown to reduce populations of numerous weeds under a wide range of conditions. Connolly et al. (2001), reported that in 150 intercropping studies involving 198 herb species 53% of the herb species became less abundant over the course of the study in the intercropped fields, 18% were more abundant, 9% showed no difference and 20% showed a variable response.
Cereals and legumes are the most common intercropping system (Odhiambo and Ariga 2001), which stands to reason based on cereals being in high demand, and many legumes having the ability to fix nitrogen. In the study of Tsubo et al. (2005), total land equivalent ratios (LERs) greater than 1.0 were generally found in combinations of bean-maize intercropping, but different bean plant densities had no influence on maize or bean yields, which represented that intercropping maize and beans increased the total yield and field performance of each crop, but that different density ratios of these crops may not affect a crop’s performance.
Although the intercropping of cereals and legumes is an agricultural tradition that has been carried out for thousands of years and is widespread in many parts of the world; it is still poorly understood from an agronomic research perspective (Lithourgidis et al. 2011). Thus, the objective of this study was to compare different ratios of maize-bean intercropping, as the most common and successful intercropping system, and to evaluate effects of different weed control strategies on productivity.
>
Experimental design and plant materials
Field experiments were carried out during two consecutive years (2010-2011) in the Research Field of the
[Table 1.] Soil properties (0-30 cm) before plant sowing

Soil properties (0-30 cm) before plant sowing

Precipitation amount (mm) of the experiment area that located in Fars Province, Iran for the first and second years (2010 and 2011) of study
College of Agriculture, Shiraz University, Bajgah located in the province of Fars, Iran (29°43′ N and 52°35′ W). Soil characteristics and precipitation amounts are presented in Tables 1 and 2, respectively.
The experiment was arranged as a randomized complete block design with three replications. Common bean (
Planting was done by hand in the experimental plots (3 × 3 m) and took place in early June in both years. Chemical fertilizer was applied by hand at a ratios of 60 kg N/ha (as urea for starter) and 80 kg P/ha (as superphosphate) prior to sowing. The weed-free treatments were hand weeded weekly during the growing season, after the germination of the plants. Surface irrigation (border-strip) was used in the study.
The first factor was the different ratios of maize-bean (sole maize, sole bean, intercropping of maize-bean at ratios of 1:3, 2:2, and 3:1) and the second factor the different treatments of weed management (weedy and weed-free).
Each plot of sole maize cropping consisted of five rows 60 cm apart and with lengths of 3 m. The space between maize plants in each row was 30 cm. For applying the intercropping system it was assumed that each row of maize was equivalent to two rows of bean and was therefore replaced by two bean rows. Hence, each plot of sole bean cropping consisted of ten rows 30 cm apart, and was 3 m long and 15 cm apart (15 plants/m2). Other intercropping densities were as follows (according to Koocheki et al. 2009):
Maize-bean
M3B1 = 3 rows of maize with 60 cm distance and 2 rows of bean with 30 cm distance
M2B2 = 2 rows of maize with 60 cm distance and 4 rows of bean with 30 cm distance
M1B3 = 1 row of maize with 60 cm distance and 6 rows of bean with 30 cm distance
Leaf area for both crops was measured at the flowering stage, using a leaf area meter. Plant height, leaf number per plant and branch number per plant were also measured at the flowering stage of both crops. A harvest area of 1 × 1 m was made by hand at about 110 and 140 days from the time of sowing (at ripening stage) for bean and maize respectively, in order to evaluate the yield and yield components. At harvest time, plant characteristics including: pod number per plant, grain number per pod, 100-grain weight and grain yield for bean, and row number per ear, grain number per row, ear length, 100-grain weight and grain yield of maize were measured, and the average data from the five measurements were used for further analysis. The LER was used to assess the performance of intercropped plants relative to the corresponding sole cropped plants using the following formula (Mead and Willey 1980):
, where Yi is the yield of different intercropping patterns of maize or bean and Yj is yield of the related sole cropping. Total LER was calculated using the summation of both maize (LERm) and bean (LERb) crop’s LER.
Total LER = LERm + LERb
Tests of homogeneity of variance for combined data of two years was done after confirmation of data homogeneity, combined analysis of variance was performed a using general linear model (GLM) [The data transformed using (log) before running GLM model], procedure by SAS statistical software (SAS Institute Inc., Cary, NC, USA). In this model the effect of year was considered as a random effect while intercropping and weed management were fixed effects in the model. The least significant difference method (
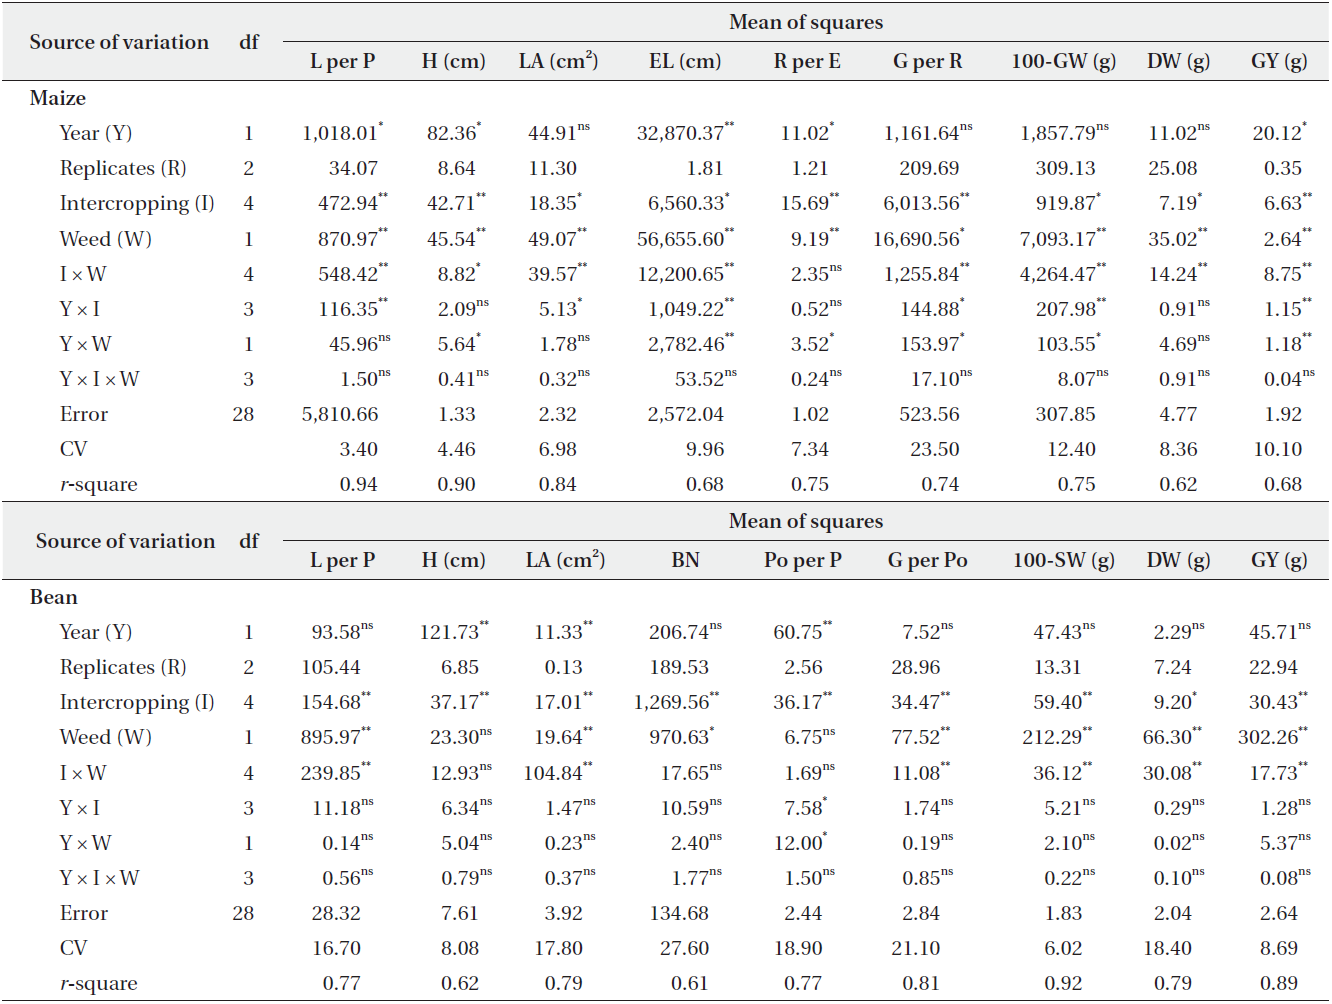
Results of the combined analysis of variance for each crop and each year are presented in Table 3. For maize, the effect of year on numbers of leaves per plant (leaves per plant), plant height, ear length, numbers of rows per ear and grain yield was significant (
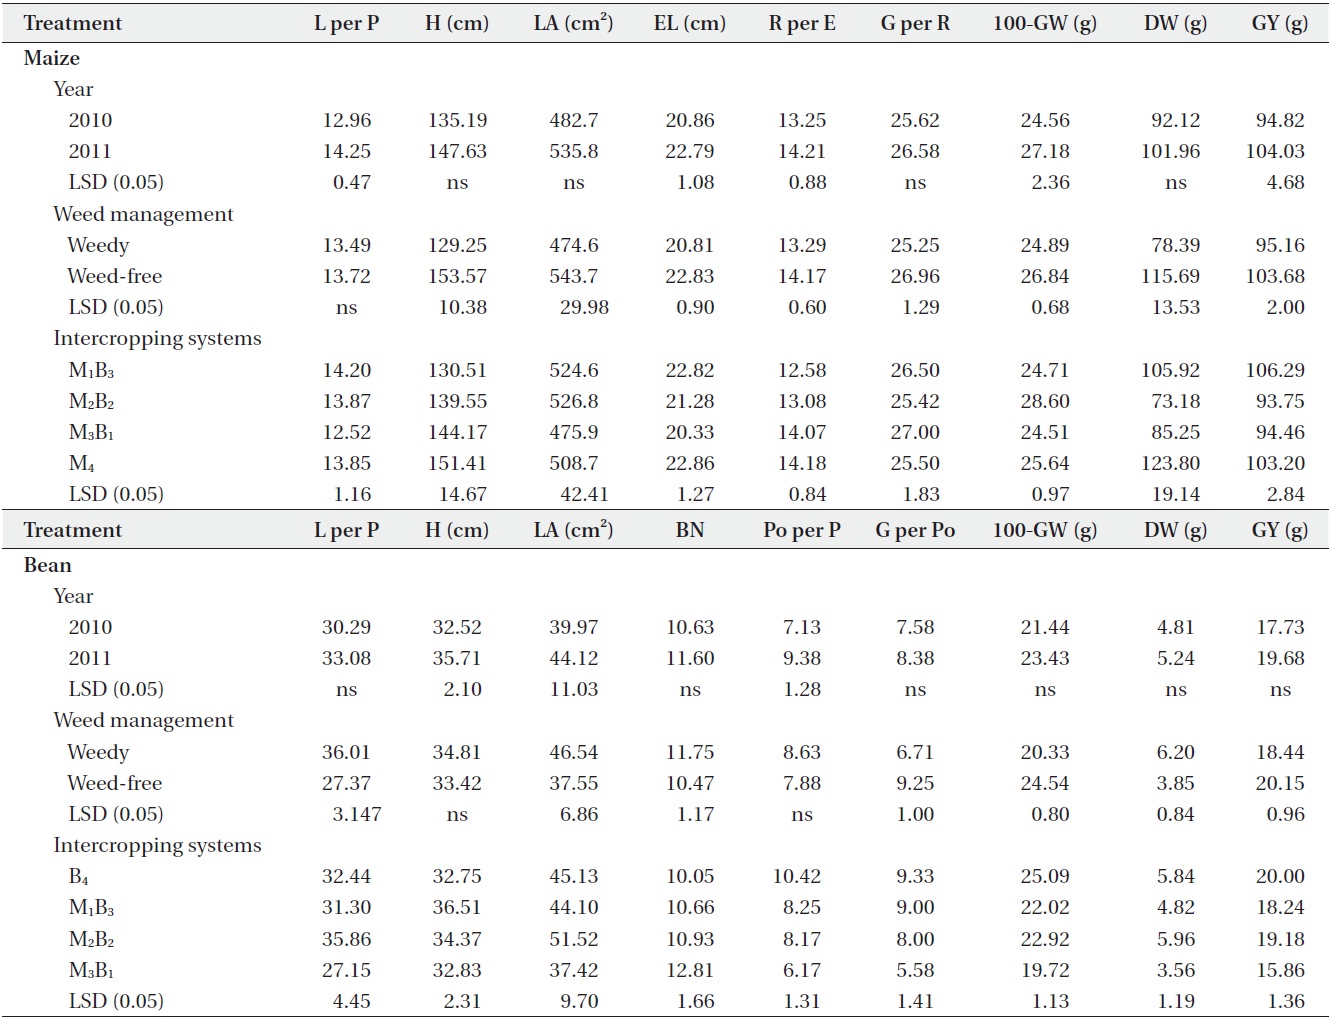
Mean values of all traits of maize showed that plants of the second year (2011) were of a better condition than those of the first year (2010) but some of these differences were not significant (Table 4). The weed-free condition showed higher mean values for all measured traits of maize than conditions with no weed control. The maximum values for plant height, ear length, rows per ear and dry weight of maize were observed in the maize sole cropping system. M3B1 showed the maximum mean for grains per row only, while M1B3 showed the maximum mean for leaves per plant and grain yield for maize. There was no significant difference between maize sole cropping and M1B3 for grain yield. Leaf area and 100-grain weight of maize were the highest in M2B2. M3B1 had the minimum mean for leaves per plant, leaf area, ear length and 100-grain weight for maize, however M1B3 had the minimum mean for plant height and rows per ear. Lowest mean values were observed in grains per row, dry weight and grain yield in M2B2 intercropping. No difference was evident between M2B2 and M3B1 for grain yield.
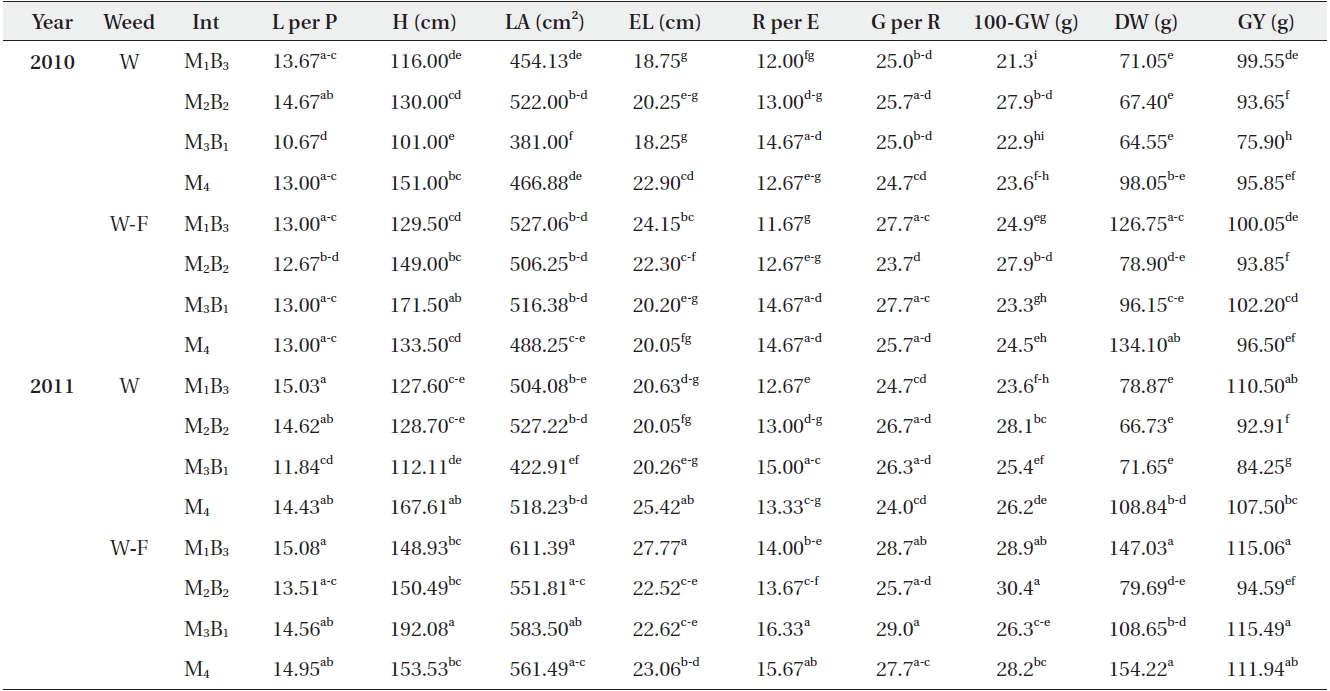
Mean comparison of the interaction of year, weed management and intercropping systems for all traits were shown in Tables 5 and 6 for maize and bean, respectively. The interaction comparison showed that all the measured traits of maize in the second year (2011) were higher than those in the first year (2010); furthermore, most of the traits were higher under weed-free conditions compared weedy conditions in both years (Table 5). Higher mean values of leaves per plant, leaf area and ear length were recorded in the M1B3 intercropping treatment under weedfree conditions in the second year, whereas, M3B1 showed maximum means for plant height, rows per ear and grains per row in the second year and in the weed-free condition for maize. The maximum mean for maize 100-grain weight was obtained in M2B2 in the second year and in the weed-free condition, but its difference with M1B3 was not significant.
Maximum maize grain yield was obtained jointly in M1B3 (115.06 g) and M3B1 under weed-free conditions in the second year and the maximum dry weight was obtained in M1B3 and maize sole cropping in the second year under weed-free conditions. Leaves per plant, plant height, leaf area, ear length, dry weight and also grain yield of maize were lowest in the M3B1 intercropping system in the first year under conditions of no weed control. Lowest 100-grain yield and rows per ear were observed in M1B3 under conditions of no weed control, and in the first year.

Results of the combined analysis of variance for measured traits for maize and common bean
In the weed-free condition in the first year of the study, M2B2 showed the lowest mean for grain number per row.
Results similar to these were obtained for maize, and all measured traits in the second year showed that plants were of a better condition than those in the first year for bean (Table 4). With the exceptions of grain yield, 100-grain weight and grains per pod, all other measured traits of bean were higher under conditions of no weed control than under weed-free condition. Sole bean cropping had the highest mean values for grain yield, 100-grain weight, grains per pod and pods per plant. Leaves per plant, leaf area, branch number per plant and dry weight of common bean were all highest in the M2B2 intercropping treatment. M1B3 had the maximum mean value for plant height only, while M3B1 had no highest mean value among any of the measured traits. M3B1 showed lower means of all the measured traits for bean.
Sole bean cropping under weedy conditions in the second year resulted in the highest mean value for leaves per plant (Table 6). Also, sole bean cropping under weed-free conditions in the second year had the highest grains per pod and 100-grain weight; and under weed-free conditions in the first year had highest dry weight. The M1B3 intercropping treatment resulted in the highest mean for bean height in both years under weedy conditions, and also for bean pods per plant in the second year under weed-free conditions. Branch numbers per plant of bean in M3B1 in the second year and in the weed-free condition were highest. The highest bean grain yield was recorded in M2B2 in the second year and in the weed-free condi-

Results of traits mean comparisons for year, weed managements and intercropping systems for maize and common bean
tion. M2B2 also had the maximum leaf area in the second year under conditions of no weed control. The lowest mean values for pods per plant, grains per pod, 100-grain weight, dry weight and grain yield of bean was obtained in M3B1 under the condition with no weed control in the first year. However, the lowest levels of leaf area and bean height were also recorded in M3B1 in the first year but under weed-free conditions. Bean sole cropping under weed-free conditions in the first year of the study had the minimum mean value for branch number per plant and leaf number per plant.
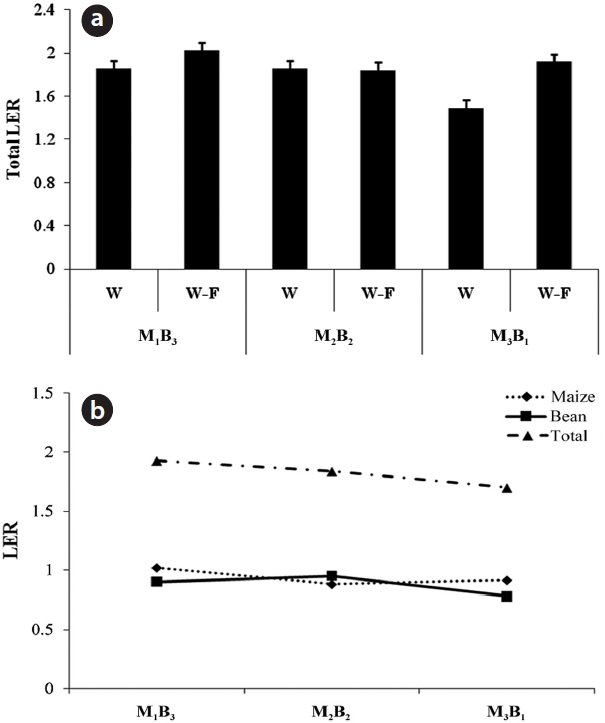
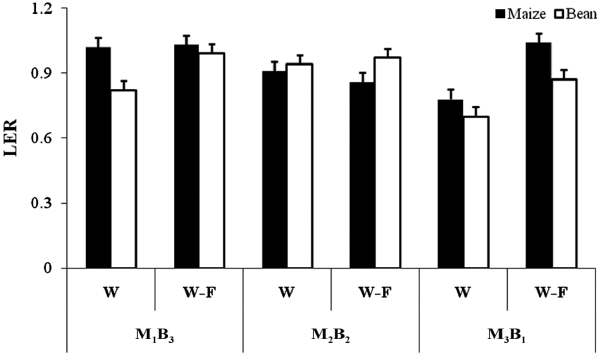
LER were calculated separately for maize and bean and also for the sum of both, and these calculations are presented in Figs. 1 and 2. The minimum LER for maize was obtained for M3B1 under conditions of no weed
Mean comparison of interaction for years, weed and intercropping systems for maize using the slice procedure in SAS program
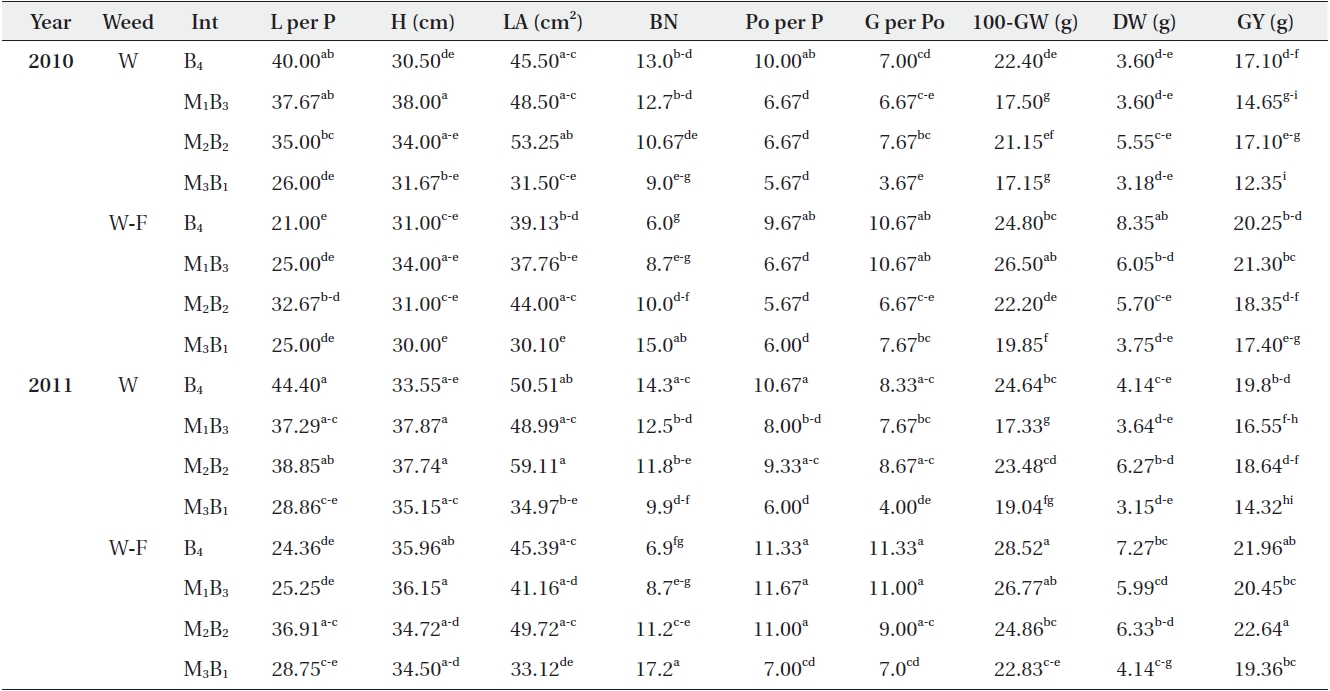
Mean comparison of interaction for years, weed and intercropping systems in common bean using the slice procedure in SAS program
control, while the highest LER of maize was observed in M3B1 under weed-free conditions, and they showed a significant difference to one other. In addition M1B3 under both conditions had LER values of over 1.0, but the other intercropping treatments had LER values lower than 1.0
(Fig. 1). The highest and the lowest LER values for bean were determined for M1B3 under weed-free conditions, and for M3B1 under conditions of no weed control, respectively. There was no significant difference in LER between M2B2 under both conditions and M1B3 for bean LER (Fig. 1). M1B3 under weed-free conditions showed the highest total LER (2.02) but M3B1 under conditions of no weed control was the lowest (1.48) one (Fig. 2a). Regression analysis for LER (Fig. 2b) showed that M2B2 for bean but M1B3 for maize and also totals of both maize and bean were higher than for other intercropping systems. These results indicate that the M2B2 intercropping system was the more suitable in conditions of no weed control than in weed-free conditions. However, intercropping bean and maize can be an effective method to increase total productivity, and the M1B3 system was the best cropping system for high productivity.
Results of analysis of variance showed significant effects of intercropping systems, weed management and their interaction for most of the traits in both crops, indicating the existence of significant differences among the different cropping systems. Although the effect of year, as a source of variation in analysis of variance, was significant for just some of the traits, the second year showed higher values than the first in all measured traits of both crops. Higher significant values for some traits in the second year might have been due to favorable weather conditions, such as greater rainfall (Table 2) or better environmental conditions at the time of the field trial.
With the exception of leaves per plant, other traits for maize under weed-free conditions were significantly higher than those of weedy condition. However, in terms of leaves per plant there was no significant difference between the two treatments. In contrast to the results for maize, bean leaves per plant, as well as plant height, leaf area, branch number per plant, pods per plant and dry weight had higher mean values (significant or not significant) under weedy conditions, but bean grain yield, bean 100-grain weight and bean grains per pod were higher under weed-free conditions. Maybe these results for bean relate to interspecies competition between bean and weeds for nutrients and water uptake, which caused higher growth rates of bean plants under conditions of no weed control (Abraham and Singh 1984).
The weed-free condition showed higher amounts of bean dry weight and pods per plant, and also bean grain yield in comparison to conditions of with no weed control. Similar to these results, the study of Pandey and Prakash (2002) which evaluated different methods of weed control and maize-soybean intercropping treatments, demonstrated that all the weed control treatments including hand weeding and chemical treatment effectively controlled weeds and produced significantly more grain yields in both maize and soybean crops, and that maize had an equivalent yield compared to that under conditions without weed control. Piri et al. (2011) noted that intercropping combinations of pearl millet and red bean were more advantageous from sole cropping in terms of weed control. Brainard and Bellinder (2004) showed that a good intercropping combination of crops can suppress weed growth and decrease herb populations in the field.
Intercropping treatments showed different effects on measured traits for maize and bean. There was also significant interaction between weed and intercropping in the analysis of variance for most of the traits in both crops, indicating that different intercropping systems probably have different effects on the traits of both conditions, with both no weed control and weed-free conditions. In some interactions, bean had higher values under the conditions of no weed control in comparison to weed-free conditions; while in all measured traits of maize, results from the weed-free condition were higher, implying that weed species were in greater competition with bean than with maize. The highest grain yield and dry weight of maize belonged to the maize sole cropping treatment but it was not significantly different from the M1B3 intercropping treatment.
In addition, in most other maize traits, the M1B3 intercropping treatment showed comparative, or the highest values. Leguminous beans can fix N via symbiotic bacteria of the root, whereas maize is a cereal crop which can only uptake available N which is provided to it. Therefore, application of N fertilizer is more effective for this crop.
In cereal-legume intercropping, cereal crops form relatively higher canopy structures than legume crops, and the roots of cereal crops grow to a greater depth than those of legume crops. This indicates that the component crops probably have differing spatial and temporal use of environmental resources such as radiation, water and nutrients (Anil et al. 1998). Therefore, this cropping system may help improve productivity of low external input farming, which depends largely on natural resources such as rainfall and soil fertility.
However, the highest bean grain yield was obtained for bean sole cropping, which was not different from the M2B2 intercropping system, while the highest bean dry weight was observed in M2B2. Furthermore, M2B2 was also high in other measured traits of bean. M2B2 had the lowest mean value of maize grain yield and dry weight and was not significantly different from the M3B1 intercropping treatment. Except in terms of branch number per plant, M3B1 showed the lowest values for the measured traits of bean. These results show that if the final plan is to produce a higher yield for just one of these crops, sole cropping provides a more effective system for gaining a higher grain yield. However, among intercropping systems, if higher yield productivity is important for both crops, the most successive cropping system is M1B3 for maize as the first and most important crop, and M2B2 where higher yields of bean are sought. The M3B1 intercropping system is not a suitable system in comparison to others for both crops.
Bean sole cropping (14.66%), M1B3 (25.15%), M2B2 (12.24%) and M3B1 (27.53%) intercropping systems had lower grain yields under conditions of no weed control in comparison to weed-free conditions, while the rate of grain yield reduction of maize under conditions of no weed control in comparison to weed-free conditions for maize sole cropping, M1B3, M2B2 and M3B1 intercropping systems were 2.32%, 2.23%, 0.99%, and 23.39%, respectively. So, the lowest reduction in grain yield in both crops from the condition with no weed control to the weed-free condition was in the M2B2 intercropping system for both crops. These results indicate that the M2B2 intercropping system was the more suitable for conditions of no weed control than for weed-free conditions. The prominence of M2B2 for beans under conditions of no weed control may have been due to the differing morphology of bean and maize; maize with its higher height may be able to restrict light for weed growth in the plots, with the result of a better situation for bean to compete with weeds. Also the limited availability of light was possibly compensated for in bean, because maize has a high ability to form a symbiotic relationship with mycorrhizal fungi (Sheng et al. 2011). This symbiotic fungal activity for maize root probably results in an increased availability of phosphorus or other nutrients to bean plants, and helps them achieve higher growth.
Under weed-free conditions, based on the results of the LER analysis, M1B3 and M2B2 showed the best results, but M1B3 under conditions of no weed control had a lower LER. The total LER for both bean and maize in all intercropping treatments under conditions of no weed control and under weed-free conditions were higher than 1.0 (1), showing yield and growth advantages from intercropping. The highest total LER (2.02) was obtained in M1B3 under weed-free conditions, indicating more influence of this intercropping system in this condition than in the other intercropping systems.
Results showed that M3B1 and M1B3 were the more suitable intercropping patterns for maize under condition of no weed control, but under weed-free conditions M3B1 was not an effective system. Regardless of weed control, or year of the experiment, M2B2 for bean and M1B3 for maize showed higher LER than other intercropping patterns, while total LER in M1B3 was the highest (Fig. 2b). In intercropping of maize-bean, LERs between 1.06 to 1.86 were obtained previously (Tsubo et al. 2003); in this research the authors concluded that maize-bean intercropping can be recommended to small-scale farmers. Tsubo et al. (2005) showed that a total LER greater than 1.0 was generally found in combinations of intercropping, but different bean plant density had no influence on maize or bean yields; it was concluded that intercropping of maize and bean increases total yield and field performance but different density ratios of these crops may not affect a crops’ performance.
Zhang et al. (2001) reported contributions of aboveground and belowground interactions to increase nitrogen uptake by wheat at 22% for wheat-soybean intercropping. They also reported that the contribution of aboveground and belowground interactions on an increase of P uptake were about 27% for wheat/soybean intercropping. Their study showed that intercropping can use soil resources more efficiently. In the study of Abraham and Singh (1984) intercropping of legumes increased growth, uptake of N, P and K and yield of sorghum compared to sole cropping of sorghum.
The results of Zuo et al. (2000) demonstrated that improvement in the Fe nutrition of peanut intercropped with maize was mainly caused by rhizosphere interactions between peanut and maize. Li et al. (1999) noted that interspecies root interactions between intercropped fava bean and maize played an important role in increasing yield and nitrogen and phosphorus acquisition within an intercropping system. Ghaffarzadeh et al. (1994) found that strip intercropping led to a 20-24% greater maize yield and a 10-15% lower soybean yield in adjacent border rows in a maize/soybean intercropping system.
The results of this study indicate that bean and maize intercropping was capable of increasing productivity. In an intercropping system of maize-bean, if the primary crop is maize, for both the conditions with no weed control and weed-free; M1B3 is a suitable intercropping system, while where bean is the primary crop, M2B2 is the best. While the highest LER of maize (1.03) was observed in M3B1 with the weed-free condition, they showed significant differences with each other. Overall, for the practical purpose of agriculture, the intercropping pattern M1B3 is the best system to be recommended for field productivity.