Gobies (family Gobiidae; suborder Gobioidei) are incomparable among vertebrates in their capacity to adapt and diversify, which has led to adaptive radiation and rapid speciation (Zander, 2011). Gobiid fishes are hyperdiverse compared with other teleost groups, with approximately 2,000 species in 210 genera occurring in marine, freshwater, and blackish habitats. These fish show remarkable morphological and ecological variety (Nelson, 2006; Zander, 2011). Gobiid fishes are globally distributed (Nelson, 2006) and frequently represent a dominant component of coral reefs and coastal fish communities throughout much of their range, accounting for >50% of the energy flow in some coral reef habitats (Herler et al., 2011). Despite their evolutionary and ecological importance, the phylogenetic relationships among species within Gobiidae and their location within Gobioidei are still poorly understood (Murdy, 1989; Parenti and Thomas, 1998; Thacker and Schaefer, 2000; Larson, 2001). To date, the classification of gobies still remains largely reliant on external morphology (Pezold, 1993; Akihito et al., 2000; Nelson, 2006), and diagnostic characters separating species are subtle and problematic.
Molecular biology has contributed to addressing taxon identification and phylogenetic relationship questions. Mitochondrial DNA (mtDNA) markers have historically formed the core of most molecular systematic analyses and are still the most widely used for reconstructing phylogeny (Brown et al., 1979; Moore, 1995; Johns and Avise, 1998); this is probably due to their single copy nature and relative ease of sequencing (Moore, 1995). Genetic divergence is also enhanced by the higher rate of sequence evolution in vertebrate mtDNA compared to that of nuclear coding regions (Johns and Avise, 1998). However, the choice of a suitable gene is crucial for identification and phylogenetic reconstruction among closely related species (Brown et al., 1979; Moore, 1995; Johns and Avise, 1998), because different parts of the mtDNA genome evolve at different rates (Avise and Ellis, 1986; Roques et al., 2006).
Mitochondrial cytochrome oxidase subunit I (COI) could serve as a rapid and reliable barcoding marker for identifying species and for discovering new species across the entire animal kingdom (Hebert et al., 2003). Although skepticism has frequently been expressed (Ebach and Holdrege, 2005; Will et al., 2005), DNA barcoding based on COI has been successful to identify species across a wide array of taxa over the last decade (e.g., Hebert et al., 2004; Clare et al., 2007; Hubert et al., 2008; Feng et al., 2011). A clear gap should exist between intra- and interspecific COI sequence divergence with about a 20-fold difference for DNA barcoding to be perfectly effective in delimitating species (Hebert et al., 2003). A standard sequence threshold can be projected to outline species boundaries by employing this barcoding gap. However, utilizing such a threshold value may be challenging, particularly when attempts do not include numerous specimens, such as for critically endangered taxa.
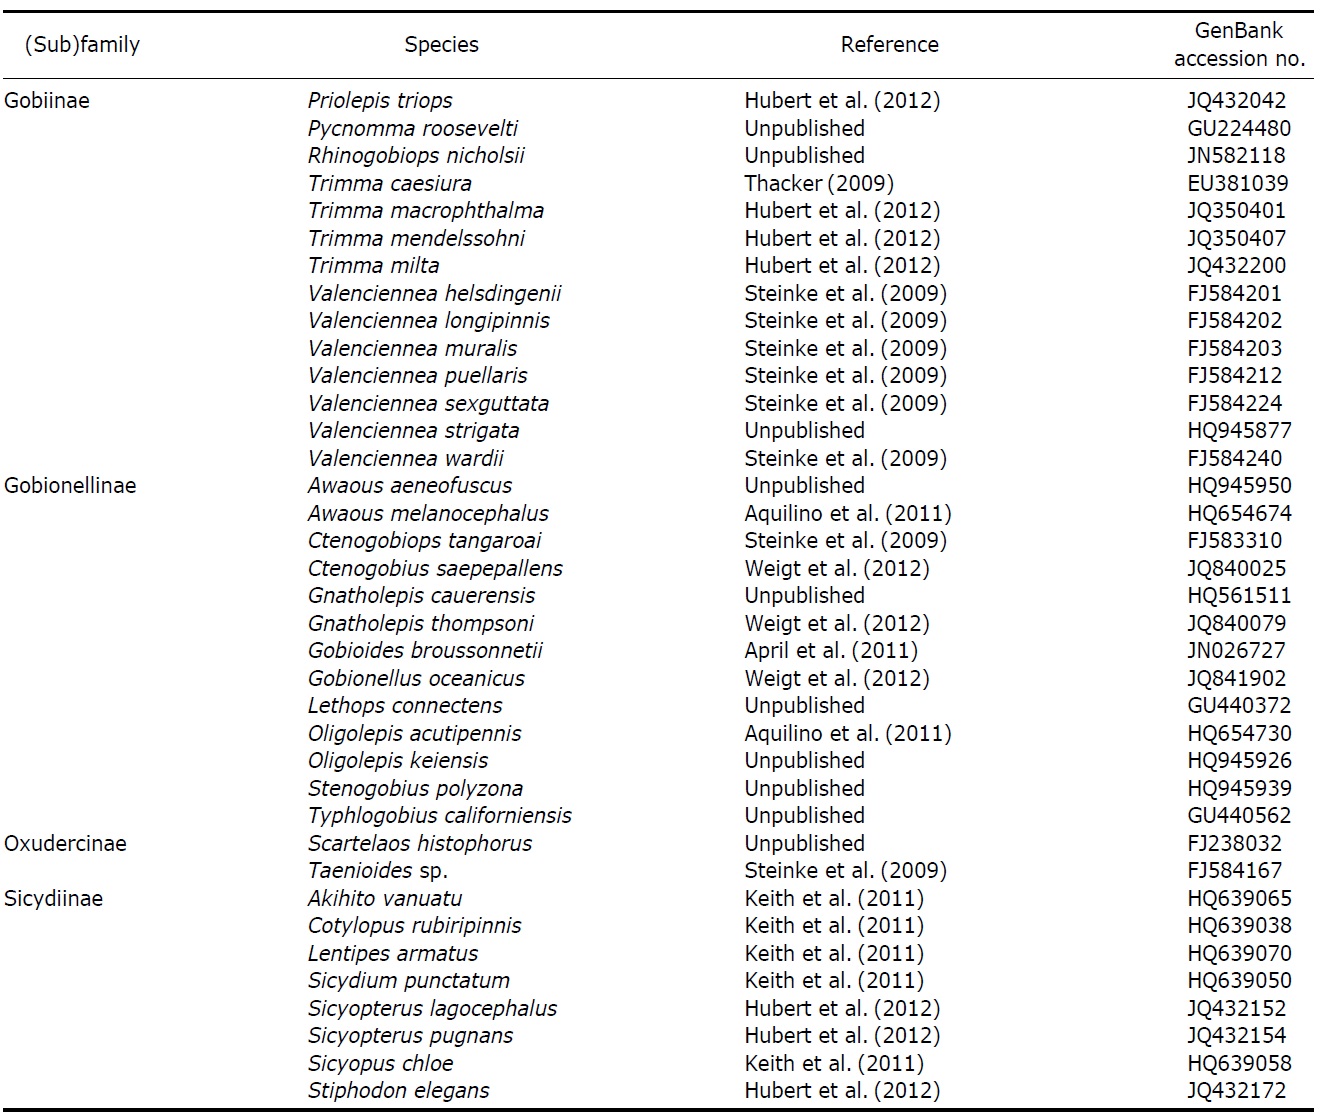
Only a few studies have addressed gobioid interrelationships based on molecular data (e.g., Akihito et al., 2000; Wang et al., 2001; Thacker, 2003, 2009; Thacker and Hardman, 2005). These studies used different taxon and nucleotide sampling methods. Yet, testing the effectiveness of COI DNA barcodes on species that have emerged as a result of radiation, such as gobies, remains a major challenge in evolutionary biology. Here, we sequenced the COI of 48 species collected from South Korea (Table 1) to evaluate the performance of distance-based DNA barcoding for phylogenetic analyses. We specifically aimed to provide novel data on a comparison of pairwise divergence levels among species in the same genus vs. species in different genera. GenBank sequences were also included in the analyses to use a dataset with large taxonomic coverage (n=144 species) (Table 2).
Fish were collected using seine and dip nets from January to November 2011 from 21 sites across freshwater systems, coastal areas, and the ocean near South Korea (Table 1). Specimens were identified based on morphological characters. Entire bodies of all individuals were preserved in 95% ethanol, and 44 nominal species were sequenced for COI gene fragments.
>
DNA isolation, amplification, and sequencing
We used the Wizard Genomic DNA purification kit (Promega, Madison, WI, USA) to extract genomic DNA from the right pectoral fin of each fish specimen. The COI was amplified using gobiid-specific primers: GOBYF7558 (forward) 5′- TTT GCW ATT ATG GCW GGA TTT G-3′ and GOBYB 8197 (reverse) 5′-ATT ATT AGG GCG TGG TCG TGG-3′ (Thacker, 2003) and COI fish universal primers, FF2d (forward) 5′-TTC TCC ACC AAC CAC AAR GAY ATY GG- 3′ and FF1d (reverse) 5′-CAC CTC AGG GTG TCC GAA RAA YCA RAA-3′ (Ivanova et al., 2007). Each polymerase chain reaction (PCR) amplification was carried out in a 50 μL reaction volume composed of ~75 ng DNA extract, 0.25 mM of each deoxynucleotide, 0.25 mM of each forward and reverse primer, 3 mM MgCl2, 1×PCR buffer, and 0.25 units of Taq DNA polymerase (Solgent, Daejeon, Korea). GenePro (BIOER) was used to amplify the COI with the following program: 94℃ for 10 min, 35 cycles of 30 s at 94℃, 30 s at 54℃ (for GOBYF7558-GOBYB8197) and 52℃ (for FF2d- FF1d), 30 s at 72℃ and final elongation at 72℃ for 10 min. PCR products were loaded on 1% agarose gels containing 0.003% ethidium bromide and visualized using the GelDoc- It TM Imaging System (UVP). Amplifications were considered successful when a expected sized band was observed on the agarose gel. PCR products were cleaned using a PCR purification kit (Solgent). The COI was sequenced directly using the BigDye-Terminator V3.1 kit (Applied Biosystems, Foster City, CA, USA) and an ABI3730XL sequencer at Genotech (Daejeon, Korea).
Complementary DNA sequences were assembled using the Bioedit 5.0.9 sequence-editing software (Hall, 1999). Sequences were aligned using Clustal X 2.0 default settings (Larkin et al., 2007). Alignments were translated to amino acids under the vertebrate mitochondrial option using MEGA 5 (Tamura et al., 2011) to detect frameshift mutations and premature stop codons, which may indicate the presence of pseudogenes. The Genbank accession numbers of newly determined sequences were JX679021-JX679066 and are listed in Table 1. Genetic distances were calculated to quantify sequence divergences among species using both p distance and Kimura two-parameter (K2P) models (1,000 bootstrapping) (Kimura, 1980), as implemented in MEGA. Rates of synonymous and nonsynonymous substitutions were also calculated with MEGA using both standard and modified (at 1.4 standard errors with 1,000 bootstrapping samples) Nei- Gojobori models (Nei and Gojobori, 1986; Nei and Kumar, 2000). Genetic distances were calculated at intrageneric, intrasubfamilial, intrafamilial, and interfamilial levels. Altogether, 10,296 pairwise distances were compared in this study. The degree of sequence conservation per site,
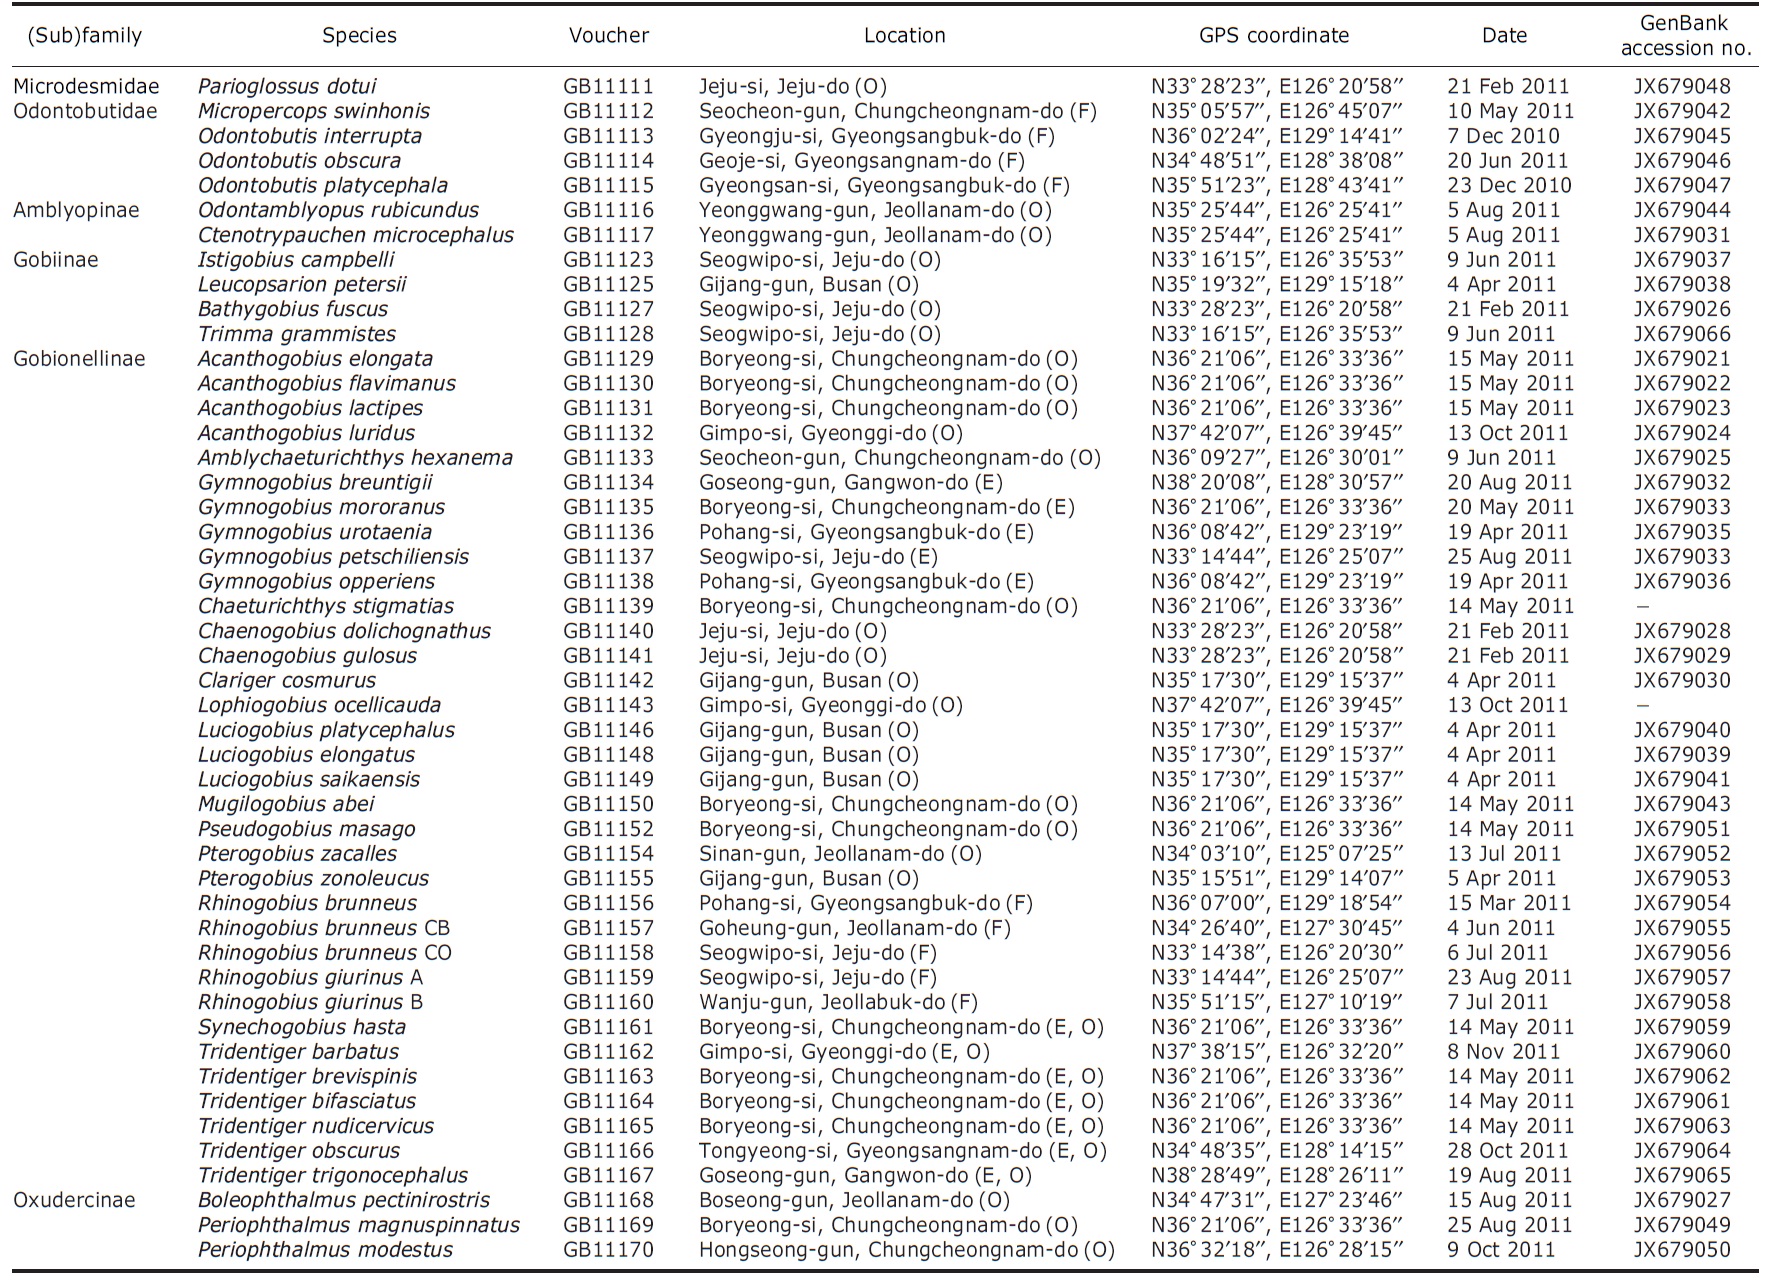
Details of gobioid fish species analyzed; data comprised of species name, voucher number, locality, GPS coordinate, collection date, and GenBank accession number; F, E and O in bracket on each location indicates habitat information such as freshwater, estuary and ocean, respectively
[Table 2.] List of reference species used in this study

List of reference species used in this study
Continued
where
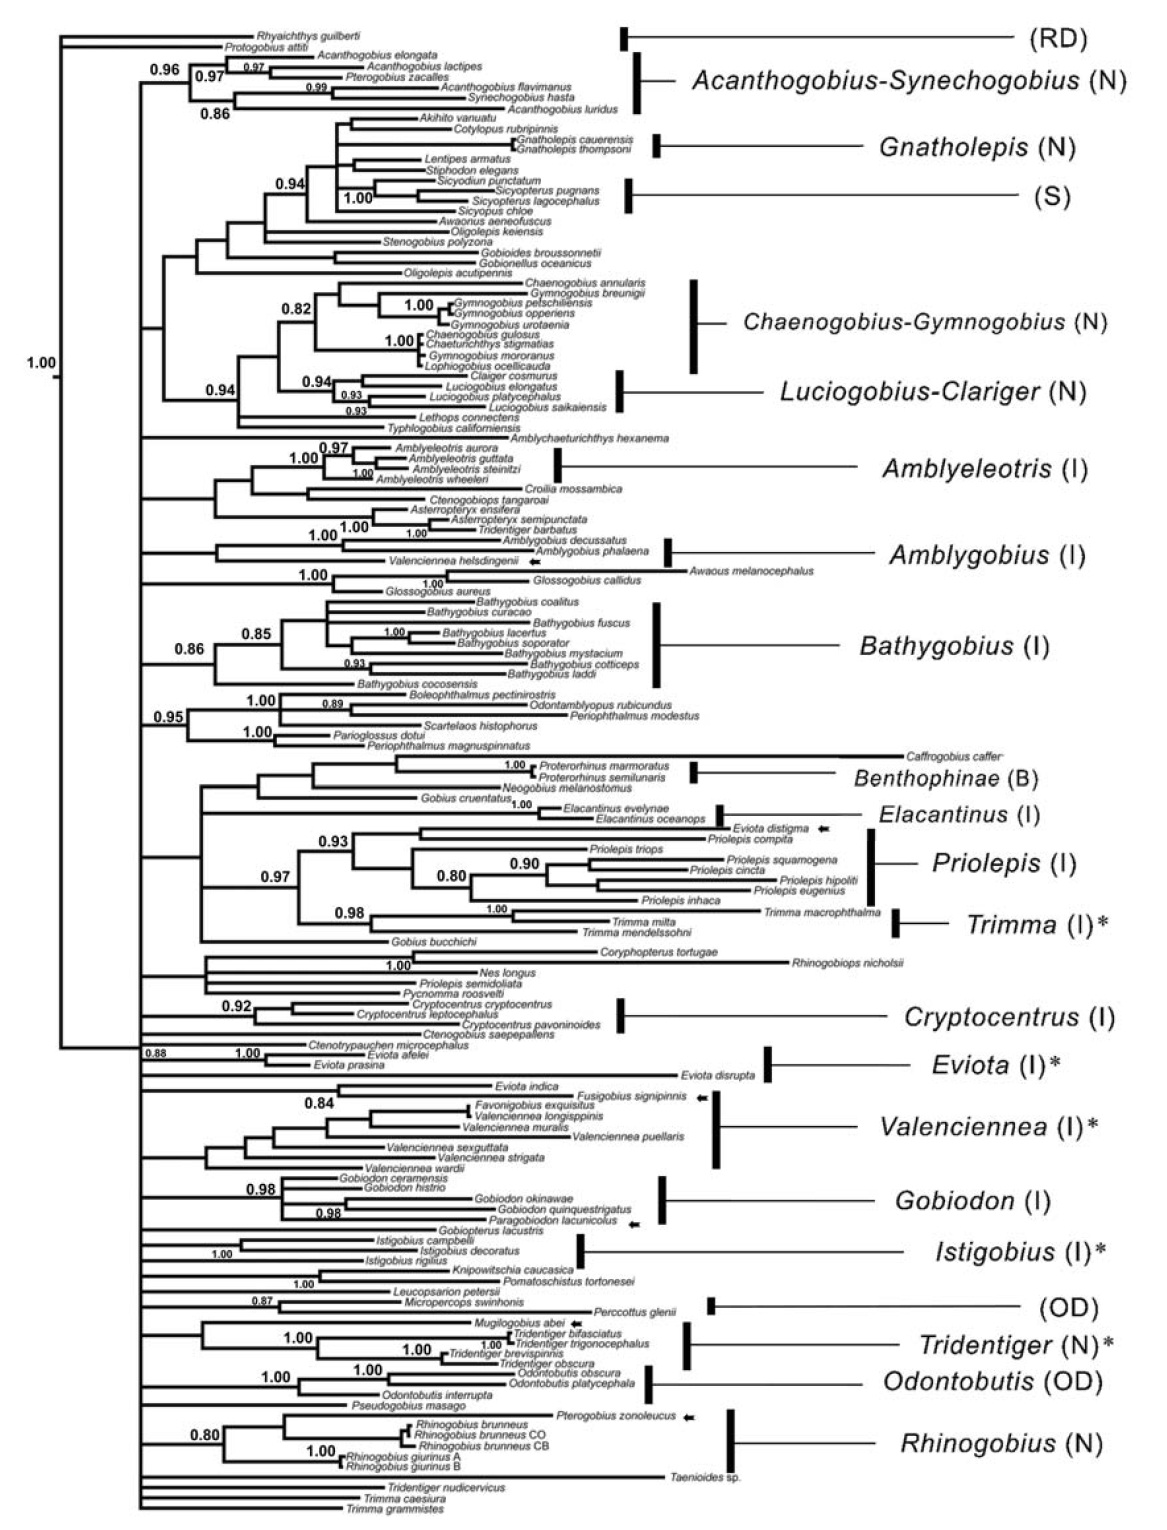
A Bayesian inference (BI) tree was established using MrBayes 3.1.2 (Ronquist and Huelsenbeck, 2003) with two outgroup species from the Family Rhyacichthydae,
The COI genes of each species were confidently aligned, and the equivocal bases at each end were trimmed to yield a final sequence of 542 bp. No indels were detected. Translation of the sequences did not reveal frame-shift mutations or premature stop codons, confirming that our amplified fragments were functional. Among the 542 nucleotide positions, 245 were polymorphic, and 230 were parsimony informative. The proportion of T, C, A, and G bases for all 144 sequences was 30.5%, 28.1%, 23.1%, and 18.2%, respectively. The GC content was relatively higher at the first codon base (56.3%) than that at the second (43.1%) or third (39.6%). The degree of conservation (

Estimated evolutionary parameters (×100) for the nucleotide substitutions in the cytochrome oxidase c subunit 1 (COI) barcoding region from 144 gobioid fish species
of the 144 species were the same. Every third codon base was highly variable with a 0.64 mean
Three species could not be separated using the COI sequence analysis, including
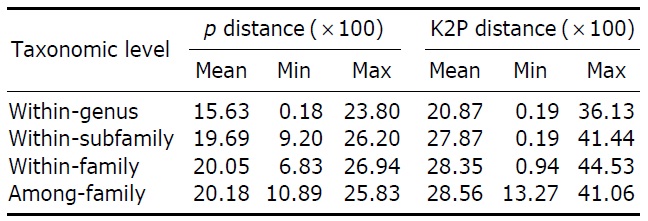
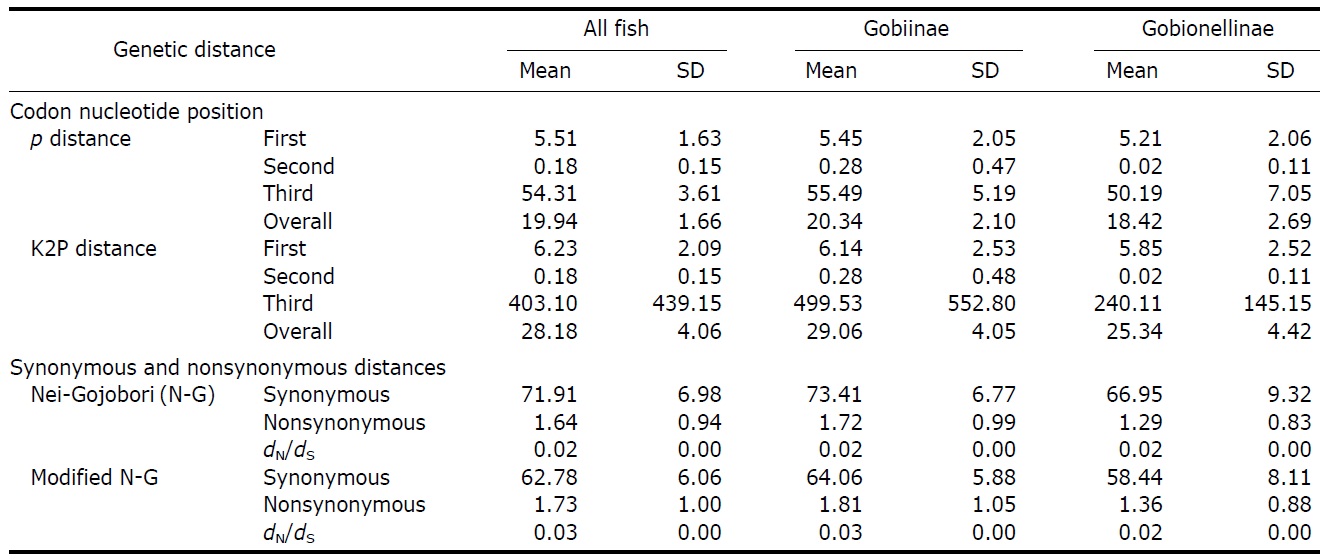
Mean genetic divergences for the cytochrome oxidase c subunit 1 (COI) nucleotide sequences (p and Kimura-2-parameter [K2P] distances) among 144 gobioid species
10.74%, respectively). Mean interspecific divergences at higher taxonomic levels were slightly larger than that at the intragenus level, resulting in large overlaps among levels (Table 4). As roughly 90% of all gobiid fishes are either in Gobiinae or Gobionellinae, these two subfamilies were compared for nucleotide substitution rate (Table 3). Species from Gobiinae were consistently higher than Gobionelline fishes in every parameter estimated (Table 3).
Our phylogenetic data provide little evidence to support the previous claims at the generic and higher taxonomic levels, based on phenetic analyses. Several species did not cluster into their respective groups, and the BI tree failed to correctly identify some genera or subfamilies (Fig. 1). For example,
The COI sequences did resolve genealogical relationships well at the level of genera and family in Gobioidei. As previously noted in Che et al. (2012), this was possibly due to at least two factors. Most likely, the 542 nucleotides do not provide sufficient phylogenetically informative characters to recover the true phylogeny when examining hundreds of taxa with enormous diversity. In addition, the fast mutation rate and saturation in the third codon position can be a disadvantage at deeper phylogenetic levels, and the subsequent long terminal branches may impede resolution of ancient speciation due to the chance accumulation of shared character states (Huelsenbeck, 1997). Despite the poor monophyletic resolution in several taxa, some clear phylogenetic signatures were observed in the COI sequence data. For example, several major congeneric species,
Our results support the validity of COI barcoding for species identification in gobiid species, although no attempt was made to include numerous specimens for any one species. One fundamental barcoding criterion is that congeneric divergence should be significantly higher than that of conspecific divergence (Hubert et al., 2008). The average intragenus distance (K2P) for 28 genera with multiple species in the present study was 21.09%, which was considerably higher than the values obtained among fish species in previous studies (9.93% from Ward et al., 2005; 9.54% from Ward and Holmes, 2007). In addition, the interspecific divergence at higher taxonomic levels was not significantly larger than that at the intragenus level, suggesting that congeneric gobies possess substantial interspecific sequence divergence in their COI genes. Significantly more nucleotide changes were observed at the third codon position than those at the first and the second, revealing that the extensive variation shown among the COI sequences typically reflects synonymous changes and little variation at the protein level. Consequently, the proportion of nonsynonymous to synonymous changes was far less than one (Table 2). As previously noted in Ward and Holmes (2007), this result must be due to exceptionally strong purifying selection of the COI gene and confirms that the ability of COI to identify species in Gobiidae is dependent on the degenerate nature of the genetic code.
We did not provide sufficient evidence for the utility of the COI towards cryptic species identification in several species complexes. Gobiidae taxonomy has been studied extensively for the last several decades, but confusion still exists. One typical case is the taxonomic status of the Gymnogobius species complex (


![Mean genetic divergences for the cytochrome oxidase c subunit 1 (COI) nucleotide sequences (p and Kimura-2-parameter [K2P] distances) among 144 gobioid species](http://oak.go.kr/repository/journal/11741/DMBRBT_2012_v28n4_269_t004.jpg)