The demographic changes lead to a continuous growth in the percentage of older people in today’s societies [1, 2]. On the one hand, such people explicitly desire to live independently in their own homes as long as possible. On the other hand, they have special needs due to decreasing mental and physical capabilities, such as declining strength, first mild cognitive impairment (MCI), visual or hearing impairments [3-6]. Nowadays, it is commonly accepted that the resulting problems of our care systems will not be solvable without the support of technology [7]. Examples for such assistive technologies range from reminder sys-tems [8], medical assistance and tele-healthcare systems [9], personal emergency response systems, social robot-ics and safe human robot collaboration [10], to human-computer interfaces for older persons or people with spe-cial needs [8].
Assistive technology usually incorporates application dependent sensors, such as vital sensors, cameras or microphones. Recently, mobile devices have gained inter-est in the research community due to the availability of various sensors and communication interfaces. However, recent studies have shown that people prefer non-obtru-sive sensors, such as microphones, over camera surveil-lance. Microphones can be easily integrated into the existing living environments in combination with appro-priate signal processing strategies [6, 11-13]. It is advan-tageous to construct an ambient monitoring system that is able to support older persons without being noticed by the end-user. This excludes the use of wearable technol-ogy, such as smart-phones or bracelets.
We focus on the development of an acoustic monitor-ing system for social care applications. In nursing homes, possibly dangerous situations will be automatically detected by such systems [14-17]. In contrast to the currently available systems - which detect only an increased acous-tic sound level, and using this, will trigger alarms e.g., in case of a thunder, the proposed system analyzes the sig-nal and the context to lead to a more accurate detection of possibly dangerous situations.
Besides the ambient character of microphones in mon-itoring applications, they can also be used for the user interaction with technical systems. According to [8, 18], if the recognition rate is sufficiently high then, the inter-action via speech or sound is natural and convenient. This kind of interaction is also preferred by older users as it was shown in recent studies [12]. A basic example is to turn on lights to enlighten a pathway for the physically impaired by just a clap of hands. With an increased com-putational power and deeper integration of sensors and electronic devices also more complex tasks such as giv-ing speech commands to a technical systems, e.g., in smart homes to switch on lights, open doors or to control multimedia devices, as well as system adaptability based on the context recognition and individual user prefer-ences becomes possible.
The remainder of this contribution is organized as fol-lows: Section II gives an overview of the proposed system; Section III describes the incorporated signal processing strategies, i.e., signal pre-processing and analysis to obtain a robust audio signal representation, the acoustic event detection and classification stage as well as an acoustic localization and tracking of users. Together with a descrip-tion of experiments the system is evaluated and its perfor-mance is discussed in Section IV and Section V concludes the paper.
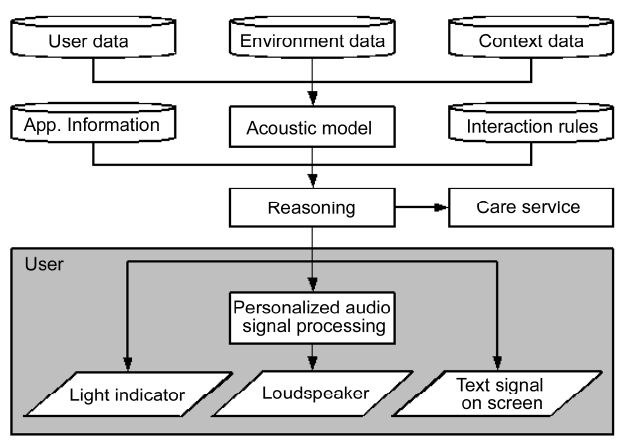
The system architecture adapted from [11] uses acous-tic input and output for situation analysis and interaction with the user and it is schematically shown in Fig. 1. In general, the proposed system is built on a modular struc-ture of models and signal processing strategies to serve for acoustic monitoring, emergency detection and classi-fication and for appropriate user interaction. The system utilizes various sources of information that are either gathered before hand or they are automatically estimated during system operation. This includes the information about the acoustic environment, e.g., the position of the user, reverberation times and the damping of walls and ceilings, information about the current acoustic context, e.g. the presence and kind of noise sources, as well as the information on the individual user himself. Especially the latter is of high importance for the adjustment of the sys-tem’s functionality according to the individual needs and demands of the user. Firstly, this is true for the monitor-ing use-case, where most of the responsibility lies on the formal care givers and secondly, for an assistance use-case, where for instance the personal audiogram of the user can be utilized to account for the individual hearing loss during human-machine interaction and cooperation [6].
The more information about the user, the environment and the context is available, the more accurate the acous-tic model becomes and the better the system supports the
user as well as the formal care givers. The acoustic model also yields the signal processing methods for audio pre-processing, acoustic event detection and classification, acoustic localization and tracking. They will be described in detail in the subsequent sections.
Then, a reasoning model is constructed relying on inter-action rules that have been defined in close cooperation with the user as well as additional information about the desired application and use-case. This model is the core element in the system architecture. It has several input and output modalities to interact with the user or care institutions and it interprets the data according to the desired use-case. A suitable reasoning model for short-and long-term monitoring of the health status of a person and emergency detection was proposed in [16]. The detected events were treated as instantaneous mid-level representations of context under the assumption that sin-gle events do not sufficiently describe a certain situation. By taking temporal aspects and repetitions of events into account, i.e. by defining short- and long-term models for event propagation and by deriving suitable application-dependent parameters, high-level contextual information became accessible. Thus it allows for a more accurate interpretation of the situation. Due to the modular struc-ture of the reasoning model, an adaption to other applica-tions and use-cases is also possible.
The prediction of the reasoning model (e.g., the deci-sion if an emergency occurred) is then transferred to the care institution or the nurses’ room (e.g., as an emer-gency call) or to the users via an output controller. This controller manages the actual presentation of information to the user if the user lives in his/her own flat. Depending on the expected quality of the acoustic communication, the output controller initializes the information presenta-tion in an acoustic way or by means of other modalities if the potential acoustic presentation is not suitable for the user in the given context. In this case, text messages on a screen or ambient light can be chosen for human-com-puter interaction.
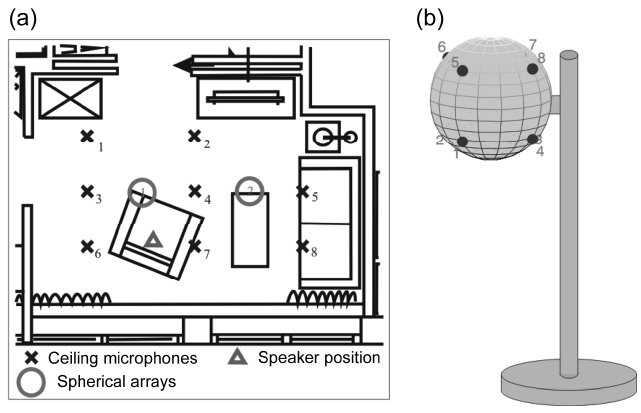
For the evaluation of the signal processing strategies described in the following an apartment was equipped with several ambient microphones in the ceiling and two spherical arrays inside a floor lamp as depicted in Fig. 2. Fig. 2a shows the positions of the ceiling microphones (crosses), of the spherical arrays (circles) as well as the position of the user (triangle). Fig. 2b shows a schematic of the 8-channel spherical microphone array built inside a floor lamp. Both the microphone arrays were used for the signal enhancement as well as position estimation of acoustic sources for the purpose of acoustic monitoring.
Humans have an astonishing ability to detect the posi-tion as well as the meaning of an acoustic source, partly relying on the information of their two ears. Therefore, the technical position detection of acoustic sources [19, 20], also relies on spatial information obtained from mul-tiple microphones. Thus, the following subsections will present the acoustic signal processing strategies that are needed for the estimation of the position and meaning of an acoustic event for the determination of the acoustic context. The first step (cf. Section III-A) is an audio seg-mentation process which determines the parts of the sig-nal that contain speech or other acoustic events. In the next step irrelevant background noise which is always present in real-world recordings is removed from the sig-nal (cf. Section III-B). Then the signal is processed by the event detection and classification unit (cf. Section III-C and Section III-D). It determines which events are present in the signal and if a possibly dangerous situation may have occurred and whether an alarm should be raised or not. The position of the event is determined in parallel by multi-microphone position estimation and tracking system (cf. Section III-E) which serves as the context information for the detection and classification unit. Furthermore, multiple microphones allow multi-channel noise reduction schemes [21] and they are used for the separation of acoustic events from the background noise in Section III-B.
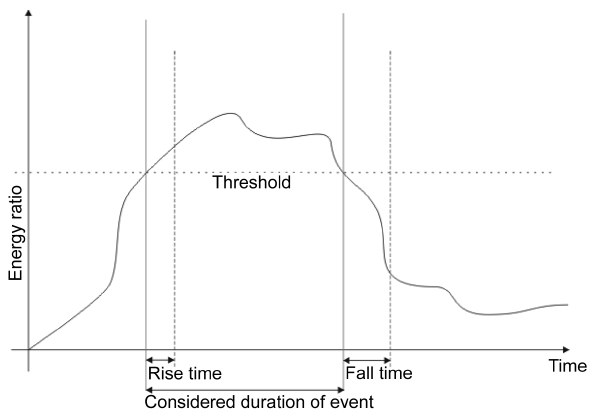
For high-performance event monitoring applications, accurate signal segmentation mechanisms are of high importance. By this, the system is enabled to distinguish between the events of interest and all other acoustic signals such as, separation of speech utterances from non-speech in the acoustic stream. These methods determine the temporal location of events of interest (acoustic foreground) in a continuous audio stream and thereby, reduce the computational overhead in the later processing stages. They also provide information about the acoustic background and this is considered to be one of the strongest sources of errors in real life monitoring applications. In order to reliably distinguish between the foreground and background acoustic objects, several methods, known as voice activity detection (VAD) algorithms have been proposed. The suitability of VAD algorithms, assume an acoustic signal to consist of solely speech and noise, for monitoring applications was evaluated in [16] using real office and living-room recordings. Following the findings that were presented, we use the long-term spectral divergence VAD method proposed by Ramirez et al. [22] in our system to obtain the labels for event presence and background noise. Then, this information can be used to initialize and trigger later processing stages as it will be described in the following subsections.
Depending on the application scenario, ethical and privacy issues may have to be considered as well. Therefore, the speech activity detection (SAD) methods can be used for audio signal segmentation [23]. In contrast to VAD algorithms, SADs contain a specific model for speech, thus they allow reliable identification of privacy related speech content in a continuous audio signal. On one hand, SADs may lead to a further increased end-user acceptance of monitoring applications due to privacy protection functionality when they are utilized in a complex system. On the other hand, for health and security related monitoring applications, SADs may corrupt the performance of the event detection and classification methods, since valuable, emergency indicating speech information (keywords, crying and shouts for help) from speech segments can not be identified any more.
>
B. Acoustic Foreground-Background Separation
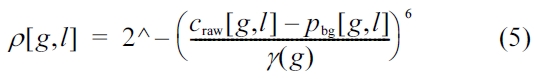
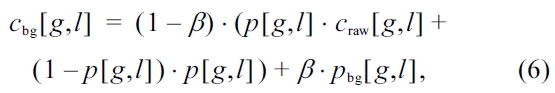
The output of a microphone is an amplitude-time sig-nal. Usually, this signal is corrupted by the background noise if recorded in real environments. This noise is a dis-turbance for the classifier and it usually decreases the classification performances of state-of-the-art classifiers, e.g. using features like Mel-frequency cepstral coeffi-cients (MFCCs). In contrast, humans are less sensitive to the background noise disturbances [24]. Thus, in a pre-processing step, denoising algorithms are suggested [25]. In this paper, a foreground/background separation is applied that uses a probabilistic noise mask on the so-called coch-leogram craw[
For the separation of the foreground and background, a dynamically adapting background model

for every time frame

Where,

is a filter for smoothing over neighboring gammatone fil-ter bands. For reasons of energy conservation, it has to fulfill:
The shapes of the filters
A probabilistic mask is generated by the difference between the cochleogram craw[
Where,
Where,

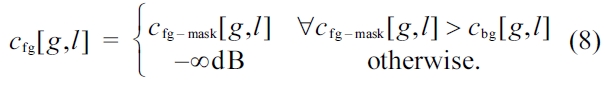
To respect the dynamic adaption of the background and to conserve the total energy, only the foreground energy that exceeds the background energy is considered:
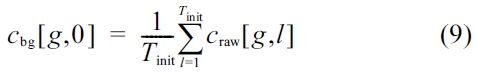
The background model has to be initialized. Hence, the first
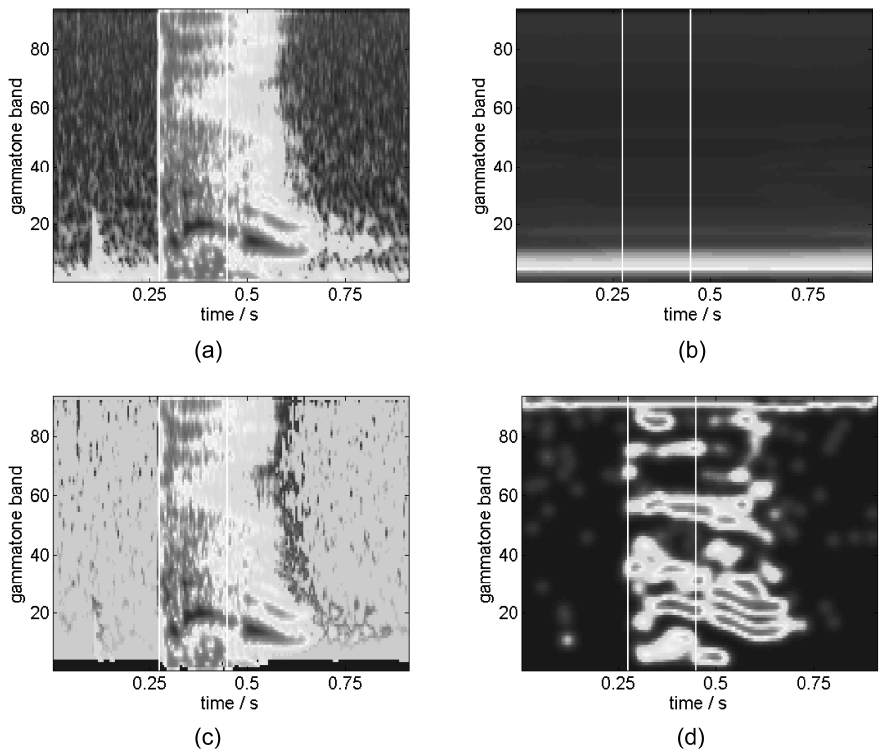
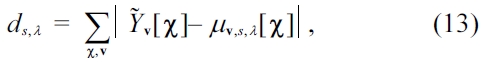
In Fig. 4a-c, the raw cochleogram, the background and the foreground of a cough are plotted. It can be clearly seen that the background noise is removed from the coch-leogram by the previously described method.
In order to extract the noise robust features, eight ori-ented edge detectors [27] are applied to a cochleogram. The eight orientations v = (
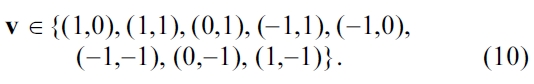
Hence, edges in 45° steps are considered. The edges are detected by the derivatives Δv in the cochleograms. Instead of using only the derivatives of adjacent spectro-temporal points like the proposed in [27], smoothed derivatives over longer spectro-temporal distances are adopted here:
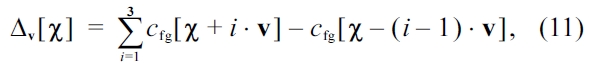
In Equation (11), χ = (
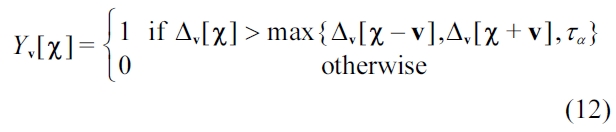
Where,

Exemplarily, this is shown for a cough in Fig. 4d.
>
D. Event Detection and Classification
The detection of an acoustic event, i.e. the awareness of an acoustic element that differs from the background noise, is accomplished by comparing the energy of the predicted foreground
In the classification state, models for acoustic events are compared to classify the objects. Prior to this, the models have to be trained on the basis of training data. For a small amount of training data, there is a risk of over-learning models. Thus, the model complexity, i.e. the number of learned parameters, has to be kept small.Hence, an approach that can be regarded as a 1-nearest-neighbor algorithm [28] is proposed. For distance measure between a cochleogram
Where, each class

and
The class membership
is estimated by finding out the centroid with the nearest distance to it:
In order to learn centroids, k-means clustering [29] is used. Each class,
is extracted from every date and it is processed in the k-means algorithm. The k-means algorithm is initial-ized by k-means++ [30]. The cluster centers of k-means are the centroids
>
E. Localization and Tracking of Acoustic Sources
The position of the user is important information for the reasoning and recognition system. By the exploitation of the position information it is possible, e.g., to switch on the appropriate lamp or to open the proper door by voice or sound commands, i.e. the lamp or door closest to the user. Furthermore, the position information is also highly desired if the activities of daily living (ADL) of the user should be automatically evaluated.
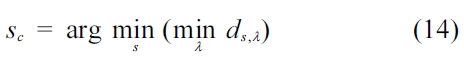
Acoustic position estimation is usually done by, firstly estimating the direction of arrival (DOA) of an incoming sound for several microphone pairs and secondly by com-bining the different DOA estimates of several microphone pairs to obtain a two-dimensional or three-dimensional position, e.g. by means of triangulation. For an overview of different DOA estimation algorithms the reader is referred to [20, 31]. For this contribution we calculate a manipulated general cross-correlation (GCC) of the micro-phone pairs. A spectral whitening of the input spectra is achieved by the so called phase-transform (GCC-PHAT). Regarding the characteristic of a delta-impulse one attempts to emphasize the displacement of the DOA encoding sig-nal peak in the GCC by the phase-transform. This approach was first mentioned by Knapp and Carter [19]. The GCC-PHAT cross correlation is calculated by,

Where,

is the GCC-PHAT,

is the phase-transformed cross power spectral density (CPSD) between the microphones,
in Equation (16) the phase-transform is included by the denominator
With the determina-tion of the relevant peak position in GCC-PHAT one can calculate the DOA
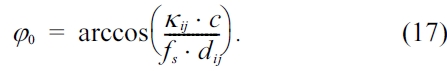
In Equation (17),
If the system provides personalized assistance in the
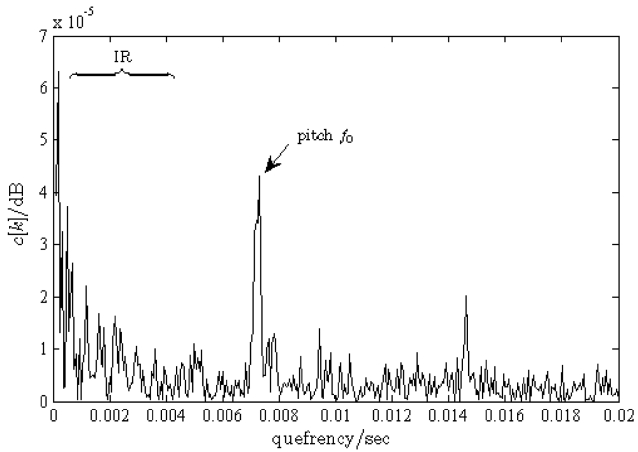
multiuser case then, a speaker separation is required to distinguish between the residents (e.g., male/female). The fundamental frequency (pitch) of the human voice is an important property in the human speech production to distinguish between speakers, i.e. female speakers usu-ally have
In order to emphasize the pitch as a distinct peak from the disturbed input signal we use a cepstrum transforma-tion [33]. Hence, the logarithm of the absolute value of the spectrum x[

In Equation (18), CEP[
This section presents the experimental evaluation of the proposed monitoring system. The experimental setup for the detection and classification of the acoustic events is described in Section IV-A and the results for an acous-tic localization and tracking are shown in Section IV-B.
A database of different sounds was recorded by using a cardioid microphone with some distance from the acous-tic sources. The database consisted of four classes: (hands) clapping, coughing, knocking, and phone ring-ing. For clapping, coughing and knocking, seven persons were asked to generate these events separated and in silence. Knocking was done on a wooden table either by using a flat hand, fist or knuckles. This decision was left to the participant. For each of these classes, 54 events were collected, where the contribution of each person dif-fered. For phone ringing, a phone with an old fashioned ring tone was recorded nine times. Each class was sepa-rated into nine equally sized subsets to enable a nine-fold cross validation [29] and this was performed for evalua-tion. Three types of features were used for training and classification. It will be evaluated in the following: 1) we used the pure foreground cochleogram as described in Section III-B, 2) the smoothed edge features as described in Section III-C, and 3) standard 39-dimensional MFCCs. The window length of the MFCCs was 25 ms using 10 ms hop-time. The 0th coefficient and the derivatives of the first and second order (Δ and ΔΔ) were included to form 39-dimensional feature vectors per frame. In order to compare the results with the standard classifiers, also a Gaussian mixture model (GMM) [28, 29] using MFCC features is tested. Here, in contrast to the mentioned k-means classifier, each frame is processed separately as a feature vector. The likelihood for an event is the multipli-cation of the likelihoods of each frame of an event. Only the classification stage is evaluated without the investigation of the detection accuracy.
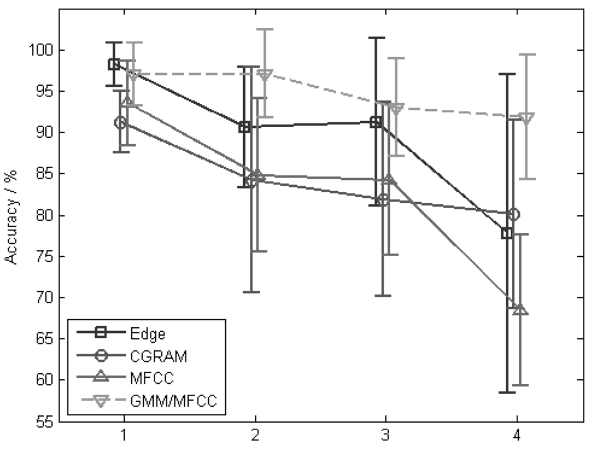
The results of the feature/classifier combinations are
shown in Fig. 7. The mean accuracies and standard devia-tions of the nine trials of the cross validation are plotted over a number of centroids/mixture components Λ (Λ
tures outperform the others. Even the GMM/MFCC com-bination is worth, but it is only 1%. Moreover, it is insignificant for this small database. The performance of other k-means classified features lie more than 5% under the edge based k-means classifier. In summary, Fig. 7 shows that a recognition rate of >90% can be achieved by GMM based approaches and for Λ < 4 which also uses the computationally extremely simple Edge feature. Thus, a classification of everyday acoustic events is pos-sible even under realistic acoustic conditions.
>
B. Localization and Tracking
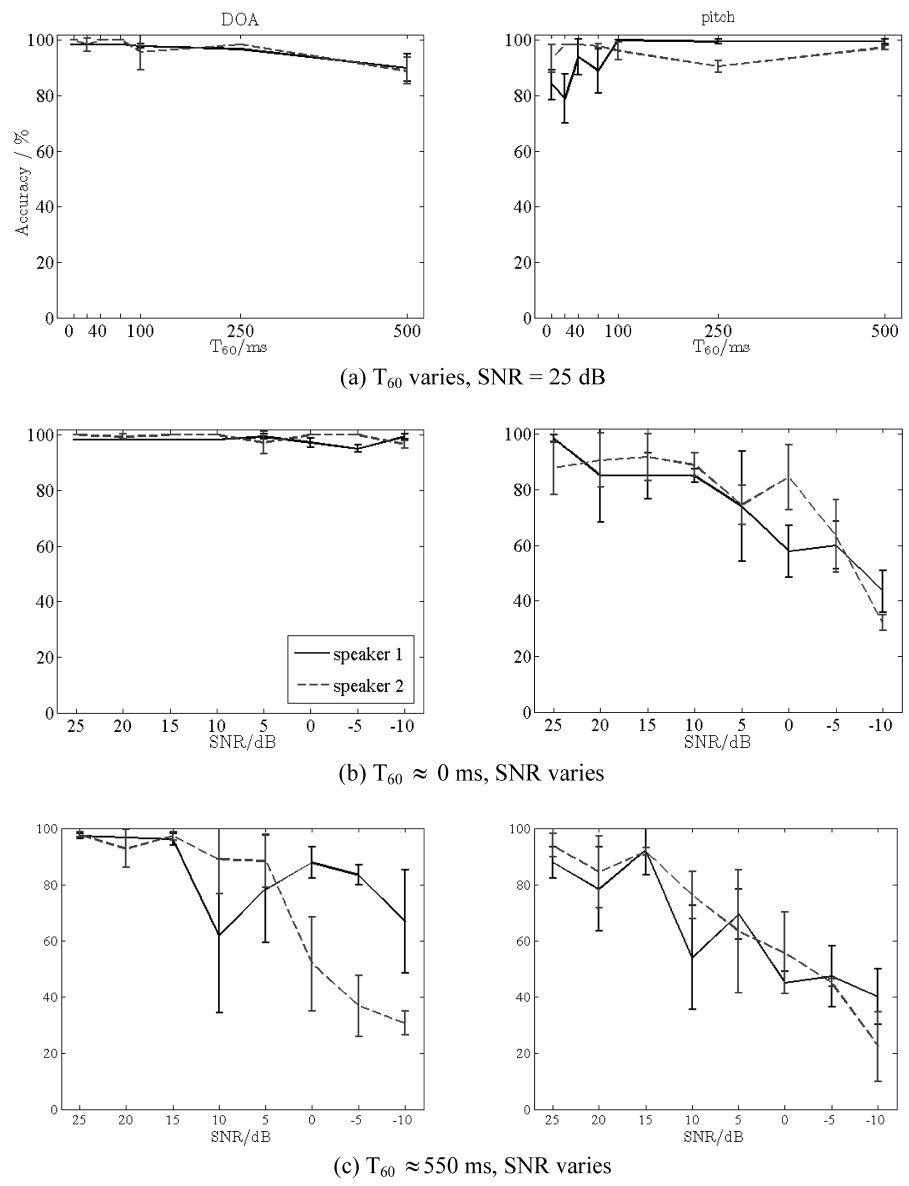
For the evaluation of the localization sub-system, a combined pitch and DOA estimation algorithm is used based on a harmonic sieve filtering of the CPSD that includes the concept of the cepstrum and GCC-PHAT calculation [36]. Recently, the improvements to this com-bined algorithm were proposed [37]. The setup was cho-sen to correspond to the room that is depicted in Fig. 2. Eight signal to noise ratios (SNRs) that ranges from 25 dB to -10 dB and eight reverberation times that ranges from 0 ms (no reverberation) to 500 ms (corresponding to common office environment) were simulated. An SNR of 25 dB implies that there was hardly any noise that was perceived by human listeners and at an SNR of -10 dB hardly any signal can be perceived (e.g. as in a quickly driving car). Furthermore, real reverberation measure-ments where used for additional evaluations. SNR is adjusted by additional spectrally speech shaped, diffuse noise that is uncorrelated to the desired signal. A six channel line array with 22 cm distance between each microphone was adopted. As a valuation standard the accuracy rate of all the estimations was calculated, toler-ating a deviation of 10° and 10 Hz, respectively, i.e. if the direction estimate was within a tolerance of ±10 degrees and the pitch estimate to distinguish between the speakers was within a tolerance of ±10 Hz then, the estimate was considered to be correct.
Two concurrent speakers (male/female) were present and they had to be tracked.
In Fig. 8 the results for different scenarios are depicted. Fig. 8a show the accuracy rates for the different reverber-ation times T60 for a clean speech. The results are quite good without any exception for any room reverberation time and for both speakers as well for the direction esti-mate (left panels) as for the pitch estimate (right panels). Results for a scenario with varying SNR but without reverberation are shown in Fig. 8b. Especially the pitch estimation declines with lower SNR down to 40% for -10 dB SNR. However, it should be noted that common SNR which is to be expected in a household or a care environ-ment is >10 dB. Fig. 8c again shows the results for the different SNR values. This time, real measured room impulse responses (RIRs) with reverberation of about T60 ? 550 ms instead of simulated ones are used. These data show a particular impact to the DOA estimation when compared to the Fig. 8b. The results show that the reliable results can be expected even under moderately high reverberation up to the noise levels of 5-10 dB SNR (~70% accuracy) which is sufficient for the envisaged household and care scenarios.
An acoustic monitoring system for an ambient assisted living scenario includes technologies that are to determine the user’s activity by means of an acoustic event detec-tion and classification. Localization of the user was also described in this contribution. The system combined strate-gies for signal segmentation, background noise reduction, event detection and classification as well as acoustic source position estimation and tracking to lead to a prac-tically applicable overall system. The system was evalu-ated under acoustically realistic conditions including disturbances such as ambient noise and reverberation. It was shown that as well the position of the user as contex-tual information for the emergency monitoring system as well as acoustic events can be reliably detected.


![Outputs of preprocessing and feature extraction stages of a human cough. (a) A raw cochleogram craw. (b) A background model cbg. (c) A foreground model cfg. (d) A feature model Yv[χ] for v = (-1 0) (horizontal step) includes Gaussian spreading of edges. All panels show energy of gammatone bands over time. The first 180 ms used for the subsequent classification step are marked by white vertical lines.](http://oak.go.kr/repository/journal/11649/E1EIKI_2012_v6n1_40_f004.jpg)