Organics in wastewater are usually removed by an activated sludge process. This is a standard conventional wastewater treat-ment technology. Nutrients including nitrogen and phosphorus are also required to be removed from the effluent of wastewater treatment plants [1, 2]. Generally, at high levels of concentration these nutrients cause eutrophication and toxic effects to the wa-ter environment. So as a result, removal of these nutrients from wastewater is often the primary objective in wastewater treat-ment around the world [3-6].
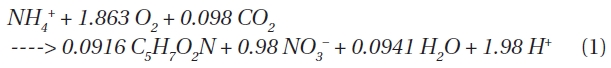
One of the most economical and effective processes for ni-trogen removal at wastewater treatment plants is the introduc-tion of biological nitrification with a subsequent denitrification process [7]. Microbial nitrogen removal involves aerobic nitrifi-cation, oxidizing NH4+-N to NO3?-N, followed by anoxic denitri-fication, which reduces NO3?-N to gaseous nitrogen. During the nitrification process, the oxidation of NH4+-N to NO3?-N is con-ducted by various bacteria groups. Two different bacteria groups were earlier recognized namely:
Recent studies on advanced treatment technologies have fo-cused on the development of economical and effective methods for nitrogen removal. They focus especially on heterotrophic denitrification, such as simultaneous partial nitrification and denitrification or simultaneous nitrification-denitrification in a membrane system for shortcut nitrification-denitrification [9-11]. However, these denitrification systems are challenging to operate due to the required complex reaction conditions. Moreover, construction of such systems is generally expensive for commercial applications. Therefore, these technologies will not be widely adopted unless more incentives are introduced to compensate for these weaknesses.
Immobilization can retain bacteria for an extended time in a continuous flow. Thus, the utilization of a fixed biofilm can en-hance the reduction of the nitrifying bacteria loss due to wash away [12, 13]. Attached growth in a fixed biofilm is a more fa-vored method for wastewater treatment than the usage of a suspended growth process. Biofilms have a buffering capacity to prevent shock loading due to a high density of bacteria and produce small amounts of residual sludge [14].
The rate of ammonia oxidation is strongly influenced by the nature of the nitrifying cultures. It is also influenced by a vari-ety of environmental factors, including substrate concentration, temperature, dissolved oxygen, and pH [15]. Attached growth in a fixed biofilm provides some protection against temperature or toxic shock [16, 17]. Generally, porous ceramic media have high porosity ratio, superior durability, high specific surface area, and abundance for attachment of microorganisms. Compared to non-porous media [18], porous media used is better for organic removal. One of the most significant parameters for attached slow-growing autotrophic bacteria can be the selection of the supporting media because the characteristics of the supporting media for biofilms can significantly influence reactor perfor-mance [19].
Heterotrophic bacteria denitrify using NO3?-N as electron ac-ceptor with the addition of organics as external carbon sources. But, autotrophic bacteria requires inorganics in the denitrifi-cation process instead of organics, as external carbon sources [20, 21]. Thus, when a low carbon-to-nitrogen (C/N) ratio is favorable, autotrophic denitrification can occur. Conventional ceramic media are typically prepared from clay obtained from soil. Specific chemical compounds can also be included as an electron donor to produce new supporting media, such as sulfur ceramic media, for autotrophic denitrification.
In this study, experiments were carried out in a continuous flow packed-bed reactor (CPBR) to 1) evaluate the nitrification efficiency with respect to alkalinity consumption; 2) compare the effectiveness of denitrification between heterotrophic and autotrophic reaction; and 3) test the feasible porous sulfur ce-ramic media.
2.1. Process and Instrumentation for CPBR System
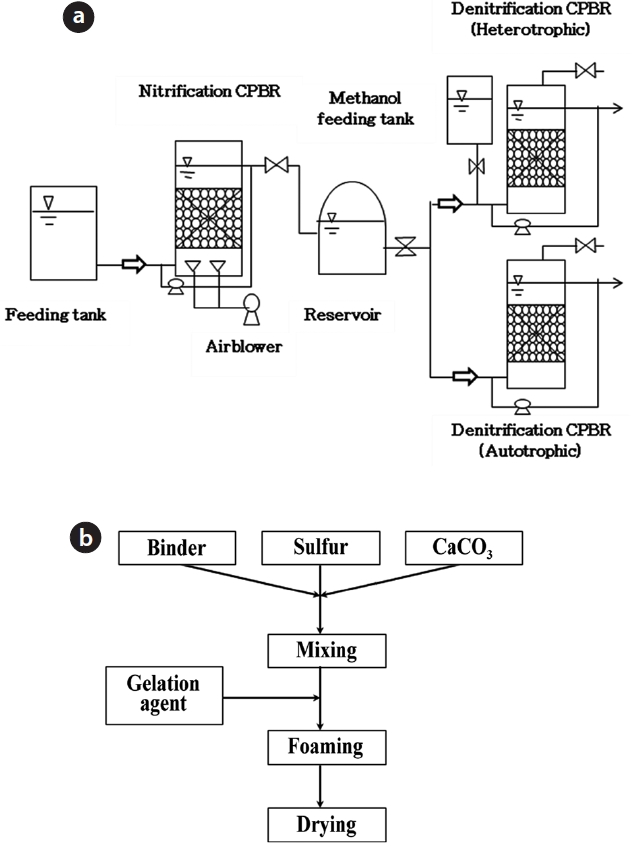
In this study, three packed-bed reactors were used to com-pare the nitrogen removal efficiencies of biofilms attached to porous ceramic media. A schematic diagram of CPBR system is shown in Fig. 1(a). These packed-bed reactors were designed to evaluate the nitrogen removal efficiencies using porous ceramic media. The CPBR system consisted of consecutive nitrification and denitrification processes (heterotrophic and autotrophic conditions). The working volumes of each CPBR for nitrification (110 mm
In this study, all CPBRs are packed with porous ceramic me-dia (60% v/v) as a support for biofilm growth. They were fed con-tinuously in the up-flow mode with by using peristaltic pumps. The ceramic media used in this experiment composed of clay. It contained an abundance of small pores. These pores provide sufficient surface area for a physically stable environment for microorganism growth. The ceramic media packed for auto-trophic denitrification CPBR contained 35% of elemental sulfur as the electron donor. The specifications of the porous ceramic media were as follows: 8?9 mm diameter, 0.7?0.8 g/cm3 appar-ent density, 55.8% porosity, 70?100 μm pore size, 0.42 cm3/g pore volume, 0.47 m2/g surface area, 0.47?0.57 m2/m3 specific surface area, 1.0?1.2 specific gravity [22]. A simplified flow chart of man-ufacturing sulfur ceramic media is depicted in Fig. 1(b).
The synthetic wastewater was fed to the nitrification CPBR. It contained NH4Cl 157?764 mg/L, NaHCO3 335?1,344 mg/L,
NaH2PO4·2H2O 6 mg/L , MgCl2·6H2O 15 mg/L, KCl 35 mg/L. 1 mL/L of the stock trace element solution was also included in the synthetic wastewater. The stock trace element solution composed of: ZnCl2 45 mg/L , MnCl2·4H2O 450 mg/L, (NH4)6Mo7O24·4H2O 80 mg/L, Na2SeO3·5H2O 90 mg/L, and NiCl2·6H2O 45 mg/L. 50 mg of NH4+-N/L as NH4Cl of the synthetic wastewater was initially supplemented. Then, it was increased to about 200 mg of NH4+-N/L stepwise as the experiment proceeded. The composition of the synthetic wastewater was chosen from previously reported wastewater compositions [23, 24]. The influent flow rate was in the range of 21.6?30.48 L/day. The empty bed contact time(EBCT) was also in the range of 6 to 8 hr. All experiments were conducted at 20 to 28±1℃ and they were buffered at pH 7.5?8.5.
The C/N ratio for heterotrophic denitrification CPBRs was adjusted by adding 0.75 to 5.2 of methanol as an external carbon source, whenever necessary. As a result, ceramic volumetric or-ganic loading rate of 0.2?5.6 kg COD/m3 ceramic media/day was applied to determine the influence of organic load on denitrifi-cation. The influent was supplied at a flow rate of 0.86 L/hr, with an average nitrogen concentration of 87 mg NO3?-N/L, and an EBCT of 3.5 hr. The pH was adjusted to 7.5.
The autotrophic denitrification CPBR was fed with 85 mg NO3?-N/L influent. During the experiment, the EBCT was varied in the range of 4.6 to 7.6 hr. The volumetric loading rate therefore varied over the range of 0.83?1.37 kg NO3?-N/m3 ceramic me-dia/day , and the alkalinity was increased to 400 mg CaCO3/L through additions of NaHCO3, when required. The ceramic me-dia containing elemental sulfur served as an energy substrate (electron donor) as well as a physical support for
The detachment of biomass is caused by the up-flow of air bubbles and hydraulic shearing. This occurs during the 100% internal recycling process in CPBRs eliminated excess biomass without outside intervention. As a result, reactor backwashing was not necessary due to the biomass self-washing process. Many studies have reported that the accumulation of biomass depends on the packing material, void fraction, and shear forces associated with the hydraulic conditions. But, the biomass self-washing process was mainly dependent on the size of the pack-ing material [25-27].
2.3. Inoculation of Biomass for Start-up and Enrichment of Thiobacillus denitrificans
The seed sludge mixture consisting of initial biomass con-centrations (mixed liquor suspended solids, MLSS) of 5,800 mg MLSS/L and sludge volume index (SVI), 75 mL/g was obtained from the Gulpocheon Advanced Sewage Treatment Plant in Gyeonggi-do, Korea. The nitrification CPBR packed with po-rous ceramic media was inoculated with concentrated activated sludge. The new seed sludge contains initial biomass concentra-tions of 6,350 mg MLSS/L and 89 mL/g SVI was also added to supply the washed-out sludge in the reactor. Cultures of
Biochemical oxygen demand (BOD), chemical oxygen de-mand (COD), NH4+-N, and total Kjeldahl nitrogen (TKN) were determined in accordance with the Standard Methods, USA [28]. The ionic concentrations of nitrite (NO2?) and nitrate (NO3?) were determined by ionic chromatography using a DIONEX model DX 100 (Dionex, Sunnyvale, CA, USA) which is equipped with a DIONEX AS-14 (4 x 25 mm) column. The liquid samples were analyzed after filtration through a 0.45 μm glass fiber filter. Al-kalinity was measured using a spectrophotometer (DR4000; HACH, Loveland, CO, USA). The dissolved oxygen (DO) concen-tration was determined using a DO meter (YSI 58; YSI Inc., Yellow Springs, OH, USA). The pH of the solution was measured using a pH meter (Orion-3STAR, Thermo Scientific Inc., Waltham, MA, USA).
The amount of accumulated biomass was estimated by fol-lowing the total solids (TS) and the total volatile solids (TVS) measurement methods [28]. Samples of the porous ceramic me-dia were taken from the CPBR, dried at 105℃, burned at 550℃ and 1,200℃, then weighed. The VS was deduced by subtracting the difference in dry weights at 550℃ and 1,200℃ from the dif-ference in dry weights at 105℃ and 1,200℃.
3.1. Efficiency in the Nitrification CPBR
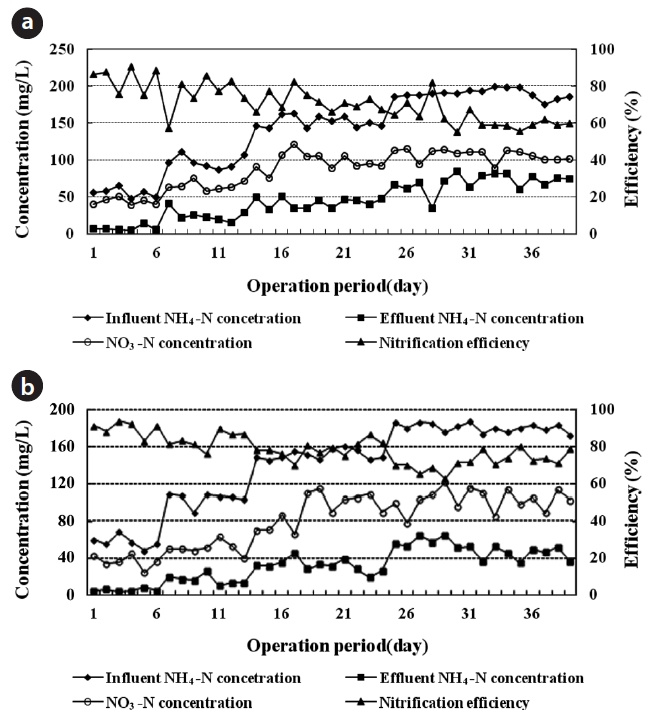
The system was monitored on a daily basis for 43 days. NH4+-N in the influent was increased stepwise from 50 to 200 mg/L, yielding a relevant ceramic volumetric nitrogen loading rate of about 0.45?2.40 kg NH4+-N/m3 ceramic media/day with an inter-nal recirculation rate of 100%. The NH4+-N loading rate was one of the factors which was affecting the nitrification rate in CPBRs. The nitrification efficiency of EBCTs of 6 and 8 hr, is shown in Figs. 2(a) and 3(b), respectively. The average biomass of 9.2 ± 1.0 gVS/m3 ceramic media was obtained in the nitrification CPBR.
At an EBCT of 6 hr, the influent NH4+-N concentration was raised stepwise from 50 to 200 mg/L. It is shown in Fig. 2(a). The nitrification efficiency was obtained to be 89?74% with the NH4+-N utilization rate of 0.08?0.16 g/g VS/day. However, the nitrifica-tion efficiency decreased to the range of 71?59% with 0.24?0.31 g NH4+-N/g VS/day. As a result, the nitrification efficiency was found to be in the range of 59?89% with the volumetric nitrogen loading rate of about 0.6?2.4 kg NH4+-N/m3 ceramic media/day, and with the NH4+-N utilization rate of around 0.08?0.31 g/g VS/day, respectively.
At an EBCT of 8 hr, the influent NH4+-N concentration was raised stepwise from 50 to 200 mg/L. It is shown in Fig. 2(b). The average nitrification efficiency was obtained to be 80.8% when the volumetric influent NH4+-N loading rate was increased step-wise from 0.45 to 1.8 kg NH4+-N/m3 ceramic media/day. How-ever, the nitrification efficiency fluctuated between 78% and 69% as the influent NH4+-N loading rate increased above 1.35 kg NH4+-N/m3 ceramic media/day, with the NH4+-N utilization rate of 0.18 g/g VS/day. As a result, the nitrification efficiency decreased from an average of 89.4% to the level of 80.8%. This occurred when the volumetric nitrogen loading rate increased stepwise from 0.45 to 1.8 kg NH4+-N/m3 ceramic media/day, with the NH4+-N utilization rate in the range 0.06?0.24 g/g VS/day.
As a result, the reduction of nitrification efficiency depended on the increase of the NH4+-N loading throughout the test pe-riod. The nitrification efficiency maintained a higher level at lon-ger EBCTs. Thereby, it has more significant effect to the micro-bial nitrification reaction rate instead of NH4+-N concentration. The nitrification rate by NH4+-N oxidized/m3 ceramic media/day decreased as the system NH4+-N concentration increased. The calculated nitrification rates were midrange with respect to the rates reported by other investigators [29, 30].
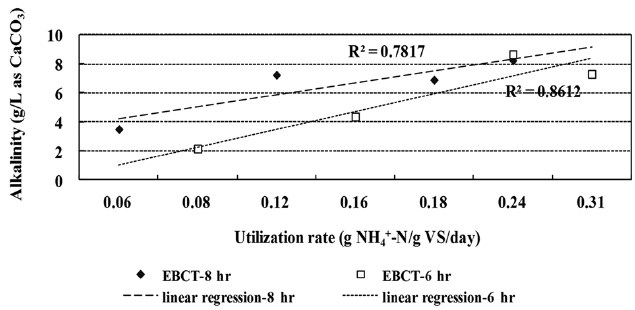
Alkalinity was consumed due to the production of acids (HNO2, HNO3) during ammonium oxidation. Alkalinity con-sumption affected both the pH and nitrification rate, but it can be remedied by increasing the available alkalinity. The relation-ship between the alkalinity consumption rate and the NH4+-N utilization rate at EBCTs of 6 and 8 hr are shown in Fig. 3. These relationships were obtained to be R
Therefore, the theoretical value for alkalinity consumption at a nitrification rate of 1.26 kg NH4+-N/m3 ceramic media/day was 8.91 kg as CaCO3/m3, but smaller quantities of alkalinity were consumed during the test period. Nitrifying bacteria grow slowly. The optimum EBCTs were 8 and 10 hr for
3.3. Heterotrophic Denitrification as a Function of the C/N Ratio
During the denitrification test period, an average of 87 mg NO3?-N/L and an EBCT of 3.5 hr were applied with varying C/N ratio. The heterotrophic denitrification rate, in terms of nitrate
loading to VS and ceramic media volume, under various C/N ra-tios, is shown in Fig. 4.
When the C/N ratio was varied from 1.1 to 2.5, the denitrifica-tion rate was found to vary from 1.0 g NO3?-N/g VS/day. This was corresponding to 0.15 kg NO3?-N/m3 ceramic media/day, to 2.20 g NO3?-N/g VS/day, corresponding to 0.56 kg NO3?-N/m3 ceramic media/day. In this range, the average calculated denitrification rate was 1.68 g NO3?-N/g VS/day, 0.32 kg NO3?-N/m3 ceramic me-dia/day , which was comparable to or higher than the previously reported denitrification rates, 0.240?0.480, 0.158, and 0.043 kg NO3?-N/m3/day, for the same carbon source [32-34]. When the C/N ratio was above 4, the average denitrification rate increased to 8.49 g NO3?-N/g VS/day, 1.33 kg NO3?-N/m3 ceramic media/day. Hamlin et al. [35] Regardless of the carbon source used (methanol, acetic acid, molasses, or hydrolyzed starch), reported a maximum daily denitrification rate for biofilms was around 0.67?0.68 kg nitrogen removed/m3 media/day. Therefore, our CPBR system showed a denitrification rate for biofilms accumu-lated on porous ceramic media that was higher by a factor of two relative to the rate reported in a previous study [35].
The denitrification rate is measured as a function of the ni-trate reduction (g NO3?-N/g VS/day and kg NO3?-N/m3 ceramic media/day). It is increased from 8.5 and 8.9 as C/N ratios were raised from 1.1 to >4, respectively. Under the maximum nitrate loading to ceramic media volume of 1.8 kg NO3?-N/m3 ceramic media/day, the highest average denitrification rate was found to be 1.33 kg NO3?-N/m3 ceramic media/day. Thus, if the C/N ratio was raised above 4, the denitrification efficiency was measured at 74%, with sufficient organic content for denitrification. No previous reports have given denitrification rates in units of both g NO3?-N/g VS/day and kg NO3?-N/m3 ceramic media/day for a single system.
3.4. Autotrophic Denitrification in the CPBR Packed with Porous Ceramic Sulfur Media
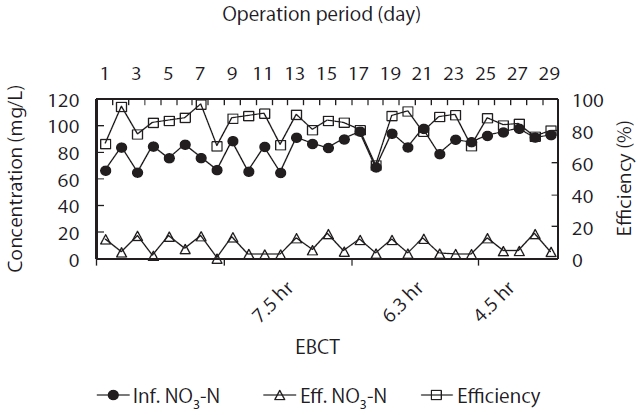
The autotrophic denitrification efficiency and NO3?-N con-centration profiles for CPBR packed with porous ceramic sulfur media for varying EBCTs are illustrated in Fig. 5. An average of 84 NO3?-N mg/L was fed to the autotrophic denitrification CPBR under an EBCT in the range of 4.5?7.5 hr, corresponding to a NO3?-N load of 0.84?1.38 kg NO3?-N/m3 ceramic media/day.
During the test period, autotrophic denitrification efficiency and the levels of NO3?-N in the effluent of autotrophic denitri-fication CPBR were found to be in the range of 80?90% and 3.6?7.7 mg NO3?-N/L, respectively. Thus, the average denitrification
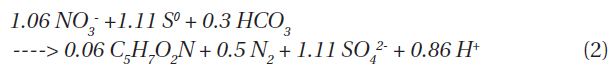
rates were obtained to be 0.96 kg NO3?-N/m3 ceramic media/day and 0.28 g NO3?-N/g VS/day. Some researchers [24, 36] re-ported a maximum specific denitrification rates using NO3?-N as an electron donor were 0.15 g NO3?-N/g VSS/day in laboratory-scale batch test and 0.1?0.2 g NO3?-N/g VSS/day in a suspended growth system. The stoichiometric autotrophic denitrification rate with sulfur as an electron donor is presented in Equation (2).
In this study, the maximum autotrophic denitrification rate was resulted twice the rate reported by previous studies [24, 36].
Usage of sulfur particles as an electron donor for autotrophic denitrification was restricted due to the decrease in the diam-eter of sulfur particles. Because the contact between NO3?-N and
The NH4+-N loading rate is a key influencing factor for the ni-trification rate in CPBRs. The nitrification efficiency was found to be in the range of 59?89% with the volumetric nitrogen load-ing rate of about 0.6?2.4 kg NH4+-N/m3 ceramic media/day, and with the NH4+-N utilization rate of about 0.08?0.31 g/g VS/day, respectively. The nitrification efficiency decreased from an aver-age of 89.4%, but it sustained to an average of 80.8%, when the volumetric nitrogen loading rate was increased stepwise from 0.45 to 1.8 kg NH4+-N/m3 ceramic media/day, with the NH4+-N utilization rate in the range of 0.06?0.24 g/g VS/day, respectively, at an EBCT of 8 hr.
The alkalinity consumption rate was found to be higher at an EBCT of 8 hr than at an EBCT of 6 hr. Therefore, the nitrifica-tion efficiency was more affected by EBCT than by the volumet-ric loading with NH4+-N concentration, even though the NH4+-N utilization rate was the same.
When the C/N ratio was raised from 1.1 to >4, the hetero-trophic denitrification rate was increased by a factor of 8.5 or 8.9 for the NO3?-N/g VS/day or NO3?-N/m3 ceramic media/day measurements, respectively. The highest average denitrification rate of 1.33 kg NO3?-N/m3 ceramic media/day was obtained for a maximum nitrate loading to ceramic media volume of about 1.8 kg NO3?-N/m3 ceramic media/day. Thus, a denitrification ef-ficiency of >74% was achieved with sufficient organic content at a C/N ratio of >4.
Autotrophic denitrification efficiencies of 80?90%, corre-sponding to an average denitrification rate of 0.96 kg NO3?-N/m3 ceramic media/day and 0.28 g NO3?-N/g VS/day, were obtained during the test period. Thus, the levels of NO3?-N in the effluent of the autotrophic denitrification CPBR ranged from 3.6 to 7.7 mg NO3?-N/L. The porous sulfur ceramic media enhanced the dissolution rate of elemental sulfur through an increased contact surface area. It also raised the autotrophic denitrification rate.