Secondary water contamination has surfaced as a serious issue in Korea as treated water goes through water distribution systems and home plumbing pipes.
Copper pipe in drinking water service has been highly prized through the centuries for its malleability, corrosion resistance and its high conductivity [1]. It is a dominant material for domestic water systems in North America, Australia and many countries of the Commonwealth for the reason that an enormous consumption of copper plumbing tube is easy to see when one considers its excellent corrosion resistance [2]. However, although copper piping was installed about 6 years ago, there are many instances of green-blue colored water from copper pipes. It leads to be the aesthetic complaint from consumers.
Copper ion is seldom present in finished drinking water but is introduced to drinking water through oxidation-reduction reactions between copper pipe and alloys in home plumbing systems and water, dissolved oxygen, chlorine or other oxidants [3]. Cupric ion released from copper pipes reacts with fatty acids in soap, therefore they are found in water often as blue or green turbid suspension. Corrosion reactions can cause drinking water quality to deteriorate because of the metal ions that enters the water. The colored water results in customers complaining of bad taste. In order to tackle this problem, it is necessary to research inhibiting green water and corrosion control of copper pipe in water service. However, there has been minimal research regarding the problem, and so far no definitive answer has been given to this question.
This paper shows that corrosion inhibitors can solve the green water problem and copper corrosion in water service line by adding the optimal concentration of corrosion inhibitors based on the regulation to avoid negative effects of public health.
1.1. Blue or Green Water Problem
Public concern on copper corrosion has further risen recently due to the occurrences of “blue water” or copper corrosion byproduct release [4]. Blue water is considered as a type of localized corrosion and related to the release of high concentrations of copper precipitates under conditions expected to induce passivity and adherent corrosion products on the copper surface [5].
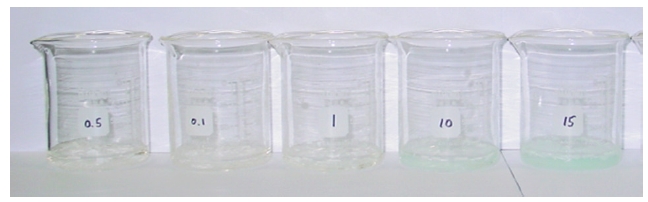
In order to determine the mechanism of green water problem, copper standard solution reacts with stearic acid
(CH4(CH2)16COOH; molecular weight [MW], 284.77). The concentration range of copper solution was 1-100 mg/L. Stearic acid 0.1 g was used in this study. As can be seen from Fig. 1, green or blue water problems are generated from 10 mg/L Cu ion. This is consistent with recent research that blue water phenomenon occurs in concentration of 20 ppm in tab water [6]. According to the report by Korea National Housing Corporation, blue water phenomenon occurs in concentration of 20 ppm in tab water.
Tap water contains generally 0.9 μg/L which meets environmental standard regulation. Therefore, it is hardly derived that the water in copper pipe turns blue. We can conclude that tap water going through fatty acids in the soap stained faucet and bath, and accumulated cu ions, react with fatty acid, which leads to the green water problem.
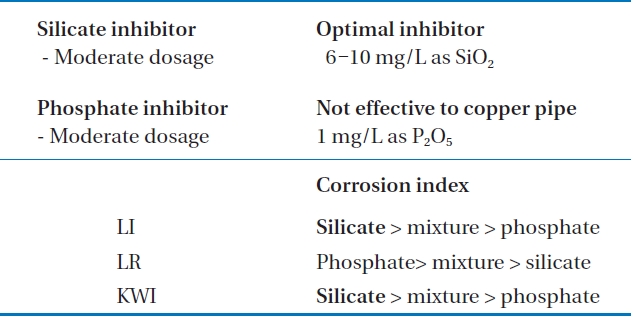
Copper pipe for waterworks system is made of C1201, C1220 phosphorous deoxidized copper according to KS D5301 (copper and copper alloy seamless pipes and tubes). We selected 40A (1.52 mm), 20A (1.14 mm) size of copper pipe which is well used for water service. Oven 60℃ for 2 hours, cooled in desiccators. Each coupon was mounted with epoxy resins several times in order to consider internal corrosion of copper pipe.
Phosphate based inhibitor (liquid type) is composed of sodium phosphate (NaH2PO4·2H2O), Hexametaphosphate [(NaPO3)6] and sodium pyrophosphate (Na4P2O7·10H2O). In the case of silicate inhibitor (liquid type), it is made by the reaction between SiO2 60-70% and Na2CO3 30% in 250℃for 6 hours. Then, Na2CO3 separates into Na2O and CO2 gas. Na2O reacts with SiO2, which becomes Na2SiO3. The mixture inhibitor was composed of phosphate and silicate.
The test was conducted under 3 types of conditions as can be seen from Fig. 2. For run 1 type copper coupon was submerged for 150days in 1L beaker. In order to accelerate the corrosion rate of copper coupon and determine flow rate, run 2 type was practiced under the mixing condition of 150rpm. The Run 3 type was conducted under the circumstance that test water was changed in every 7 days for 50 days in order to apply to real pipe line system. Copper ion, pH, alkalinity, Ca hardness, total dissolved solids (TDS), chloride, sulfate, orthophosphate were monitored during this period in order for analysis of relative water quality. The copper release change, Langelier saturation index (LI), Larson ratio (LR), and Korea water index (KWI) were calculated to estimate optimal corrosion inhibitor concentrations.
2.3. Analysis of Water Quality
Alkalinity, pH, hardness, TDS, Cl-, SO42- and PO43- were analyzed in order to determine water quality change depending on the corrosion inhibitor. Each water quality was considered by corrosion inhibition factors and corrosion acceleration factors.
As can be seen from Table 1, water temperature, pH, TDS were analyzed by ThermoOrion model 230A (Thermo Scientific Inc., Waltham, MA, USA). Titration method was conducted
[Table 1.] Analytical methods of water quality
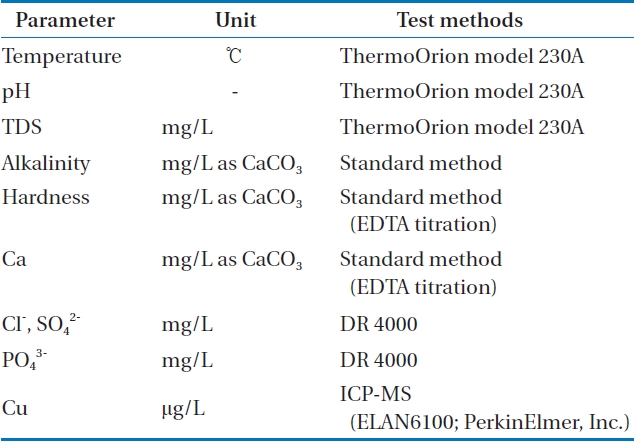
Analytical methods of water quality
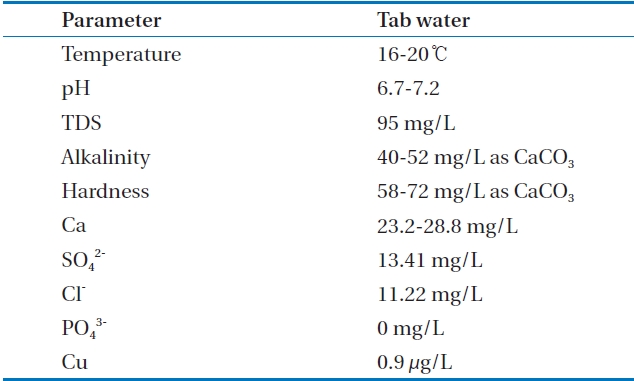
[Table 2.] Tap water quality in this research

Tap water quality in this research
in order to analyze alkalinity and hardness. Copper ions were analyzed by an inductively coupled plasma mass spectrophotometer (ELAN6100; PerkinElmer Inc., Waltham, MA, USA). DR 4000 spectrophotometer (HACH, Loveland, CO, USA) was used to analyze chloride (Cl-), sulfate (SO42-). Table 2 explains the qaulity of tested waster.
3.1. The Effect of Corrosion Control
3.1.1. Rate measurement by coupon weight loss method
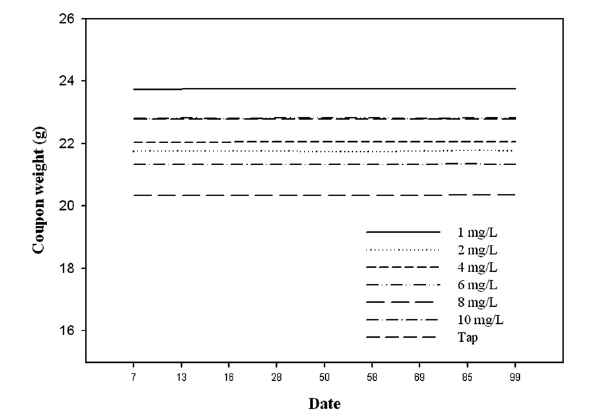
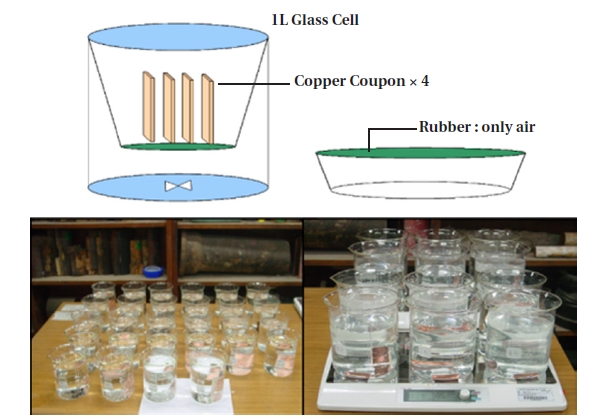
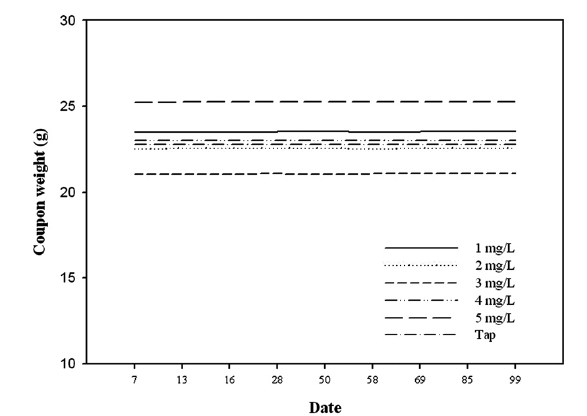
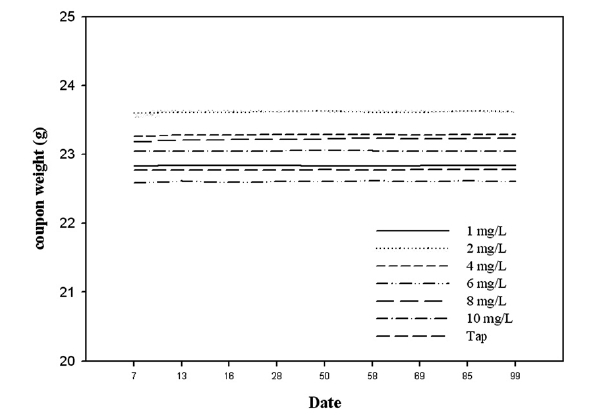
The experiment was conducted where copper coupon was submerged in tap water dosing on different corrosion inhibitor concentration for 157 days. As can be seen from Figs. 3-5, coupon weight didn’t show any change during the test period. It was found that weight loss of coupon couldn’t be measured for that period. This method does not indicate any variations in the corrosion rate that occurred during the test. In run type 2, which was applied to flow rate, the weight loss of coupons was not measured for 90 days. This is why copper pipe for water distribution systems are corrosion resistant, as phosphorous deoxidized copper is not oxidized and corroded easily. This result is consistent with how the blue water problem occurs in conditions where copper pipes are not corroded. Blue or green water problems happen in the presence of several mg/L of copper ion. In order to solve the blue or green water problem, micro inspection was needed.
It was concluded that coupon weight didn’t decrease during the test period. Therefore, we monitored copper ion release to determine corrosion control regarding copper pipes.
3.1.2. Behavior of cupric compound in aqueous state
Simulation of MINEQL+ ver. 4.5 (Environmental Research Software, Hallowell, ME, USA) was conducted in order to estimate cupric compound behavior in tap water.
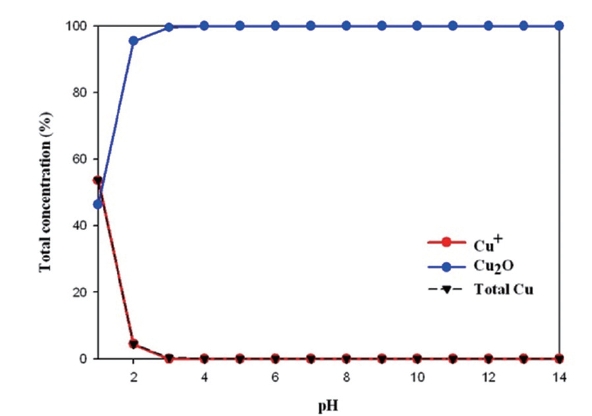
As can be seen from Fig. 6, copper ions in tap water differ from relative concentrations between H+ and OH- depending on pH. Cuprous ions are less stable than cupric ions. It was found that cuprous ions (Cu+) existed below pH 3, as pH levels increased, it became cuprite (Cu2O). This solid is expected to be formed during corrosion, especially during periods of stagnation, and may passivate the surface of copper. It is considered that cuprite is in the bottom layer of corrosion products.
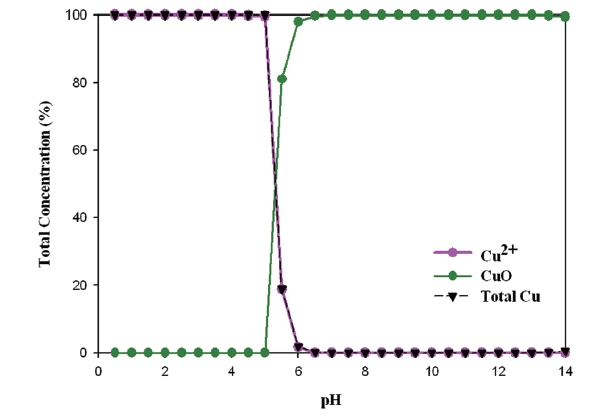
Cupric ion (Cu2+) appears until pH 6, as pH increases. It precipitates as tenorite (CuO) as can be seen from the Fig. 7. Treated water has a pH range between 5.8 and 8.5. Tested water had pH 6.7-7.2. Therefore, cuprous ion was seldom present in tested water, which considers that tenorite was on the coupon surface. It shows us that copper ions in the tap water were formulated with different kinds of aqueous complexes and dissolved solids.
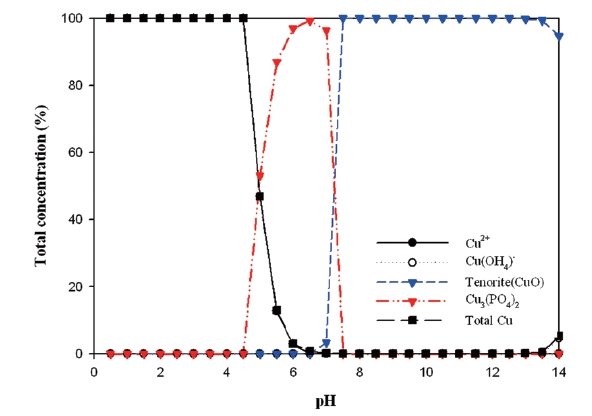
The behavior between cupric ion and phosphate (PO43-) is showed in Fig. 8. Cupric phosphate (Cu3(PO4)2) was dominant in pH 6-8. Tenorite (CuO) appeared from pH 7. Cupric oxyhydroxide (Cu(OH4))was often present during corrosion. Therefore, cupric phosphate was formed as phosphate based inhibitors reacted with released metal ion.
3.2. Relative Effect of Inhibitor Dosage
To highlight the relative effects of inhibitor dosage on copper release, “a copper release percent change” was calculated for a given time [7].
Copper release change

As is shown in the above equation, the positive number demonstrates that the corrosion inhibitor is effective regarding corrosion control. The higher the calculated positive number, the more competent the corrosion inhibitor will be in suppressing corrosion control. On the other hand, negative numbers signify acceleration in the corrosion rate.
3.2.1. Phosphate based corrosion inhibitor
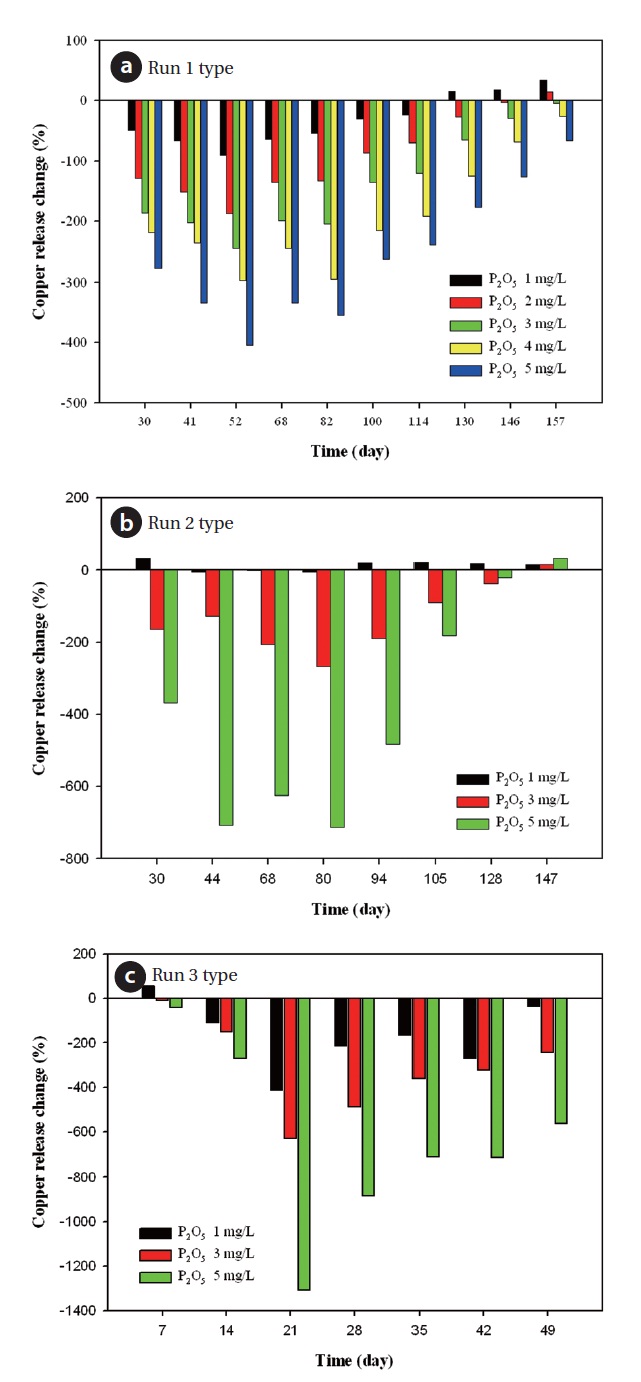
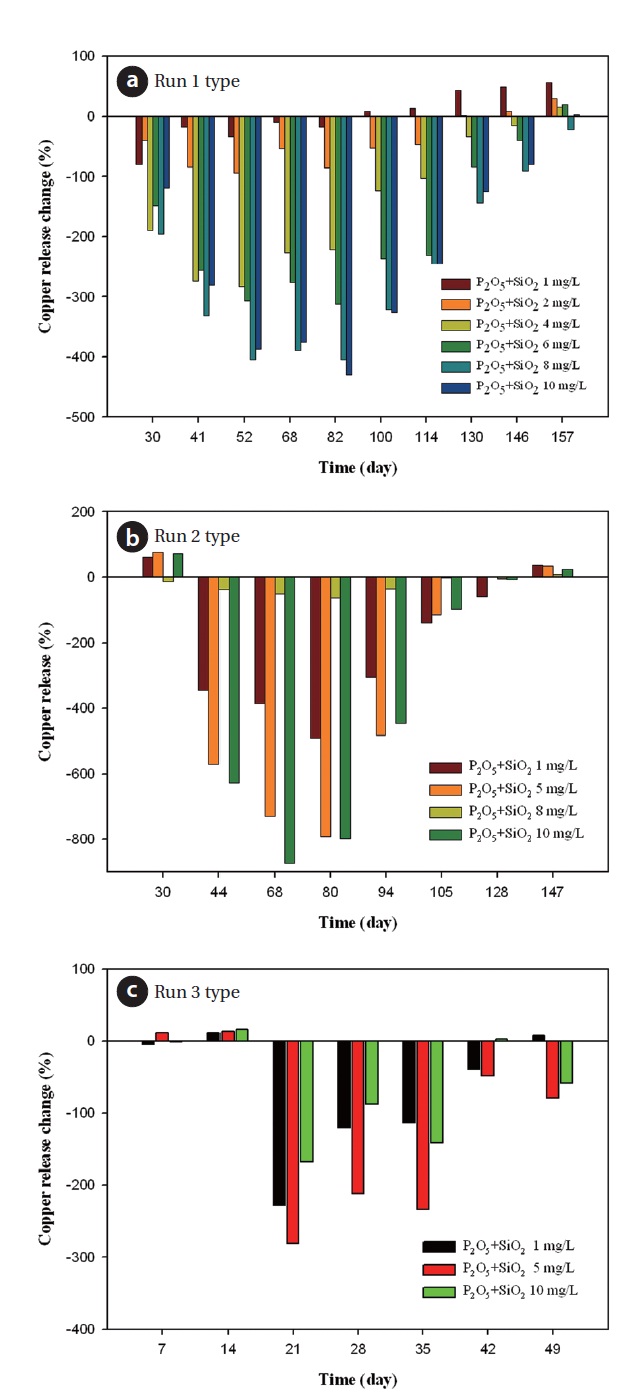
According to Fig. 9(a), percent change was a positive number 130 days after phosphate based corrosion inhibitor 1 mg/L was dosed. It was discussed that 1 mg/L doses of phosphate based inhibitor generally decreased copper release within a duration of a 130 days. On the other hand, as doses of the corrosion inhibitor increased to 5 mg/L, relative effects of the corrosion inhibitor plunged rapidly. This result was consistent with further research that moderate(1 mg/L as P)polyphosphate or orthophosphate generally decreased copper release in pipe rig tests [7, 8].
Copper ion released from copper coupon reacted with phosphate with which polyphosphate was hydrolyzed. Copper complex tended to increase soluble copper release. Orthophosphate complexes with Fe2+, Cu2+ and Pb2+, which made passivation films on anodic sites, suppressed the electrochemical corrosion reactions. Polyphosphate prevented formation of slightly soluble scales of calcium carbonate, calcium sulfate, and stabilize iron and manganese to prevent red water. Polyphosphates have a record of successful corrosion suppression in some waters but in others they can increase corrosivity. Research found an accelera-
tion of copper and corrosion by polyphosphate, which was due to the reversion to orthophosphate.
Fig. 9 indicates the behavior between cupric ion and phosphate (PO43-). As dosage of phosphate corrosion inhibitor levels increase gradually, orthophosphate complexes with cupric ion as blue solid.
The reaction equation simplifies to:
3Cu2+ + 2(PO4)3-→ Cu3(PO4)2
(Cupric phosphate)
This reaction had an effect on the loss of the metal solubility. Cupric phosphate was a blue, soluble complex. However, in cases concerning copper pipes, this soluble by-product brought about blue or green water problems.
As can be seen from Fig. 9(b) run 2 type, copper release change was positive after 94 days when the inhibitor dosage was 1 mg/L. Copper release change shows positive value for 147 days under the whole concentration range of inhibitor. In run 3 type, the relative effect of corrosion inhibitors was not found during the test period. Therefore, in 3 test type, the optimal corrosion inhibitor concentration was 1 mg/L as P2O5.
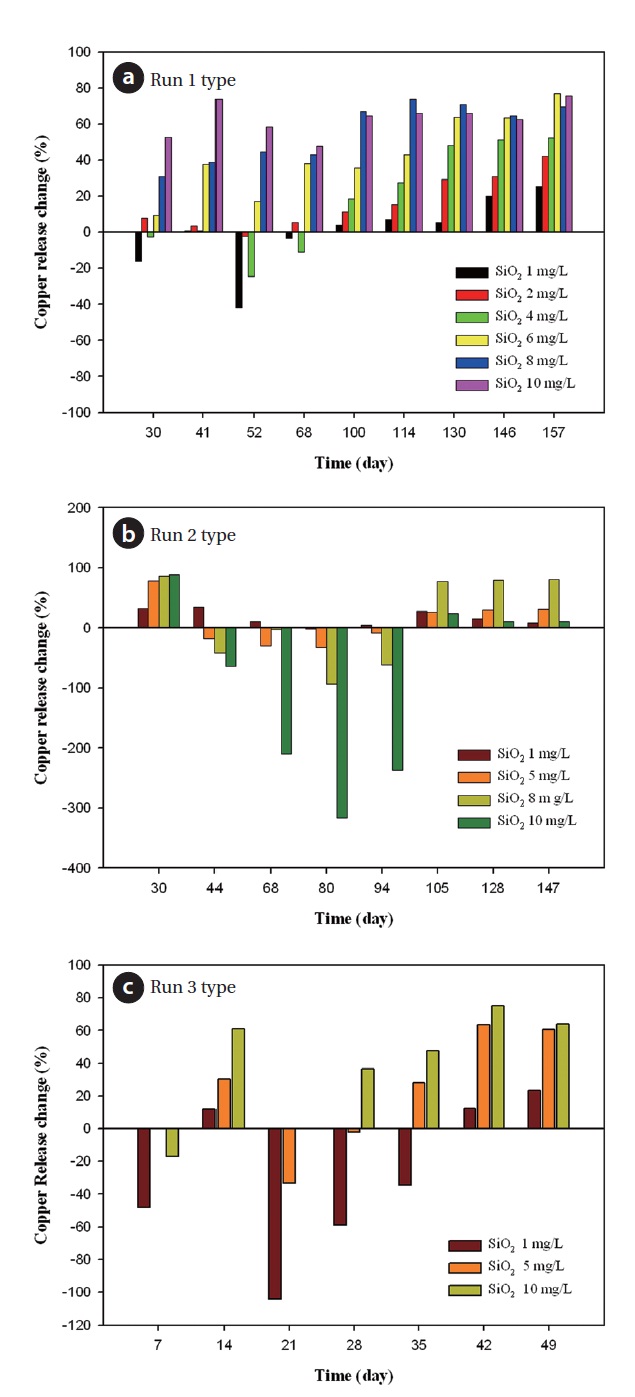
3.2.2. Silicate based corrosion inhibitor
Fig. 10 illustrates the relative effect of silicate based inhibitors. Except for 1 mg/L dosage of silicate based inhibitor in 30 days and 50 days, relative effects of inhibitors were positive numbers depending on inhibitor concentration shown from Fig. 10(a). In run 1 type, copper release change was positive in the whole concentration range of the inhibitor. In run 2 type, copper release change was positive in 105 days. In run 3 type, the copper release change of 10 mg/L dose was positive from 28 days. It is positive in the whole range of inhibitor concentration from 42 days. Furthermore, as the inhibitor dosage increased, copper release decreased steadily whereas phosphate inhibitor accelerated copper ion release. It was found that the silicate inhibitor had benefits towards the corrosion control of copper pipes. In the initial test period, low dosage of silicate inhibitors had negative numbers. Interestingly as time went on, the change in copper release climbed up slowly. This supports the idea that the silicate inhibitor forms a protective film consisting of ferric or another metal oxide and silicate as opposed to phosphates that form protective films on the bare metal surface by chemical reaction with either the corrosion products or the bare metal. Corrosion must occur before the metal surface can be protected. The films are self-limiting and don’t build up in thick layers. If the dosage is discontinued, the protection will cease within a short time.
3.2.3. Blended corrosion inhibitor
According to Fig. 11(a), as inhibitor dosage increases to 10 mg/L, the percent change of copper release decreased. There was a similar trend on the phosphate based inhibitor. Dosage of 1 mg/L blended inhibitor was positive 8% in 100 days, after 130 days dosing of 2 mg/L inhibitor was 2.22%. In 1 mg/L, the percent change increased steadily whereas high dosage of inhibitor was a negative percentage. In the case of run 2 type, copper release change was positive after 147 days from Fig. 11(b). In this period, all concentrations of corrosion inhibitors were efficient to decrease copper release in comparison to not including an inhibitor. Fig. 11(c) represents the relative effect in run 3 type. The copper release changes in the all concentration ranges were positive until 28 days. Its effect disappeared, and in 49 days the copper release change of the 1 mg/L dose was positive. As such, moderate dosage of blended inhibitor was 1 mg/L.
3.3. Indirect Method by Corrosion Index
In order to control corrosion in copper pipe it is imperative that highly variable water quality needs to be monitored and related corrosion index calculated [9].
Several values of water quality were measured depending
on types and its concentration of corrosion inhibitor. Langelier saturation index (LI), Larson ratio (LR) and Korea water index (KWI) were monitored and calculated based on variation of water quality.
3.3.1. Langelier saturation index (LI)
The LI is the most widely used indicator of water scale potential [10]. It is purely an equilibrium index and deals only with the thermodynamic driving force for calcium carbonate scale formation and growth.
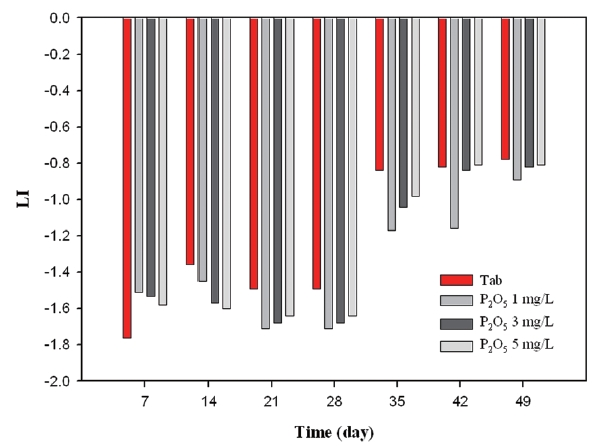
Since pH is a corrosion inhibition factor, Cu ion is less soluble as pH increases. Alkalinity is known as an important factor to form a calcium carbonate scale.
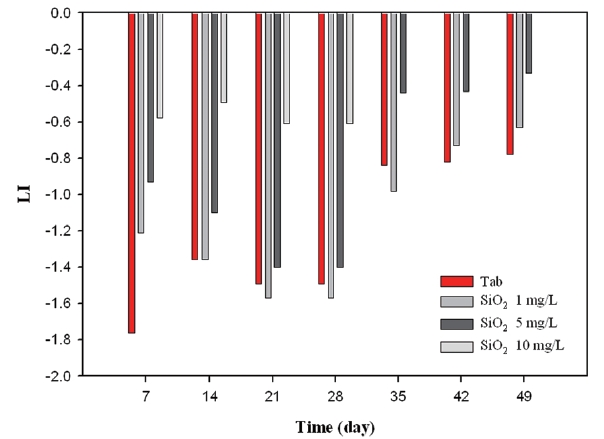
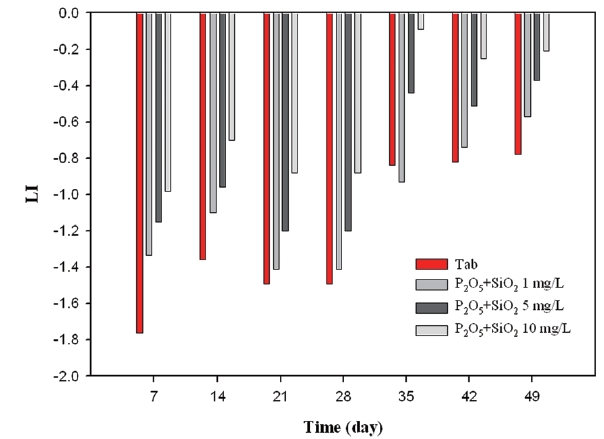
Firstly, as can be seen from Fig. 12, LI varied between -1.78 and -0.92 under the condition without the inhibitor, whereas as the amount of corrosion inhibitor increased, LI values decreased gradually. Secondly, Fig. 13 showed that the silicate based inhibitor had opposite effects on LI compared to phosphate based inhibitors. Since silicate based inhibitors increased pH depending on concentration, and it had an important role on increasing alkalinity, the LI value was less negative in comparison to not having an inhibitor. Thirdly, as seen from Fig. 14, the blended inhibitor had a similar trend to forming a protective layer in the coupons compared to silicate based inhibitors, as the concentration of blended inhibitors multiplied to 1 mg/L, 5 mg/L, 10 mg/L, LI is from -1.33 to -0.57, from -1.15 to -0.37, and from -0.98 to -0.21. There was a positive correlation between inhibitor concentration and LI value, which resulted from the silicate component in blended inhibitors.
As a result of monitoring LI, silicate based inhibitors were the most beneficial in regards to corrosion control concerning copper pipe. Phosphate based inhibitor did not have any positive impact towards corrosion control.
3.3.2. Larson ratio (LR)
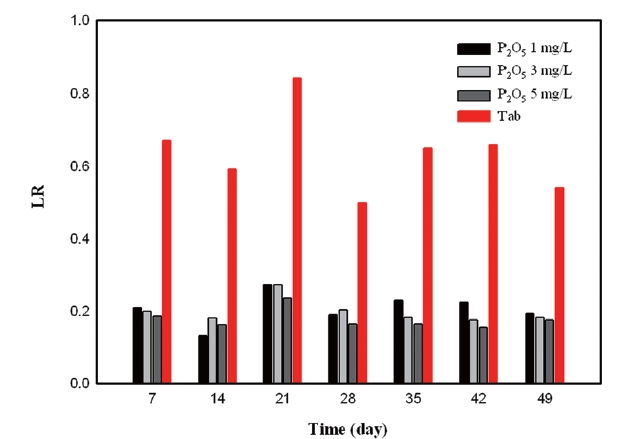
The LR was developed from the relative corrosive behavior of chlorides and sulfates for the protective properties of bicarbonate.
There was a negative correlation between phosphate based inhibitors and sulfate concentration. It is apparent that the values obtained from test of phosphate based inhibitor were less than the test of silicate based inhibitors. In the previous section it was determined that phosphate based inhibitors had an impact on reducing sulfates significantly. As inhibitor concentration increased to 5 mg/L, LR decreased gradually. The value of test water without inhibitors was over 0.4. However, the values concerning the whole range of inhibitor dosage are below 0.4 (Fig. 15).
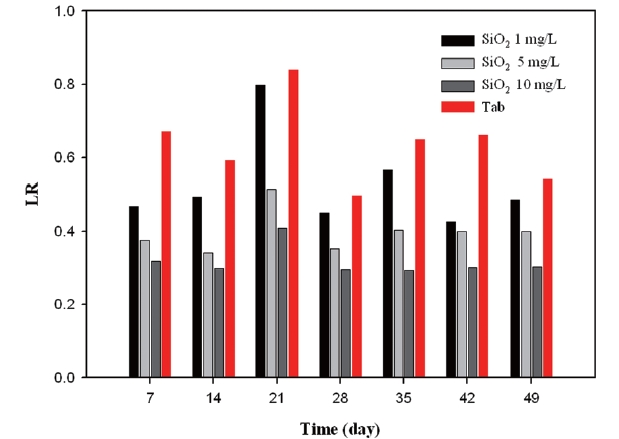
Fig. 16 illustrates variations of LR depending on the silicate based inhibitor concentration. It was observed that the value regarding dosing 1 mg/L was over 0.4 during the test period. However, as inhibitor concentrations increased to 10 mg/L, LR decreased below 0.4, which continued for 49 days. This was because the silicate based inhibitor had a role to increase alkalinity. As the amount of bicarbonate (HCO3-) climbs up, LR plunges. It was due to the fact that the bicarbonate reacted with sulfate.
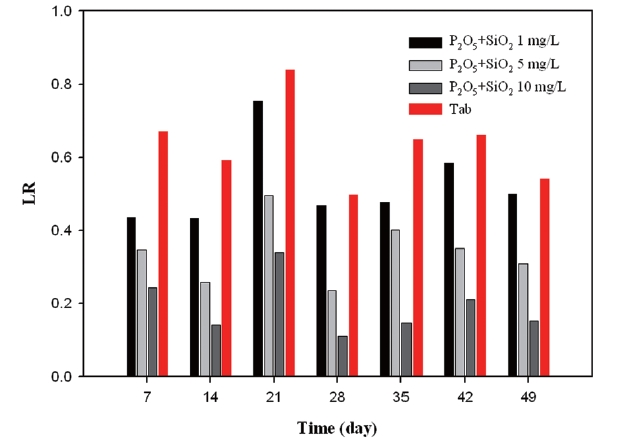
As seen from Fig. 17, mixture inhibitor showed a negative correlation between inhibitor concentration and LR. The value for doses of 10 mg/L was below 0.4 during 49 days.
According to the results of LR, phosphate based inhibitors were the most effective while silicate based inhibitor had a negative effect towards corrosion control.
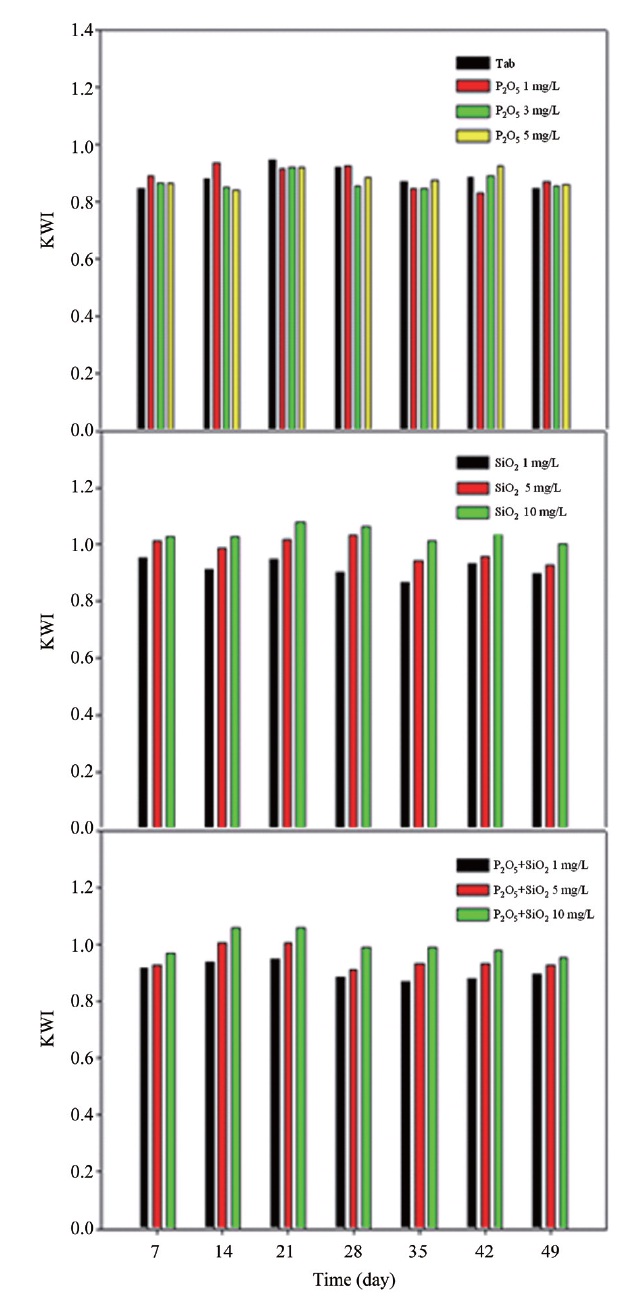
3.3.3. Korea water index (KWI)
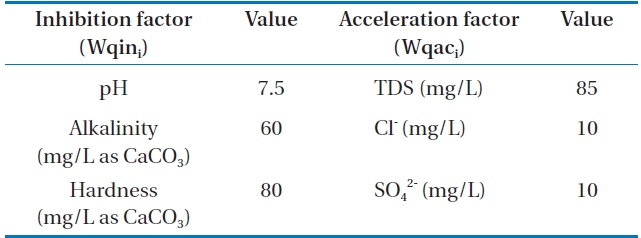
In order to compare the water quality depending on dosing corrosion inhibitor, KWI which was developed by Lee et al. [9] was applied in this research. The pH, alkalinity, and hardness were selected as the corrosion inhibition factor. On the other
hand, chloride, sulfate, and TDS were selected as the corrosion acceleration factors. Table 3 shows the optimizing factor of corrosion control (Wqoi).
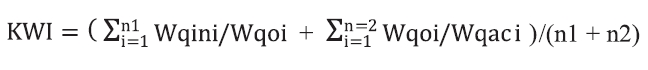
Where,
Wqini : inhibition factor, Wqaci: acceleration factor,Wqoi : optimum water quality, KWI >1: corrosive, KWI = 1: equlibrium, KWI < 1: non corrosive, n1: the number of inhibition factor, n2: the number of acceleration factor.
The data of water quality obtained from the run 3 type was used to calculate KWI, as seen from Fig. 18. Firstly, KWI varied between 0.83 and 0.92, as dose of phosphate inhibitor increased to 5 mg/L. It showed a trend of being close to 1. This index determined that water was not corrosive if the value was over 1. Therefore, phosphate based inhibitors did not have a seriously bad effect on corrosion control regarding copper pipes providing the result.
Secondly, in cases concerning silicate based inhibitors, KWI fluctuated between 0.93 and 1.04 depending on the inhibitor concentration. This result indicated that silicate based inhibitors made water non-corrosive. Thus, silicate based inhibitors were effective in controlling copper corrosion, which was confirmed by the result of copper release change, LI calculation.
Thirdly, KWI was from 0.88 to 0.98 when the mixed inhibitor concentration increased to 10 mg/L. Especially, the value was 1.06 in 14 days, and 1.05 in 21 days, which indicated that water was non-corrosive. As such, blended inhibitor had less effect towards corrosion control than did silicate based inhibitors.
To sum up, as can be seen from Table 4, the most moderate corrosion inhibitor to control copper pipe corrosion was the silicate based inhibitor, whose optimal concentration was 8 mg/L to 10 mg/L as SiO2. In cases of phosphate inhibitors, it can accelerate corrosion in copper pipe. The optimal dosage of inhibitor was 1 mg/L, whereas compared to silicate based inhibitors, it was less effective.
[Table 3.] Optimizing factor of corrosion control

Optimizing factor of corrosion control
[Table 4.] Summary of the inhibitors effects on corrosion control

Summary of the inhibitors effects on corrosion control