검색 전체 메뉴
PDF
맨 위로
OA 학술지
Application of Multiparametric Flow Cytometry (FCM) to Enumerate the Diagnosis of Pseudomonas aeruginosa and Escherichia coli
  • 비영리 CC BY-NC
  • 비영리 CC BY-NC
ABSTRACT
Application of Multiparametric Flow Cytometry (FCM) to Enumerate the Diagnosis of Pseudomonas aeruginosa and Escherichia coli
KEYWORD
Bacterial diagnosis , Escherichia coli , Flow cytometry , Pseudomonas aeruginosa
  • 1. Introduction

    Water is a major vehicle of disease transmission preceded scientific verification of the germ theory of disease [1]. Therefore, the presence of infectious bacteria, such as Vibrio cholerae, Escherichia coli O157, and Salmonella or Pseudomonas spp. in drinking water has a potential to enter numerous persons to cycle of waterborne disease [2]. To the bacteriologists in the study of infectious disease and management of public health, the reliable and fixable methods on the enumeration of pathogenic bacteria including the determination of bacterial diagnosis is the most important factor in their research in order to protect humans from the potential exposure of the infectious bacteria.

    Among the bacterial properties, viability and activity (bacterial regrowth potential, BRP) assessments are major requirements in several areas of infectious bacteriology [3]. Especially, detection of viability of pathogenic bacteria is very important to assess the inactivation profiles in the water disinfection process. Assessment of active or viable microorganisms is often difficult, since no single analytical method identifies all physiological characteristics of bacterium under a certain condition [4]. Although counting colony formed on agar plate is usually employed as the standard method for measuring bacterial viability, it only indicates the number of cells able to replicate under the conditions provided for growth. Moreover, the counting colony forming unit (CFU) method requires much time (in most cases, results are available in 24 to 72 hr) to incubate and detect the target cells, and some bacteria in a specific physiological status, for example in a viable but nonculturable state, cannot be detected by the CFU counting method [2, 5].

    Fluorescent techniques in combination with flow cytometry (FCM) have been extensively used for the assessment of the viability or BRP of microorganisms from different environmental samples [5-7]. The FCM technique makes it possible to perform a rapid detection of individual cell viability within a few minutes [8-10], and offers a powerful tool for analyzing a cell population at the single-cell level, since it can be used both to identify and enumerate bacterial populations from environmental samples and to characterize functional properties of the individual cell [5, 10]. Moreover, it allows simultaneous measurement of different physical and biochemical parameters and hence offers substantial information on the dynamics and physiological heterogeneity of the bacterial population. In addition, FCM offers the ability to physically separate selected cells by cell sorting for further molecular and physiological analysis when used in combination with fluorescent staining, for example, dyes based on enzyme activity, membrane integrity, and membrane potential [11-16].

    FCM is an analytical method that allows the rapid measurement of light scattered and fluorescence emission produced by suitably illuminated cells. The cells, or particles, are suspended in liquid and produce signals when they pass individually through a beam of light [6]. Since measurements of each particle or cell are made separately, the results represent cumulative individual cytometric characteristics. An important analytical feature of FCMs is their ability to measure multiple cellular parameters [5, 16]. Some FCMs are able to physically separate cell subsets (sorting) based on their cytometric characteristics.

    However, most of the FCM tests that assess the viability of bacteria have been done certainly about the single sort of pure culture cell in laboratory environments, so far. Furthermore, the applicability of FCM to the viability assessment as well as the detection of the amount of dead bacteria with regards to the water disinfection field has not been clearly studied thus far.

    Therefore, this study was performed to estimate the applicability of FCM to assess the viability as well as the population of Pseudomonas aeruginosa and Escherichia coli. Additionally, survival properties of two bacterial strains against exposure to antimicrobial silver and copper cations were estimated by applying the multiparametric FCM technique.

    2. Materials and Methods

       2.1. Bacterial Strains

    Two bacterial strains, Pseudomonas aeruginosa (ATCC 10145), and Escherichia coli K12 (IFO 3301) were used during this study. P. aeruginosa and E. coli were carefully incubated in Luria-Bertani (LB) broth medium (10 g, tryptone; 5 g, yeast extract; 5 g, NaCl per liter of distilled water and sterilized at 120℃ for 15 min) for 24 hr at 37℃ [17, 18]. All of the bacterial samples were collected in the exponential growth phase and adjusted to a density of 1 × 10⁹ cells/mL. Exponential growth phases of tested bacteria in optimized nutritional conditions were determined by consecutive monitoring of the variation in bacterial densities using FCM combined with fluorescent staining of bacterial nucleic acids with SYTO 9 and propidium iodide (PI). During the experiments, the viability or survivability (when silver and copper was exposed) of bacteria was simultaneously detected by FCM, and compared with that detected by the CFU counting method based on the plate culture.

       2.2. Preparation of LIVE and DEAD Bacteria

    Three pairs of sterilized centrifuging tubes (15 mL) including 10 mL of each culture media (LB broth, CBYE) containing a number of P. aeruginosa, and E. coli (3 × 10⁷ cells or CFU/mL) were used to yield the individual conditions of bacteria, live and dead. The samples were then centrifuged at 3,500 rpm for 15 min, and separated supernatants were removed from the samples. Isopropyl alcohol (75%, for dead) and distilled water (for live samples) were continuously injected as same amount of removed supernatant onto both tubes and the samples were re-suspended by vortex for the preparation of dead and live conditions of P. aeruginosa, and E. coli. All samples were then cultivated at room temperature while mixing every 15 min during 1 hr. After this step, samples were centrifuged again and supernatants were removed. Finally, the distilled water was added as a rinsing reagent onto samples to remove the effect of residual sterilizer (this step was repeated 3 times). Consequently, the same amount of live and dead samples of P. aeruginosa, and E. coli were prepared with roughly the same density following the products information of company regarding molecular probes.

    Additionally, silver and copper cations dissolved from silver nitrate (AgNO3; Kisita Co., Japan) and copper sulfate, 5-hydrate (CuSO4 ?5H2O; Kisita Co., Japan) was exposed to P. aeruginosa and E. coli as the range of 0-0.1 mgAg/L and 0-1.0 mgCu/L to observe the applicability of FCM to monitor the variation of bacterial diagnosis in the exposure to disinfectants (silver and copper) [19]. The concentrations of silver and copper in collected samples were measured by using inductively coupled plasma mass spectrometry (ICP M/S, Hp 4500 series; Agilent, Santa Clara, CA, USA) in the acidic condition (< pH 1) with nitric acid (3% HNO3).

       2.3. Staining Protocols and FCM

    Based on the permeability of the cell membrane, the nucleic acids (RNA/DNA) of P. aeruginosa, and E. coli were stained with two kinds of fluorescent molecular probes (LIVE/DEAD Baclight bacterial viability kits, L-7012; Molecular Probes Inc., Eugene, OR, USA), SYTO 9 and PI (C27H34I2N4; Phenanthridinium, 3,8-diamino-5-[3-(diethylmethylammonio)propyl]-6-phenyl-, diiodide; molecular weight [MW], 668.40) [8]. The bacterial samples labeled with SYTO 9 and PI were then analyzed by FCM to assess the viability and number of bacteria [5, 20]. SYTO 9 has a maximum excitation wavelength (λmax) of 504 nm and an emission wavelength of 525, while PI has 536 nm and 625 nm, respectively. Mixed PI and SYTO 9 molecular probes were simultaneously added to the samples at a concentration of 1.5 μg per mL sample, and samples were incubated at room temperature for 15 min in the dark. Flow count™ with a volume of 100 μL (assayed concentration was 1,052 particles/μL; Beckman Coulter Inc., Fullerton, CA, USA) was added to count the bacterial number in samples. The bacterial population was calculated following the equation; where, the content C is the concentration of target bacteria (cells/mL), NDetected is the number of bacteria counted by FCM protocol (cells), F.CDetected is the number of flow counter counted by FCM (particle), and D is the dilution rate.

    image

    FCM analyses were performed on a EPICS ALTRA™ with a HyPerSort Cell Sorting flow cytometer (Beckman Coulter Inc.) equipped with a 15-mW, 488 nm, air cooled argon ion laser. Bacterial samples were diluted to approximately 105 cells/mL and delivered at a low flow rate, corresponding to 80 to 150 cells or particles/sec. A band pass filter of 525 nm (510 to 540 nm) was

    used to collect the green fluorescent signal (PMT2), and a band pass filter of 610 nm (615 to 640 nm) was used to collect the red fluorescent signal (PMT4). Data were analyzed with the EXPO™ 2 Flow Cytometry Software ver. 2 (Beckman Coulter Inc.).

    3. Results and Discussion

       3.1. FCM Protocol for the Double Staining with SYTO 9 and PI

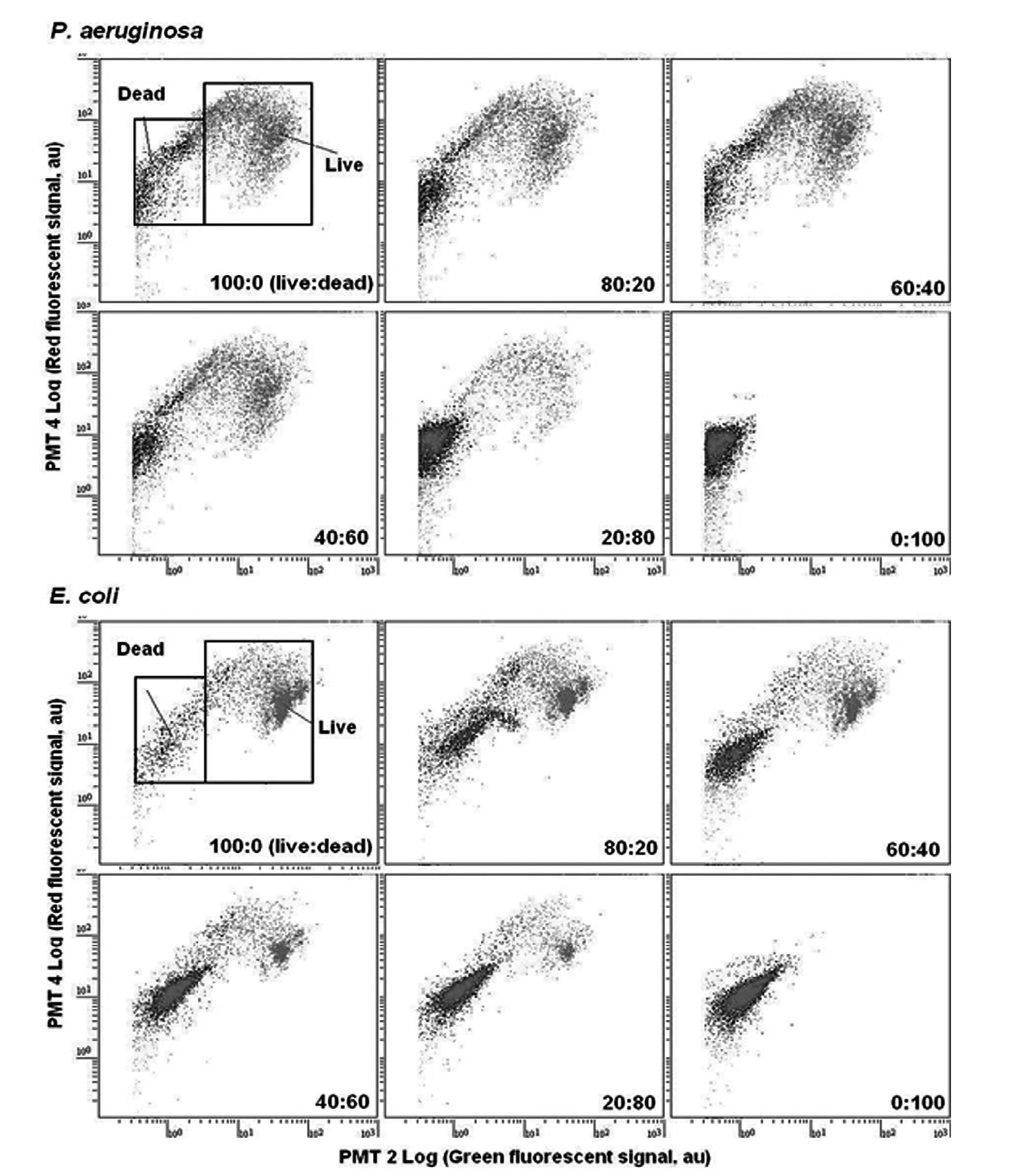
    Fig. 1 showed overlays of fluorescence histograms of P. aeruginosa and E. coli cells that were not treated (live) and cells that were fixed to 30% of isopropyl alcohol (dead). The LIVE/DEAD bacLight viability kit (Molecular probes Inc.) was developed to assess the viability (dead or live) of bacteria, based on plasma membrane permeability and has been used to monitor growth of bacterial populations [11, 21]. This kit comprises two fluorescent nucleic acid stains: SYTO 9 and PI. SYTO 9 (green; excitation and emission maxima, 480 and 500 nm) is a high-affinity nucleic acid (DNA/RNA) stain that crosses the plasma membranes of whole bacterial cells, while PI (red; excitation and emission maxima, 490 and 635 nm) is commonly used as a cell death marker because it is excluded by intact plasma membranes; thus, the fluorescence conferred by the probe is generally associated with cells that have lost their membrane integrity [5]. Therefore, bacterial cells with compromised membranes fluoresce red and those with intact membranes fluoresce green [16, 22].

    The mixture of only SYTO 9 labeled model bacteria (live) and both SYTO 9 and PI labeled bacteria (dead) with percentages of 100:0, 80:20, 60:40, 40:60, 20:80, and 0:100 (live:dead) were then counted by multiparametric FCM performing region analysis on PMT 2 (green fluorescent, 510-540 nm) versus PMT 4 (red fluorescent, 615-640 nm) dot plots. As shown in the FCM cytograms

    (Fig. 1), the gate for dead bacteria was defined as the range of 0.2 × 100 to 6.0 × 101 PMT 2 fluorescence (X-axis) and 2.0 × 100 to 2.0 × 10² PMT 4 fluorescence (Y-axis), and the gate for live bacteria was defined as the range of 6.0 × 100 to 6.0 × 10² PMT 2 fluorescence (X-axis) and 2.0 × 100 to 4.0 × 10² PMT 4 fluorescence (Y-axis). The number of live and dead cells could be calculated by creating gates on the cytograms. Consequently, using the FCM protocol with PMT 2 and PMT 4, live and dead P. aeruginosa and E. coli were clearly separated into two subpopulations corresponding to the mixing rate of live and dead compositions.

       3.2. Application to the Monitoring of Bacterial Diagnosis

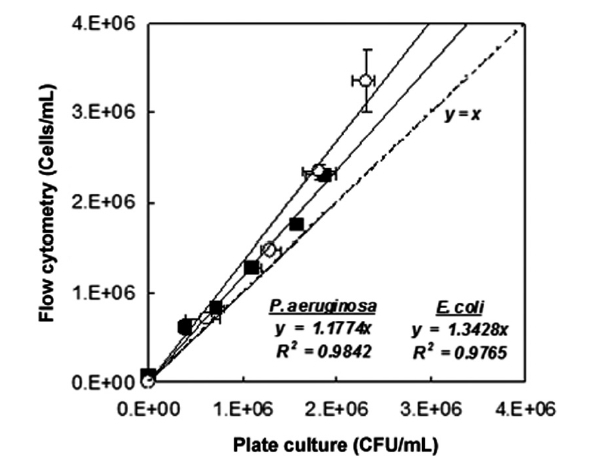
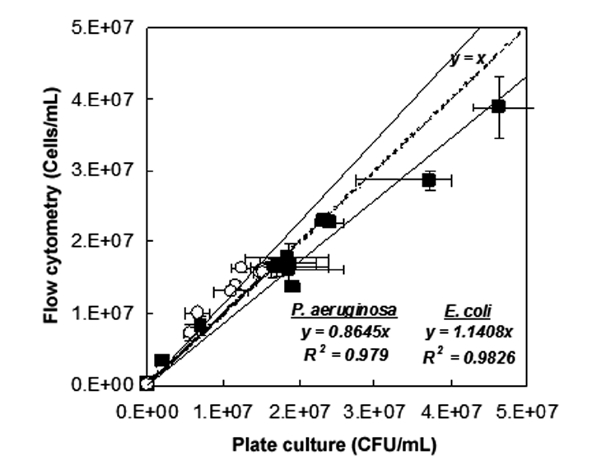
    The results of fluorescence counts of bacterial diagnosis (viability) based on the region analysis on PMT 2 (green fluores-cent, 510-540 nm) versus PMT 4 (red fluorescent, 615-640 nm) dot plots were compared with the counts that were measured by the plate culture method (culturability assessment) as shown in Fig. 2. Additionally, the number of the tested bacteria in the live condition detected by FCM (cells/mL) well represented the number of those detected by culturability assessment with agar plate (CFU/mL). As the results on fitting the data with linear functions, slope was measured in 1.1774 cell/CFU (R2 = 0.9842, n = 6) in the case of P. aeruginosa, and was measured in 1.3428 cell/ CFU (R2 = 0.9765, n = 6) regarding E. coli, respectively.

    Consequently, the numbers of the tested bacteria detected by FCM protocol was slightly over-estimated than the number detected by the culturability assessment. These phenomena might be come from the physiological properties of bacteria that entered into a viable but non-culturable (VBNC) state due to the environmental or nutritional stresses. Hwang et al. [2] demonstrated that the culturability assessment based on the counting colony formed on agar plate was very difficult if the bacteria had entered into a state of VBNC. According to the observations, detection of viability as well as the density of the pure-cultured P. aeruginosa and E. coli that were treated with isopropyl alcohol (30%) was successfully performed, simultaneously.

    Based on the observed results, FCM was surveyed to monitor the disinfection properties of P. aeruginosa and E. coli in synthetic drinking water (SDW) that were treated with bactericidal silver (Ag+) and copper(Cu++) cations. These results were shown in Fig. 3. The data plotted in figure were partly collected from our previous studies that have demonstrated the biocidal properties of silver and copper reagents [2, 19]. Fitting the number of bacteria in live condition detected by FCM and plate culture with linear functions after exposure to the concentrations of silver at the range of 0-0.1 mgAg/L and copper at the range of 0-1.0 mgCu/L (P. aeruginosa, slope = 0.8645 cell/CFU, R2 = 0.9790 and n = 16; E. coli, slope = 1.1408 cell/CFU, R2 = 0.9826 and n = 12). Furthermore, the number of tested bacteria detected by viability assessment with FCM correlated well with the number of bacteria that was detected by culturability assessment with plate culture, respectively.

    Compared with the data obtained from alcohol-fixed tests, the number of P. aeruginosa in live condition detected by FCM after exposure to silver and copper was observed to be slightly lower than that detected by plate culture, but the data observed from E. coli tests showed similar with the numbers detected by plate culture. From the results, the application of FCM to monitor the functional effect of disinfectants on the physiological status of target bacteria can offer more rapid and reliable data than the plate culture colony counting method.

    4. Conclusions

    In this study, multiparametric (PMT 2 for green fluorescence and PMT 4 for red fluorescence) FCM was installed to enumerate the bacterial diagnosis (viability as well as the population) of P. aeruginosa ATCC 10145 and E. coli K12 (IFO 3301). The nucleic acids (DNA/RNA) were double stained by a LIVE/DEAD bacLight viability kit (Molecular Probes Inc.), involving green SYTO 9 and red PI, based on the permeability of two chemicals according to the integrity of plasma membrane concerning the tested bacteria. Additionally, the FCM was introduced to verify its applicability to monitoring the biocidal profile of silver and copper cations in the inactivation of the tested bacteria.

    The FCM protocol with PMT 2 and PMT 4 successfully determined diagnosis (live and dead) of P. aeruginosa and E. coli. The gate for dead bacteria was defined as the range of 0.2 × 100 to 6.0 × 101 PMT 2 fluorescence (X-axis) and 2.0 × 100 to 2.0 × 10² PMT 4 fluorescence (Y-axis), and the gate for live bacteria was defined as the range of 6.0 × 100 to 6.0 × 10² PMT 2 fluorescence (X-axis) and 2.0 × 100 to 4.0 × 10² PMT 4 fluorescence (Y-axis). In the comparison to the number of the tested bacteria detected by FCM (viability assessment) and plate culture (culturability assessment), the number of bacteria detected by FCM well represented the number of bacteria that was detected by the CFU counting method when bacteria were exposed to isopropyl alcohol and silver/copper cations.

    Consequently, it is concluded that application of FCM to monitor the functional effect of disinfectants on the physiological status of target bacteria can offer more rapid and reliable data compared to the plate culture colony counting method.

참고문헌
  • 1. Akin EW, Hoff JC, Lippy EC. 1982 Waterborne outbreak control: which disinfectant? [Environ. Health. Perspect.] Vol.46 P.7-12 google
  • 2. Hwang MG, Katayama H, Ohgaki S. 2006 Effect of intracellular resuscitation of Legionella pneumophila in Acanthamoeba polyphage cells on the antimicrobial properties of silver and copper. [Environ. Sci. Technol.] Vol.40 P.7434-7439 google
  • 3. Lebaron P, Catala P, Parthuisot N. 1998 Effectiveness of SYTOX green stain for bacterial viability assessment. [Appl. Environ. Microbiol.] Vol.64 P.2697-2700 google
  • 4. Barer MR, Harwood CR. 1999 Bacterial viability and culturability. [Adv. Microb. Physiol.] Vol.41 P.93-137 google
  • 5. Amor KB, Breeuwer P, Verbaarschot P 2002 Multiparametric flow cytometry and cell sorting for the assessment of viable, injured, and dead bifidobacterium cells during bile salt stress. [Appl. Environ. Microbiol.] Vol.68 P.5209-5216 google
  • 6. Alvarez-barrientos A, Arroyo J, Canton R, Nombela C, Sanchez-Perez M. 2000 Applications of flow cytometry to clinical microbiology. [Clin. Microbiol. Rev.] Vol.13 P.167-195 google
  • 7. Oh JW. 2004 Evaluation of bacterial regrowth potential in drinking water system using cell cycle parameters google
  • 8. Bunthof CJ, Bloemen K, Breeuwer P, Rombouts FM, Abee T. 2001 Flow cytometric assessment of viability of lactic acid bacteria. [Appl. Environ. Microbiol.] Vol.67 P.2326-2335 google
  • 9. Haugen EM, Cucci TL, Yentsch CM, Shapiro LP. 1987 Effects of flow cytometric analysis on morphology and viability of fragile phytoplankton. [Appl. Environ. Microbiol.] Vol.53 P.2677-2679 google
  • 10. Gregori G, Citterio S, Ghiani A 2001 Resolution of viable and membrane-compromised bacteria in freshwater and marine waters based on analytical flow cytometry and nucleic acid double staining. [Appl. Environ. Microbiol.] Vol.67 P.4662-4670 google
  • 11. Bowler PG, Duerden BI, Armstrong DG. 2001 Wound microbiology and associated approaches to wound management. [Clin. Microbiol. Rev.] Vol.14 P.244-269 google
  • 12. Davey HM, Kell DB. 1996 Flow cytometry and cell sorting of heterogeneous microbial populations: the importance of single- cell analyses. [Microbiol. Rev.] Vol.60 P.641-696 google
  • 13. Hiraoka Y, Kimbara K. 2002 Rapid assessment of the physiological status of the polychlorinated biphenyl degrader Comamonas testosteroni TK102 by flow cytometry. [Appl. Environ. Microbiol.] Vol.68 P.2031-2035 google
  • 14. Jepras RI, Carter J, Pearson SC, Paul FE, Wilkinson MJ. 1995 Development of a robust flow cytometric assay for determining numbers of viable bacteria. [Appl. Environ. Microbiol.] Vol.61 P.2696-2701 google
  • 15. Porter J, Edwards C, Pickup RW. 1995 Rapid assessment of physiological status in Escherichia coli using fluorescent probes. [J. Appl. Bacteriol.] Vol.79 P.399-408 google
  • 16. Veal DA, Deere D, Ferrari B, Piper J, Attfield PV. 2000 Fluorescence staining and flow cytometry for monitoring microbial cells. [J. Immunol. Methods] Vol.243 P.191-210 google
  • 17. Hoefel D, Grooby WL, Monis PT, Andrews S, Saint CP. 2003 A comparative study of carboxyfluorescein diacetate and carboxyfluorescein diacetate succinimidyl ester as indicators of bacterial activity. [J. Microbiol. Methods.] Vol.52 P.379-388 google
  • 18. Szeto L, Shuman HA. 1990 The Legionella pneumophila major secretory protein, a protease, is not required for intracellular growth or cell killing. [Infect. Immun.] Vol.58 P.2585-2592 google
  • 19. Hwang MG, Katayama H, Ohgaki S. 2006 Accumulation of copper and silver onto cell body and its effect on the inactivation of Pseudomonas aeruginosa. [Water Sci. Technol.] Vol.54 P.29-34 google
  • 20. De Kievit TR, Parkins MD, Gillis RJ 2001 Multidrug efflux pumps: expression patterns and contribution to antibiotic resistance in Pseudomonas aeruginosa biofilms. [Antimicrob. Agents Chemother.] Vol.45 P.1761-1770 google
  • 21. Auty MA, Gardiner GE, McBrearty SJ 2001 Direct in situ viability assessment of bacteria in probiotic dairy products using viability staining conjunction with confocal scanning laser microscopy. [Appl. Environ. Microbiol.] Vol.67 P.420-425 google
  • 22. Teitzel GM, Parsek MR. 2003 Heavy metal resistance of biofilm and planktonic Pseudomonas aeruginosa. [Appl. Environ. Microbiol.] Vol.69 P.2313-2320 google
OAK XML 통계
이미지 / 테이블
  • [ Fig. 1. ]  Flow cytometry cytograms of Pseudomonas aeruginosa. Red fluorescent signal is come out from the molecular probe, propidium iodide, and green fluorescent signal is come out from SYTO 9.
    Flow cytometry cytograms of Pseudomonas aeruginosa. Red fluorescent signal is come out from the molecular probe, propidium iodide, and green fluorescent signal is come out from SYTO 9.
  • [ Fig. 2. ]  Correlation of the number of bacteria detected by colony forming unit (CFU) counting with multiparametric flow cytometry that the samples were double staining with SYTO 9 and propidium iodide. The symbol (■) indicated the data of Pseudomonas aeruginosa and the symbol (○) indicated the data of Escherichia coli.
    Correlation of the number of bacteria detected by colony forming unit (CFU) counting with multiparametric flow cytometry that the samples were double staining with SYTO 9 and propidium iodide. The symbol (■) indicated the data of Pseudomonas aeruginosa and the symbol (○) indicated the data of Escherichia coli.
  • [ Fig. 3. ]  Correlation of the number of model bacteria detected by colony forming unit (CFU) counting with multiparametric flow cytometry that the samples were double staining with SYTO 9 and propidium iodide when silver and copper were used as disinfectants in synthetic drinking water. The symbol (■) indicated the data of Pseudomonas aeruginosa and the symbol (○) indicated the data of Escherichia coli.
    Correlation of the number of model bacteria detected by colony forming unit (CFU) counting with multiparametric flow cytometry that the samples were double staining with SYTO 9 and propidium iodide when silver and copper were used as disinfectants in synthetic drinking water. The symbol (■) indicated the data of Pseudomonas aeruginosa and the symbol (○) indicated the data of Escherichia coli.
(우)06579 서울시 서초구 반포대로 201(반포동)
Tel. 02-537-6389 | Fax. 02-590-0571 | 문의 : oak2014@korea.kr
Copyright(c) National Library of Korea. All rights reserved.