The 4 major rivers restoration project in Korea includes construction of 16 in-stream weirs, and removal of 0.5 billion m3 of sediment to increase the storage and flood control capacity of major rivers in the country [1, 2].
In the Nakdong River, 8 in-stream weirs will be constructed and 0.4 billion tons of sediment will be removed by the project. This project will change hydrodynamics and water quality characteristics of the river, significantly, due to the construction of in-stream structures. Therefore, it is necessary to evaluate any environmental changes due to the project and to develop management strategies for possible side effects. Water quality models can be used effectively to predict future conditions of the water bodies, and thus, to support the water quality management related decision making processes [3, 4].
While many water quality models are available [5], this study adopted the most advanced 3-dimensional (3D) hydrodynamic and water quality modelling approach. The Water Quality Analysis Simulation Program (WASP) model by US Environmental Protection Agency (USEPA) was used to predict the dynamic water quality changes [6-10]. The 3D hydrodynamic model, the Environmental Fluid Dynamics Code (EFDC) model was used to consider the changes in hydrodynamic conditions due to the project [11-14]. Hydrodynamic information, generated by the EFDC model, was linked to the WASP model for water quality modelling [15-19]. Special attention was paid in analyzing a chlorophyll-a (Chl-a) concentration changes or phytoplankton growth dynamics throughout the river. In this analysis, all weirs are assumed to be fixed overflow type, due to the limited information about the weirs. Combination of the fixed weir and few different movable weirs will be used in real operation, including hydropower generation.
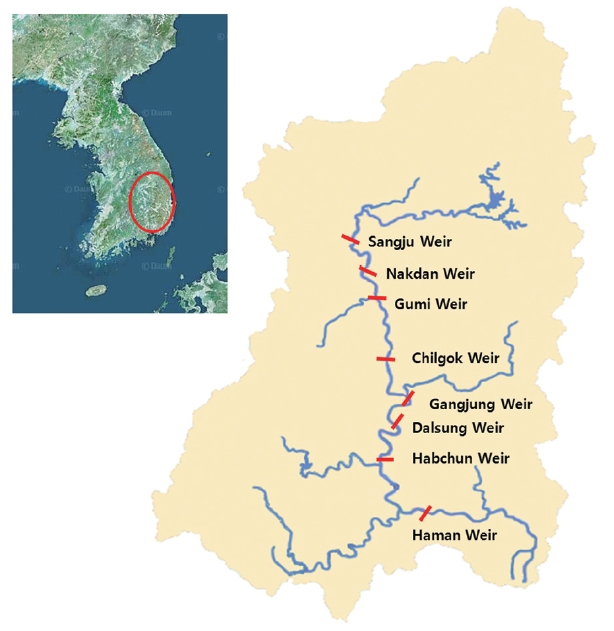
The 525 km Nakdong River is the longest river in the South
Korea, and has the second largest basin area (23,384 km2) in the country. Fig. 1 shows the locations of the Nakdong River and the weir construction sites. The Nakdong River originates from the Taebeak Mountains, the middle eastern part of South Korea, and flows to the south through the gates of the Nakdong Estuarian Dam. Major tributaries for the river are the Yeong River, the Geumho River, the Miryang River, and the Nam River. The Nakdong River has been an important source of drinking, industrial and agricultural water in the vicinity of the areas along the river, including Busan, the Korea’s second largest city. Therefore, there have been number of studies for this river [20-24]. In this study, a 334-km long river section between the Andong Dam to the Nakdong Estuarian Dam was selected as a study site. The selected river was divided into eleven reaches to predict the effect of weir construction and dredging. Each reach was calculated in series downward.
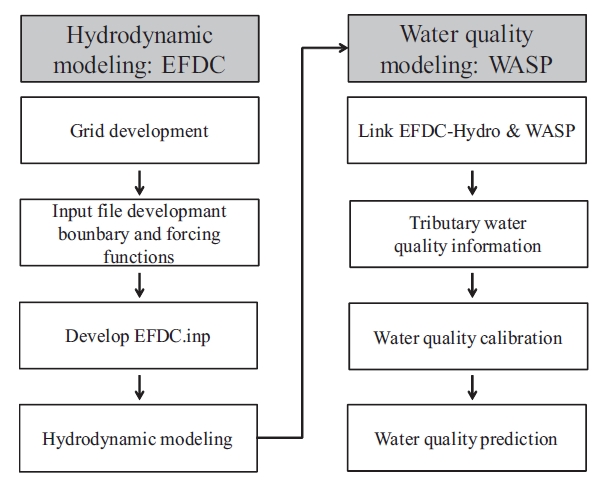
The EFDC model and the WASP7 model are used in series for modeling the physical, chemical and biological dynamics of the Nakdong River, as shown in Fig. 2. The EUTRO, a water quality module in the WASP was selected to model a behavior of phytoplankton growth. Input data were collected from the Korean governmental database systems, including the Ministry of Land, Transportation and Maritime Affairs, K-water, the Korean Meteorological Agency, and the Ministry of Environment.
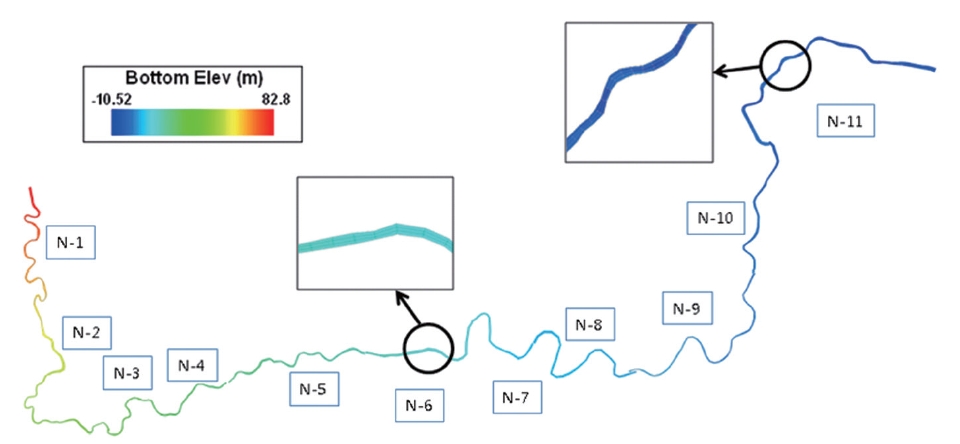
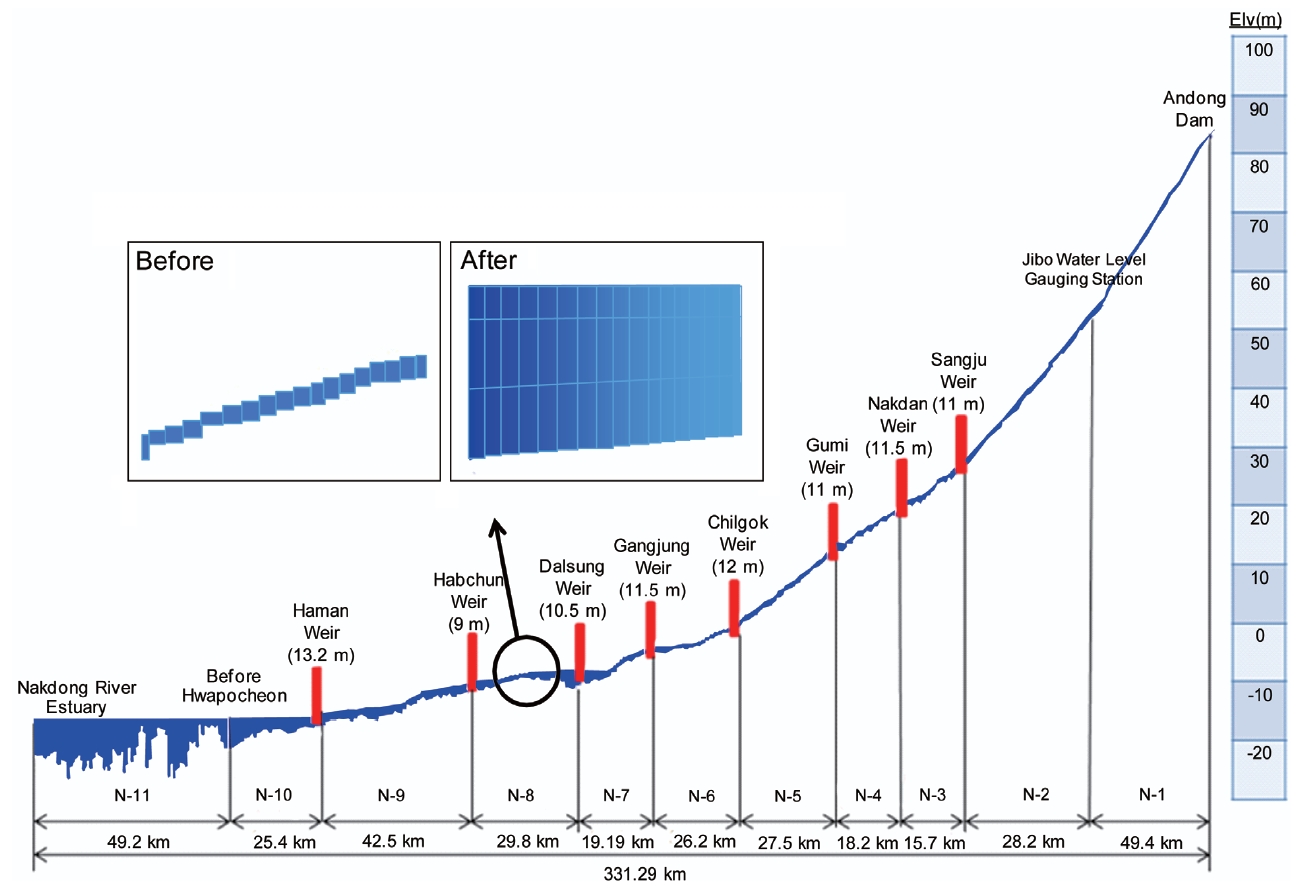
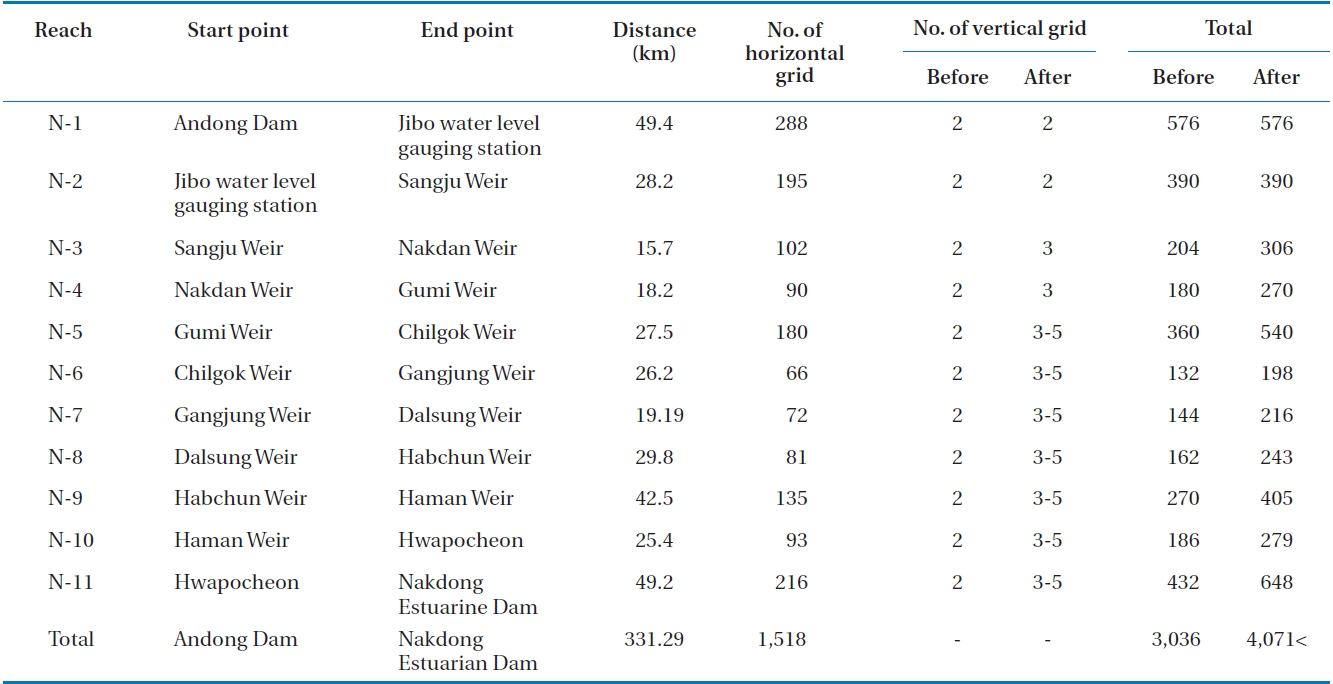
Figs. 3 and 4 show horizontal and vertical grid systems, respectively, and details of the selected reaches developed for this study. Laterally, water body was divided into three parts to account for the effect of tributary inflow mixing. Vertically, water body was divided into 3-5 layers to consider the temperature and light effect. Table 1 shows the detailed information of the grid system developed in this study.
A total of 92 small rivers were identifiable as tributaries in the Nakdong River. Unfortunately, only 21 tributaries are regularly monitored by the Ministry of Environment, Korea. For this reason, it was assumed that 71 non-monitored tributaries have the same water quality to the data nearest monitoring station, respectively, considering the 21 monitored stations, as shown
[Table 1.] Physical characteristic and number of grids in the Nakdong River

Physical characteristic and number of grids in the Nakdong River
in Table 2. However, only monthly monitored water quality data were available in the monitoring 21 stations. To include the nonpoint source load effect by the rainfall, event mean concentration (EMC) value for each station, during the rainfall events, was estimated using of the 8-day interval Korean total maximum daily load (TMDL) water quality data. Weighted monthly average concentration [25] for each tributary was estimated, using the monthly monitored data and raining period EMCs. Rainfall record data were obtained from Korea Meteorological Administration.
[Table 2.] List of selected 21 major tributaries of the Nakdong River
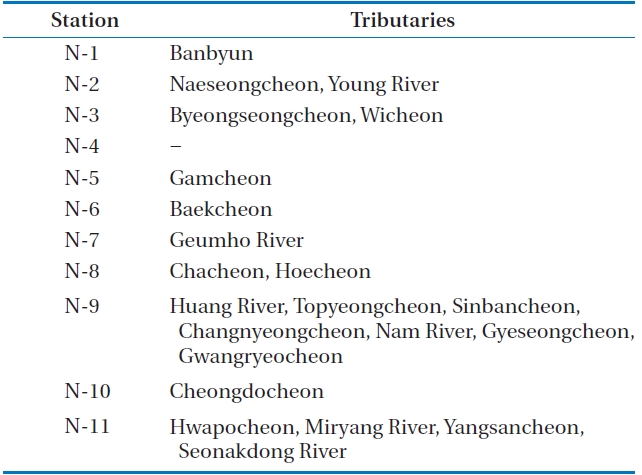
List of selected 21 major tributaries of the Nakdong River
Since not all the tributary flow rates are monitored, it was also necessary to estimate the monthly flow rate of the tributaries of the Nakdong River. Watershed area based allocation method [24] was utilized by using the difference in the flow rates between upstream and down-stream locations in the Nakdong River. Flow rates in the Nakdong River were collected from the Ministry of Land, Transportation and Maritime Affairs, Korea.
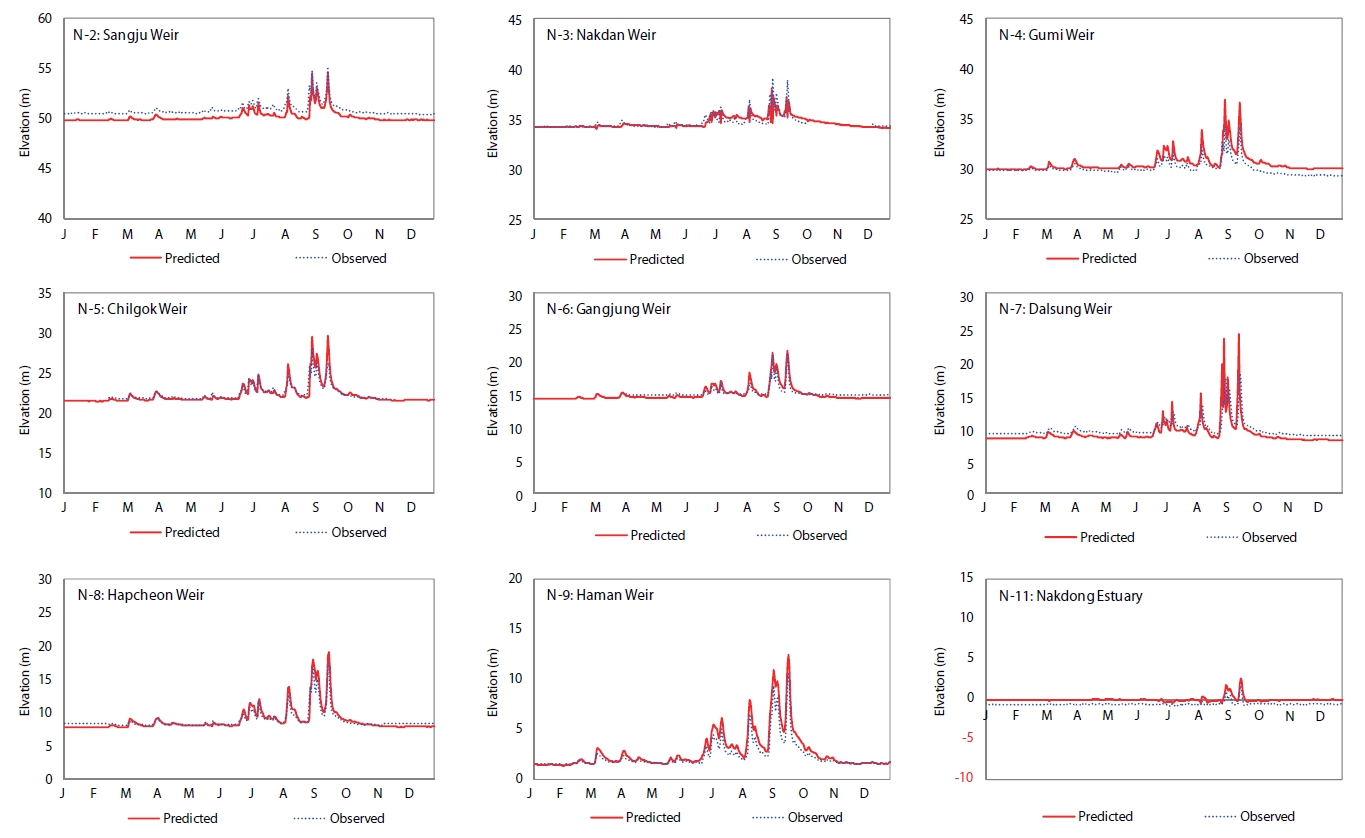
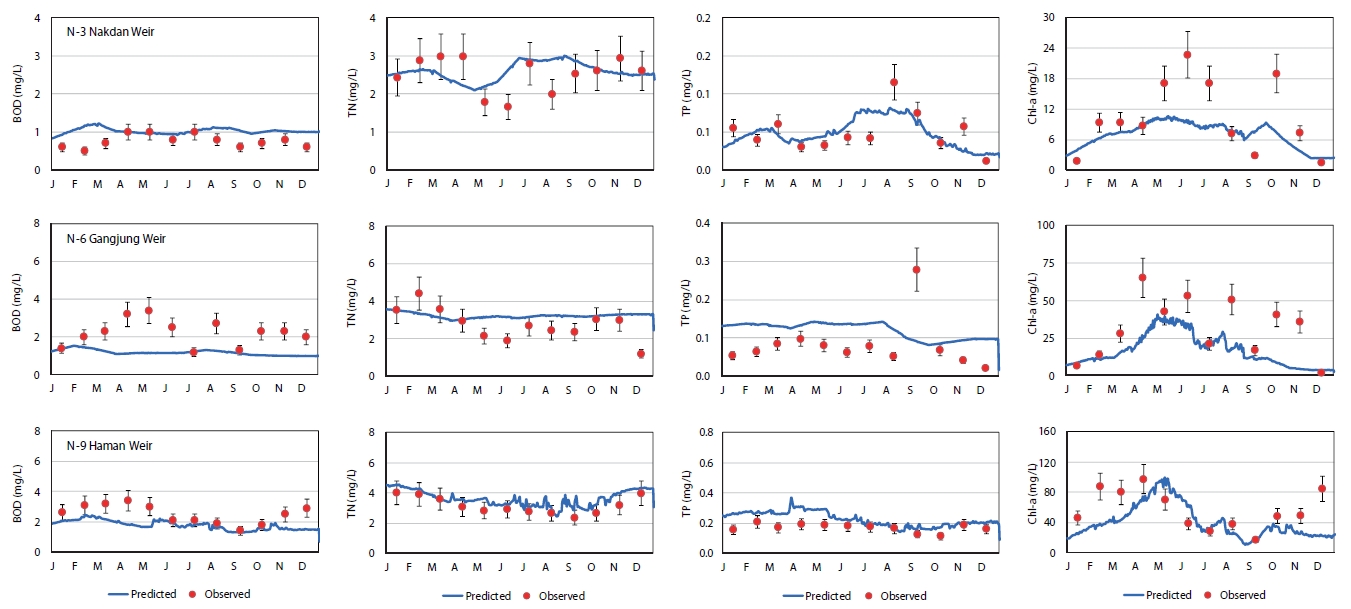
Hydrodynamic calibrations were performed by using the water level data of the Nakdong River, as shown in Fig. 5. Water quality calibration were performed for biochemical oxygen demand (BOD5), total nitrogen (TN), total phosphorous (TP), and Chl-a concentrations at the selected sites, as shown in Fig. 6.
3.1. Changes in Water Depth and Residence Time
Tables 3 and 4 show the changes in water depth and residence time in each weir and month in a year expressed as an increased ratio due to the project in this study. However, there can be a difference in this ratio, as there have been few changes during construction of the weirs. According to the initial plan, water depth and hydraulic residence time increased 2 to 21 times after the project. The greatest change in water depth was observed in the Gumi Weir, followed by the Gangjung Weir and the Chilgok Weir. The Nakdong Estuarine Dam showed the least changes of water
[Table 3.] Ratio of water depth due to 4 major river restoration project
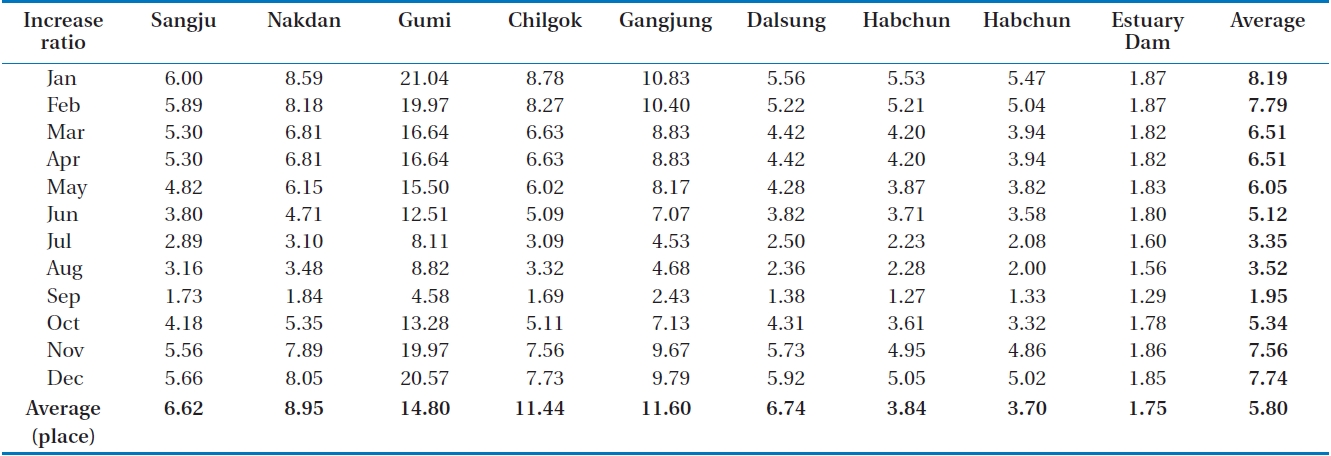
Ratio of water depth due to 4 major river restoration project
[Table 4.] Increase ratio of residence time due to 4 major river restoration project
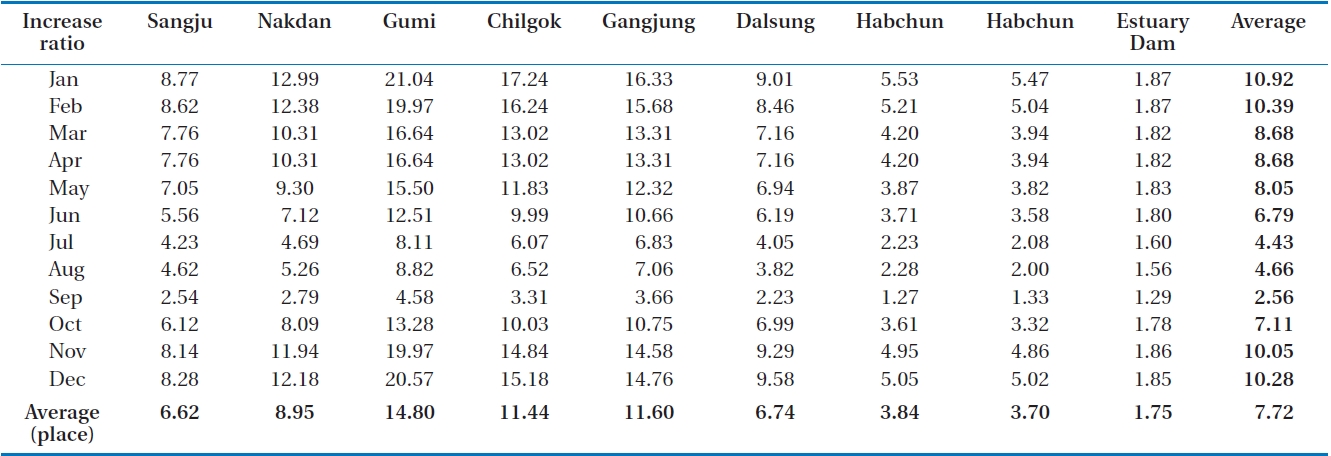
Increase ratio of residence time due to 4 major river restoration project
depth and residence time. As shown in both tables, the changes in water depth and residence time become significant for low water periods, or during the dry season (Jan, Feb, Nov, and Dec) and less significant during the flood season or wet season (Jul, Aug, and Sept). Average water depth of the Nakdong River increased from 5.8 times, as shown in Table 3, while the mean residence time increased from 7.72 times, as shown in Table 4.
3.2. Chl-a Concentration and Limiting Factor Analysis
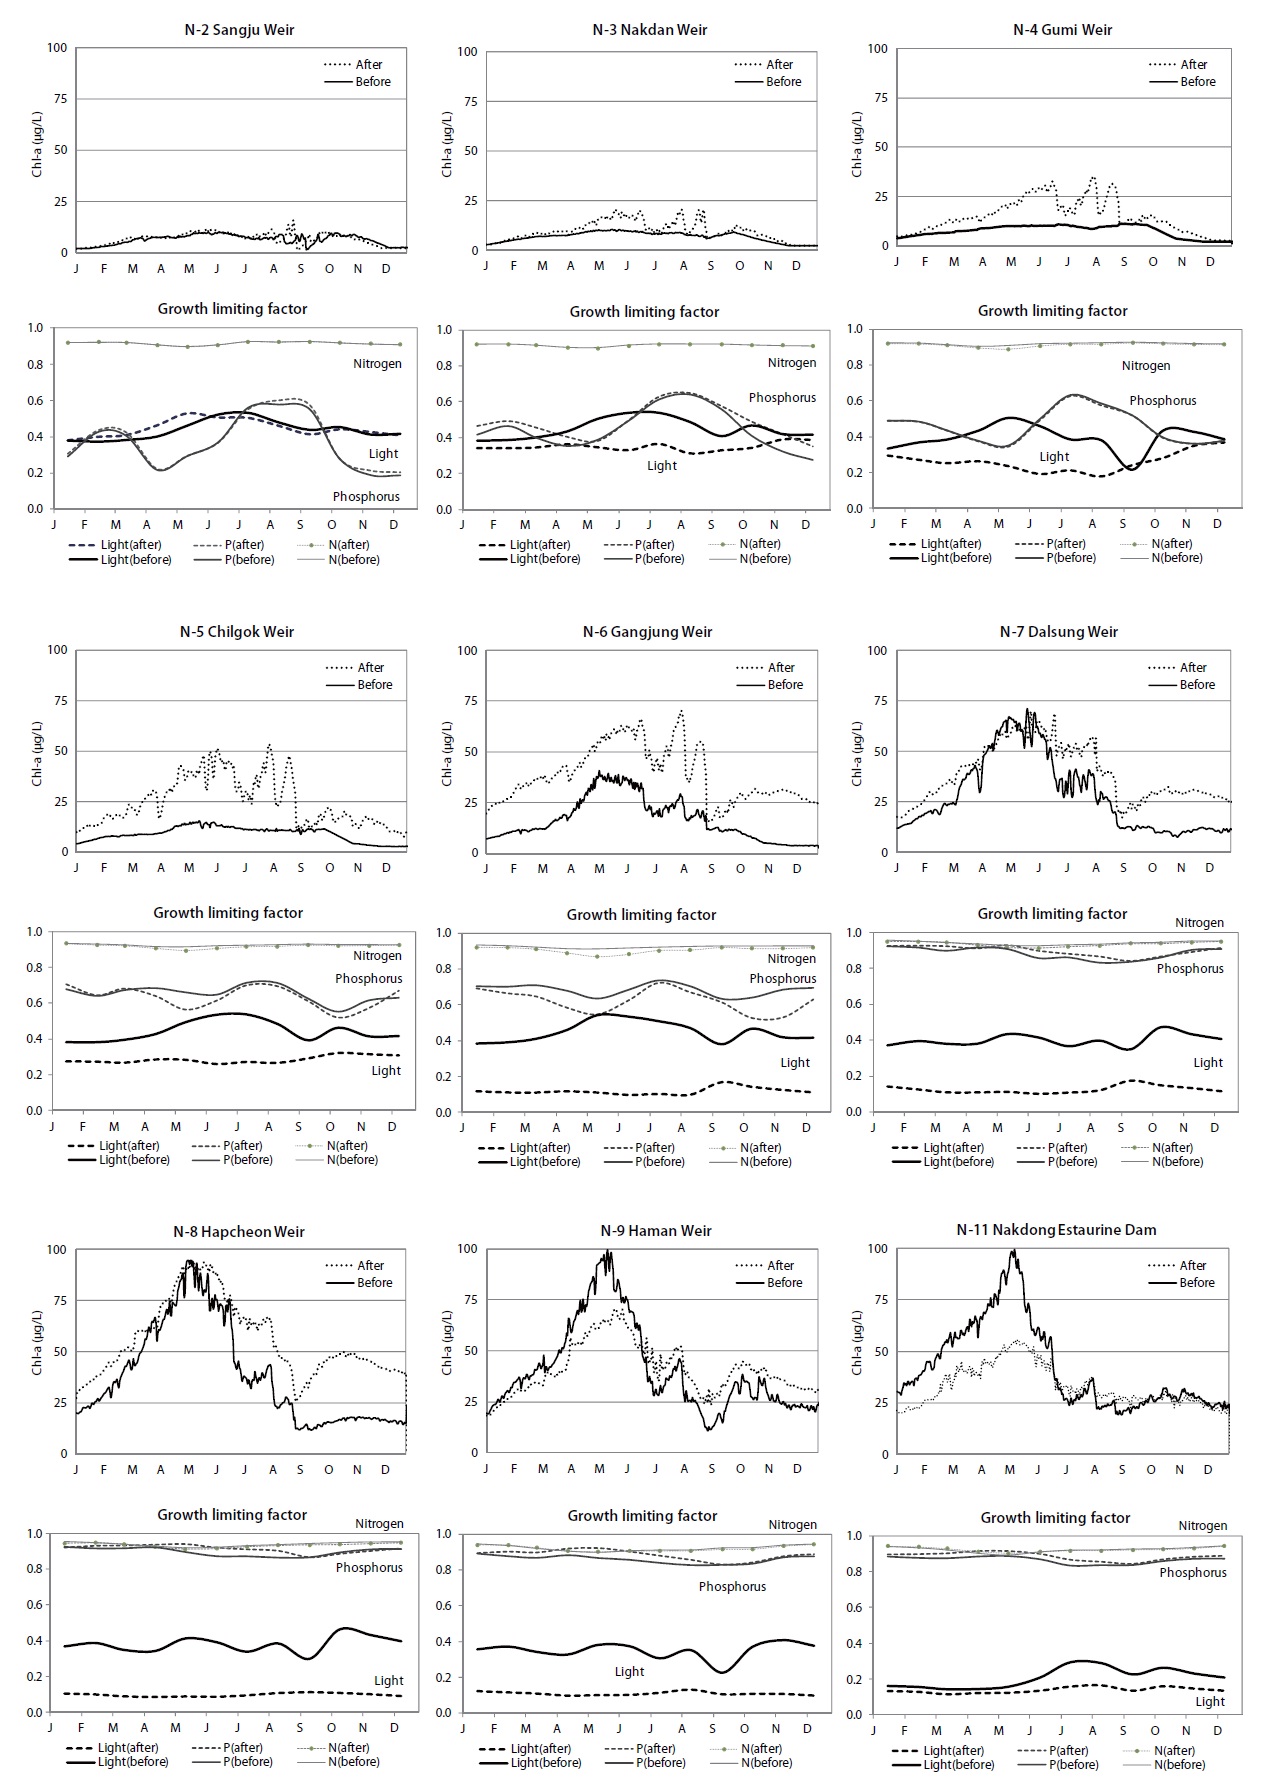
Phytoplankton growth is a complicated function of nutrient concentrations, solar energy, temperature, natural enemies and others [26]. Due to the 4 major river restoration project, light condition and water velocity in the river will become different, significantly. Fig. 7 shows the changes in Chl-a concentrations and the growth limiting factors for phytoplankton in the selected locations in the Nakdong River.
In the Sangju Weir, the most upper stream area, Chl-a concentrations and growth limiting factors did not show any significant changes. From the Nakdan Weir to the Gangjung Weir, relatively upper stream areas, significant increase in Chl-a concentrations, due to the project, were observed. However, from the Dalsung Weir to the Nakdong Estuarine Dam, relatively downstream areas, Chl-a concentration change pattern, due to the project, are quite different. In these weirs, Chl-a concentrations are lower or similar, compared to those before the project. As shown in Tables 3 and 4, from the Dalsung Weir, an increase ratio of residence time became less significant than the upper stream areas of the river. It is believed that the combined effect of the increase in water depth and residence time plays the most important role in Chl-a concentration changes in the river. Jones et al. [26] reported that hyper-eutrophic lakes show less sensitive response to nutrient concentration changes. It is believed that the light limiting factors, due to the increased depth by the project, become a dominant factor affecting phytoplankton growth.
Phytoplankton growth characteristics in the Nakdong River, due to the 4 major rivers restoration project, were evaluated by using a combination of EFDC 3D hydrodynamic model and WASP water quality model. The 334 km long section of the Nakdong River between the Andong Dam to the Nakdong River Estuary was divided into eleven reaches for modelling. Lateral and vertical directions also were considered for 3D analyses. Input data were collected from the Korean governmental database systems, including, the Ministry of Land, Transportation and Maritime Affairs, K-water, the Korean Meteorological Agency, and the Ministry of Environment.
Simulated results showed overall decreases in BOD5 concentration, overall increase Chl-a concentration, while TN and TP concentrations did not show significant changes. Decrease in BOD5 seems to be influenced by the increase in residence time, which may enhance the decay of organic material. However, Chla concentration change patterns are different, dependent on the location from headwater point.
Growth of algae or Chl-a concentration in water is influenced by the solar energy, water temperature, and available nutrients concentrations. Increase in Chl-a concentration in the upper and middle part of the Nakdong River was heavily influenced by the phosphorus availability. As TP and Chl-a concentrations become higher, Chl-a concentration, due to the project, did show less significant changes, relative to the upper stream areas where those concentrations are lower. For the lower part of the Nakdong River, where Chl-a and TP concentration are the highest, Chl-a concentration became lower due to the project. Therefore, changes in Chl-a concentration were different, dependent on the nutrient concentrations and phytoplankton growth conditions. Changes in Chl-a concentration due to the restoration project seems to be combined results of increase in the residence time, decrease in light availability and nutrient concentrations. Nutrient limitation seems to be stronger in the upper stream area of the Nakdong River, where the nutrient concentrations are lower. Light limitation seems to be dominating in the lower part of the Nakdong River, where the nutrient concentrations are extremely higher.