Highly urbanized coastal systems receive natural and anthropogenic suspended particulate matters from various sources including surface runoff, sewage and other near-shore submarine discharges, air pollution fall-out, phytoplankton, and near-bed resuspended sediments. Consequently, they play an important role in many processes of environmental concern, and in many cases its understanding requires knowledge of the origin and the magnitude of their sources potentially responsible for the impairment. Nevertheless, identification of the suspended particle source remains challenging in urban coastal systems because the fate of particulates depends on a variety of physical and biological processes, which are highly dynamic and complex.
Fundamentally, suspended particle transport to the ocean depends on particle size [1-4] but its understanding has still not sufficiently evolved to develop kinetic models [5]. Without a strong predictive framework,
This study proposes the possibility of using empirical orthogonal function (EOF) analysis and an entropy-based parameterization (Shannon entropy) on PSD to detect suspended particle sources in a coastal ocean system. The EOF analysis identifies the dominant spatial pattern in a PSD data set and how these spatial patterns are distributed in particle size. Shannon entropy is applied to parameterize the heterogeneity of PSDs. These approaches described in this study are complementary to a conventional observation approach for identifying particle sources on the basis of beam attenuation, salinity, and chlorophyll fluorescence [15-18].
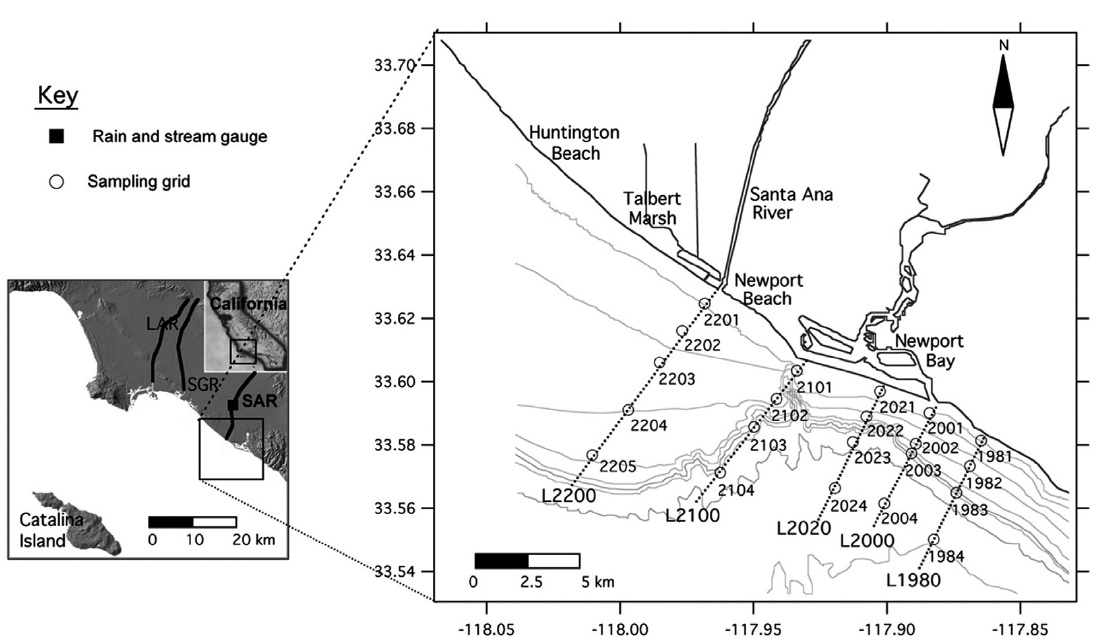
The study site is a northwest-southeast striking section of the Pacific Ocean coastline, located offshore of Huntington Beach and Newport Beach in Orange County, California (Fig. 1). The main terrigenious sources of suspended particles include dry weather and storm-generated runoff from the Santa Ana River, Talbert Marsh, and Newport Bay outlets, all of which discharge directly into the study area [19-21]. In addition, coastal currents may bring suspended particles into the study area from other large river outlets located up- or down-coast, such as the Los Angeles River and San Gabriel River (LAR and SGR in inset, Fig. 1) [21]. These riverine sediment discharges could act as a potential cause for surf zone water quality failures in this region [21]. Throughout a set of two offshore cruises during the storm season, data were collected from a grid of 21 stations distributed over a 60 km2 area offshore from both Huntington Beach and Newport Beach (red triangles in Fig. 1).
2.2. Shipboard In Situ Measurements
The offshore monitoring grid (Fig. 1) was sampled during two separate cruises, roughly following two storm events.
2.3. EOF Analyses of Particle Size/Space Variability
Particle volume distribution data are decomposed using EOF analysis [23, 24] in order to investigate spatial patterns of PSD. An EOF analysis organizes a space/particle-size series into a set of orthogonal functions, which compactly describe the covariability of the data set. This is provided in the form of a ranked set of maps whose amplitude varies in particle size or the source of the sediment particle in regards to a mean state. The ranking provides a measure of the fraction of total variance explained by each EOF mode. Typically, the lowest modes explain much of the variance and these patterns of spatial/particle size are the easiest to interpret.
All particle volume distributions are standardized with the orthogonal variables and the variance-covariance matrix in order to make them compatible. EOF analysis involves the following
steps: 1) organization of the data into a data matrix,
Shannon entropy [25] has been proposed as a measure of soil structure or sediment particle size heterogeneity [26-28]. The Sannon entropy (
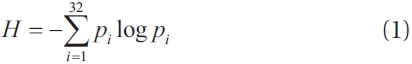
where
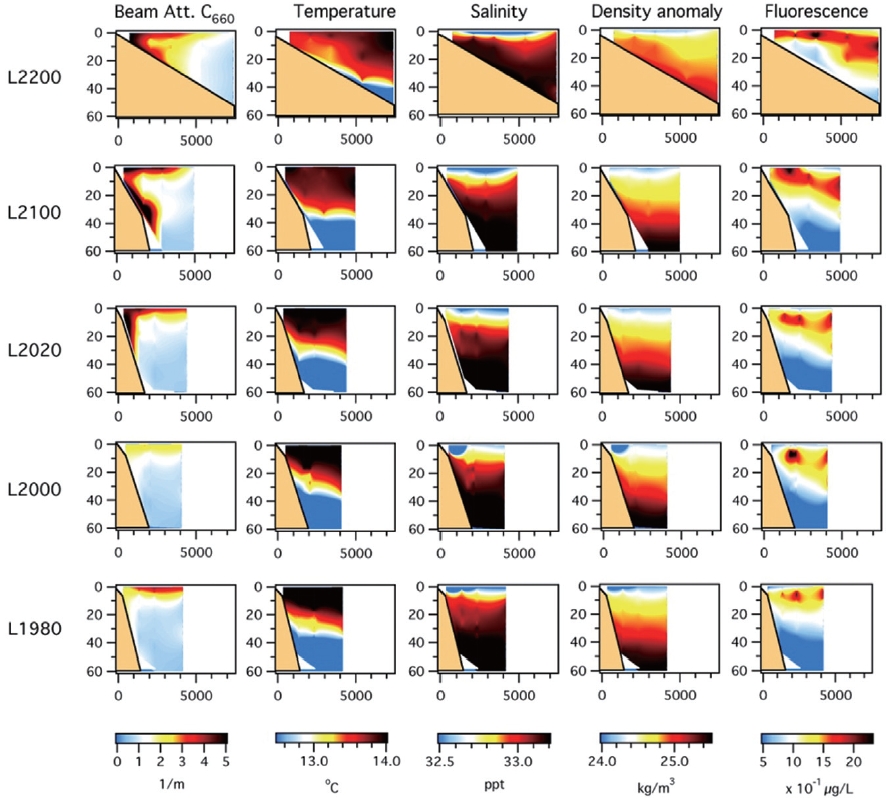
On a year-round basis, most of sediment loads from the Santa Ana Riverwere discharged to the ocean during the study period. Eighty-nine percent of the total annual flow occurred and 96% of the total annual sediment loads was discharged [29]. Water column profiles of the offshore particle size spectra and CTD data acquired during the two cruises are shown in Figs. 2 and 3, respectively.
During the first cruise, two separated runoff plumes near the Santa Ana River outlet are observed. One plume is ejected offshore by a momentum jet and slowly drifts along the surface [21] as indicated by elevated beam attenuation (more than 2/m), depressed salinity (<33.1 ppt), and the density anomaly (24.6 kg/ m3) (the sampling lines L2200, L2100, and L2020 in Fig. 2). The other plume is observed onto continental shelves along the nearbottom layer (more than 7 km along L2200) and down-coast (L2100 and L2100). However, any direct entrainment of river freshwater into the near-bottom plume is not observed since water salinity, temperature, and the density anomaly do not become agitated in water column profiles. Also, high florescence chlorophyll concentrations are observed at the surface nearshore and extend farther out offshore below the surface and are
all associated with warmer temperature (>12.6℃) and the lower density anomaly (<24.8 kg/m3).
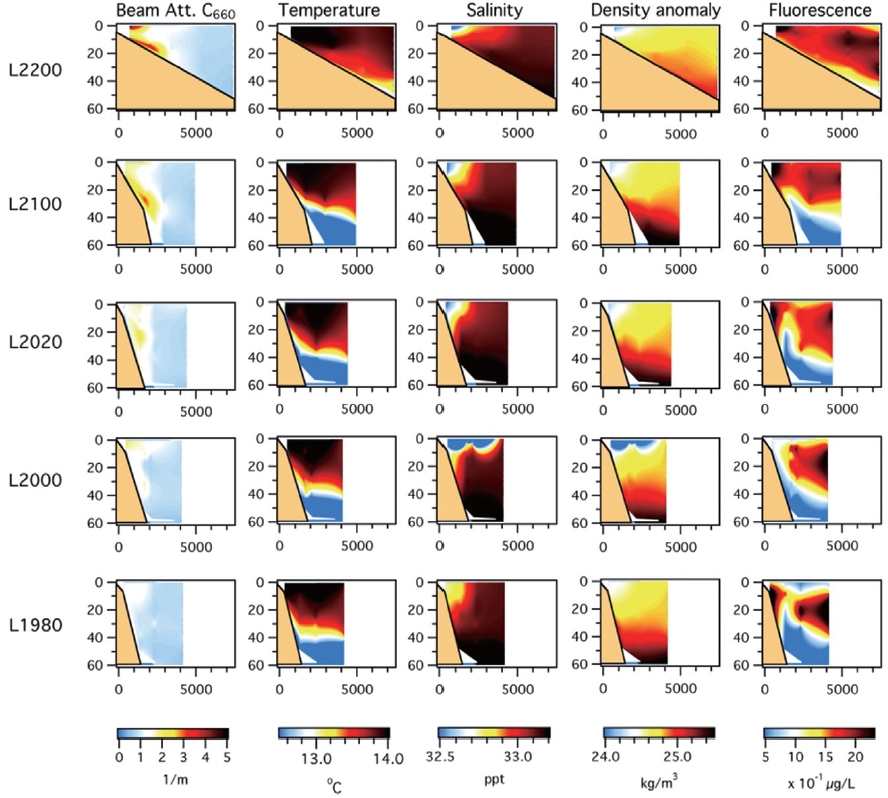
During the second cruise, the impacts of storm flow diminish significantly in size, but beam attenuation still remains high near the Santa Ana River outlet (Fig. 3). The near-surface plume becomes much more drawn-out and drops due to decreasing runoff discharge and sediment settling. The near-bottom plume also decreases in size with time and entrains within 3 km from the Santa Ana River outlet. Florescence chlorophyll concentrations increase more and disperse farther out offshore and are still associated with warmer temperature and the lower density anomaly.
Another surface particle turbidity plume is evident offshore from the Newport Bay outlet. The runoff outflow from the Newport Bay outlet generates a significant increase in the concentration of large particles at the surface, as evidenced by elevated beam attenuation, depressed salinity, and the density anomaly (the fourth row in Figs. 2 and 3). This turbidity plume is dispersed further into a large area by a jet-like advection pattern.
3.2. EOF Analyses and Heterogeneity of PSD
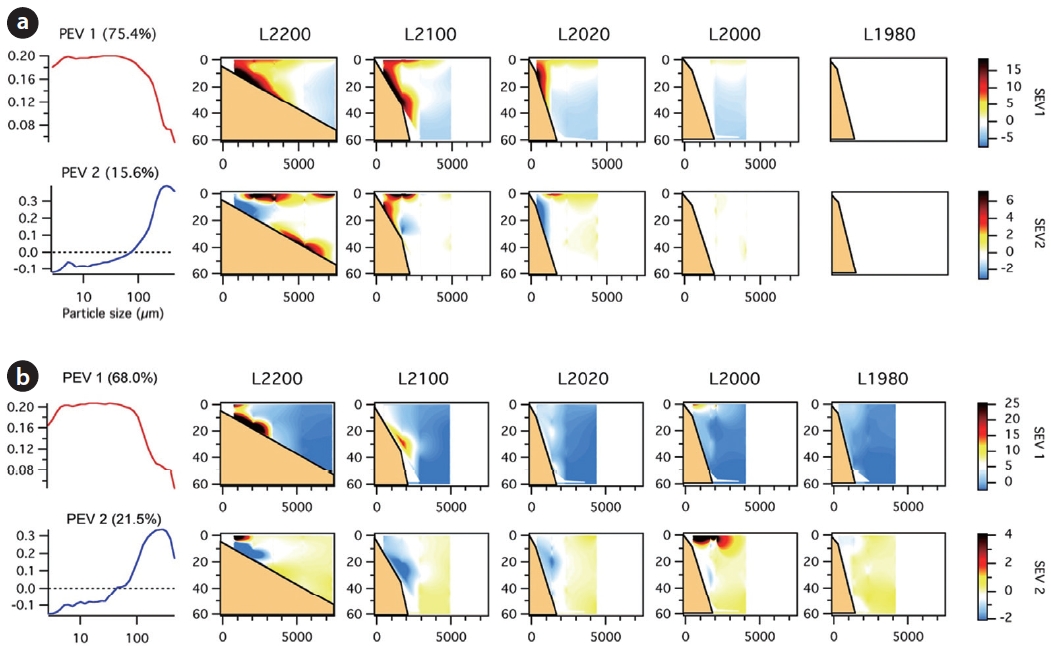
To identify the dominant particle size spectra pattern in the spatial sampling grid, EOF analyses are carried out for the complete set of particle volume distribution data acquired during two sequent sampling cruises. The first two principal EOF modes computed are presented as particle sizemode (first column) and spatial mode (the second to fifth columns) in Fig. 4. The remaining higher modes are not investigated further because they con-tain less than 10% of the total variance and the third particle size mode captures only less than 50% of the remaining variance.
During the first cruise, the first eigenvalue of the PSD for the EOF represents 75.4% of the PSD data variance and the first particle size mode is dominant in particle sizes less than 100 μm (red curve, first column in Fig. 4(a)). Accordingly, the first spatial mode is positive within the surface runoff plume and appears to correspond to the spatial pattern of beam attenuation (the first column panel in Fig. 2). Its maximum magnitudes occurr at the near-bottom of stations 2201, 2202, 2101, and 2102. The second eigenvalue contains 15.6% of the variance, and its amplitude function is characterized by two different ranges at the size spectrum, negative values in the <75 μm size bins and positive values in the ≥75 μm size bins (blue curve, first column in Fig. 4(a)). Positive magnitudes of the second spatial EOF mode occur in two separate plumes; the near-surface plume along sampling lines L2200, L2100, L2020 and the near-bottom plume in L2200 (red-colored area in the second low panel in Fig. 4(a)) while negative magnitudes of the second mode occur in the near-bottom plume at sampling stations 2201 and 2202 (blue-colored area in Fig. 4(a)).
During the second cruise, the first EOF mode contains 68.0% of the variance and is all positive. Its highest magnitudes (>20) occur along the near-bottom of stations 2201, 2202, and 2203, and significant high magnitudes (>10) also occur at the near-surface of stations 2201, 2202, and 2001, and the near-bottom of stations 2101, 2102, and 2103 (first low panel in Fig.4(b)). Its mode is also similar to the beam attenuation mode (Fig. 3) and shows a decrease of the particle concentration on the near-surface
plume with time and transport of the near-bottom plume downcoast. The second EOF mode (21.5% of the variance) represents two different ranges by particle size spectrum at 42 μm. Particles less than 42 μm are dominant in the near-bottom plumes at stations 2201, 2102, 2103, 2101,2102, 2103, 2021, and 2022. The positive values represent particles larger than 42 μm on the surface around stations 2201, 2001, and 2002.
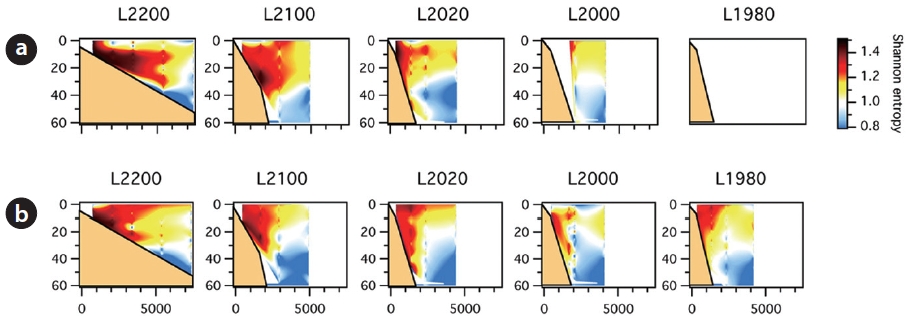
On the other hand, Shannon entropy calculated from particle volume distribution exhibits variability depending on the heterogeneity of particle size distribution (Fig. 5). High Shannon entropy index (more than 1.2) attenuate the high concentration of relatively fine particles compared with the ambient ocean water, while low Shannon entropies (less than 1.0) correspond directly to the surface runoff-impacted upper layer near the surface where large particles are dominant (stations 2201?2205, 2101?2203, and 2022 during the first cruise; stations 2201?2202, 1981?1984 during the second cruise).
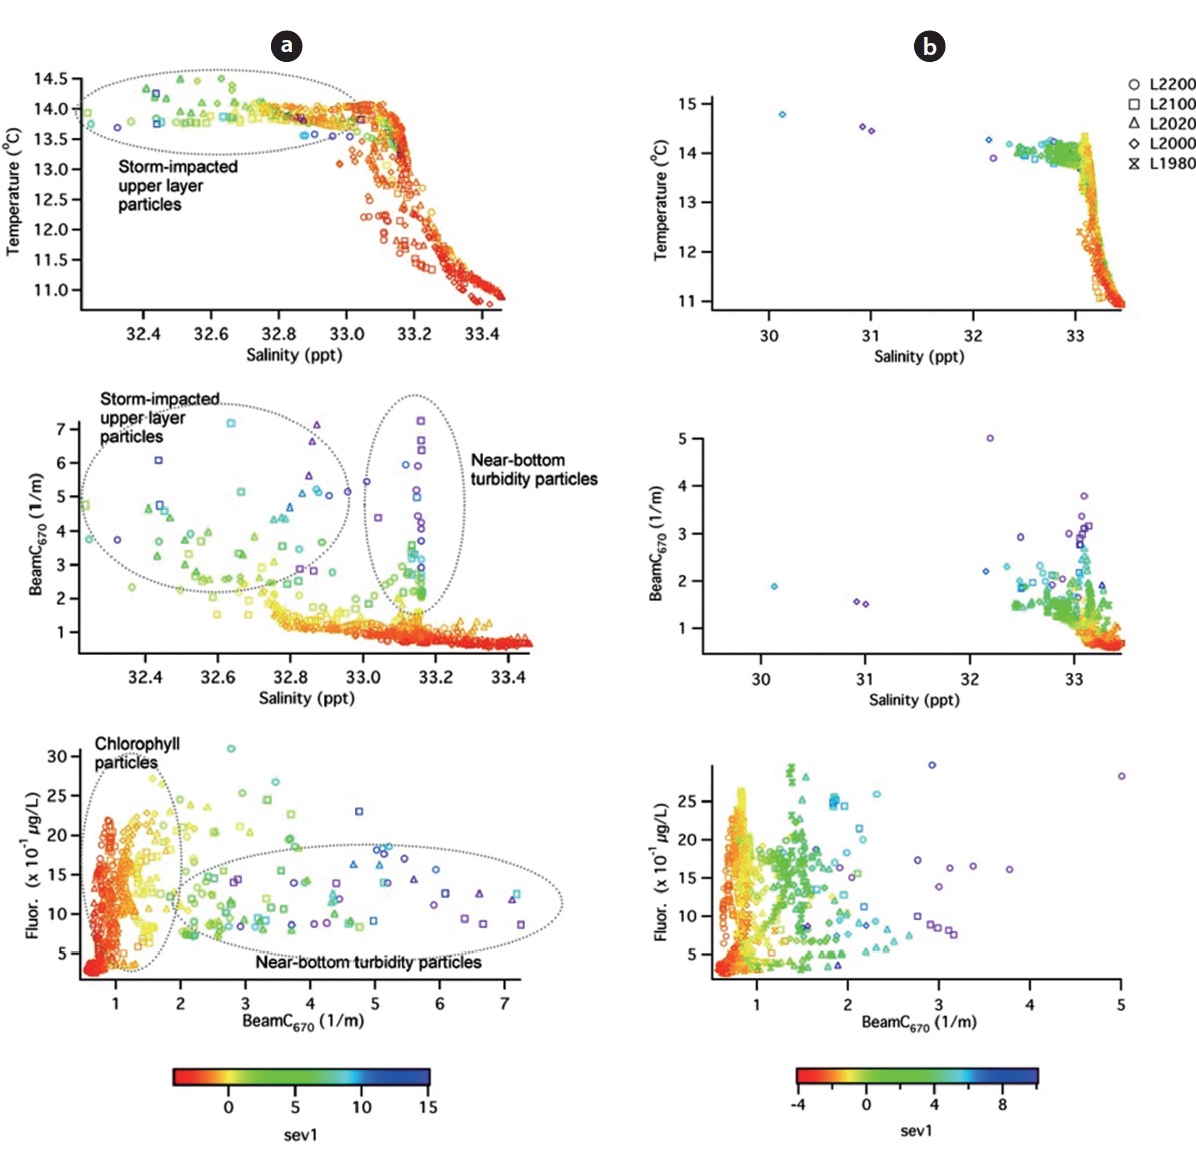
Empirical particle size distribution indices resolve the origin of particle plume and its evolution pattern in response to surface runoff discharge events. The first EOF spatial mode itself reveals the structure of the particle plumes as a “turbidity mode”. Two separate plumes (near-surface and near-bottom plumes) can be distinguished by the integrated observational approach using the diagrams of temperature-salinity, beam attenuation-salinity, and fluorescence chlorophyll-beam attenuation (Fig. 6). Note that the potential surface runoff impact from the Newport Bay outlet is only considered during the second cruise because of the data loss on L2000 and L1980 during the first cruise.
During the first cruise (left panel in Fig. 6) two major regions of runoff sediment particles, as indicated by relatively higher temperature (higher than 13.5℃) and high beam attenuation (more than 2/m), correspond with the high magnitude of the
first spatial EOF loading, which is represented by the color scale. Most of the high loadings occur from sampling lines L2200 and L2100, which are near the Santa Ana River outlet. Near-bottom sediment particles appear as isohaline (33.0?33.2 ppt) at high beam attenuation (<2/m) and high temperature (>13.5℃). The lower salinities below the ambient (33.0 ppt) correspond directly to the surface runoff-impacted upper layer near the surface where temperature is above 13.2℃ on the shelf in Fig. 2. During the second cruise, the runoff-impacted regions, which correspond with high temperature (>13.5℃), depressed salinity (<33.1 ppt), and high beam attenuations (>2/m), are smaller with decreasing surface runoff discharge and particle settling (right panel in Fig. 6), and occur at a few sampling sites near the surface of sampling lines L2200 and L2000, and near the bottom of L2200. Chlorophyll particles can also be distinguished by the fluorescence chlorophyll-beam attenuation diagram as indicated by the negative magnitudes of the first spatial EOF loading in regards to PSD for both sampling cruises.
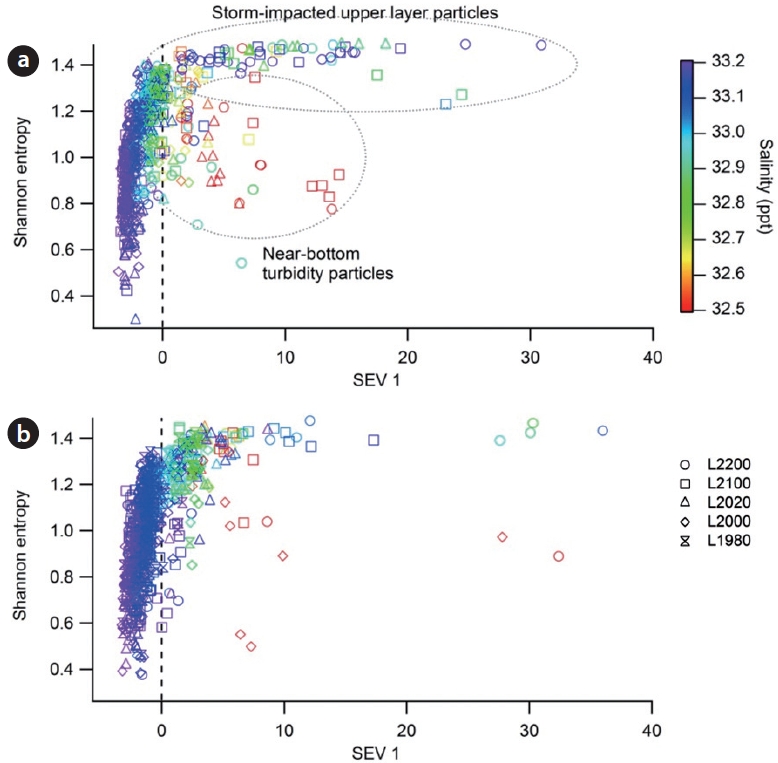
The cross plot between the first spatial EOF loading and the Shannon entropy index accentuates more clearly the characteristics of “two different structures and/or sources of sediment particle” (Fig. 7). The runoff sediment particle plumes generated from the Santa Ana River and Newport Bay outlets disperse at the surface and some fraction of the plumes develops rapid aggregation and sedimentation, which are represented by the high magnitude of the first EOF loading and the low Shannon entropy (less than 1.4) of PSD. On the other hand, another particle plume occurs along the near-bottom layer and extends down-coast from the Santa Ana River outlet. These near-bottom particles, which may be resuspended due to increased wave heights or mobilizing bottom turbidity currents [30], are differentiated by the positively high magnitudes of the first spatial EOF loading and the relatively higher Shannon entropy indices (about 1.4) of PSD.
The spatial variability of particle size spectra resolved from the first EOF mode contains 75.4% of the particle sizing variance during the first cruise and 68.0% of the variance during the second cruise, and is associated with high turbidity and fine particles as indicated by elevated beam attenuation near the Santa Ana River and Newport Bay outlets. The second mode can explain the dispersal characteristic of runoff sediments from the Santa Ana River outlet and particle coarsening at the nearsurface plumes of the Santa Ana River and Newport Bay outlets. Chlorophyll particles can also be distinguished by negative magnitudes of the first spatial EOF mode of PSD, which is supported by the relationship between fluorescence chlorophyll and beam attenuation.
Shannon entropy reveals spatial heterogeneity of particle size distribution. A high Shannon entropy index corresponds with a high concentration of relatively fine particles compared to the ambient ocean water, while a low Shannon entropy index corresponds directly to the surface runoff-impacted upper layer near the surface where large particles are dominant.
Furthermore, the integrated observation between the first spatial EOF loading and Shannon entropy index characterizes different particle plumes. The near-surface plumes originated from the runoff water outflow of the Santa Ana River and Newport Bay Outlets as indicated by the positively high magnitudes of the first spatial EOF mode and the relatively smaller Shannon entropy indices, while the near-bottom particles may be resuspended due to increased wave heights or mobilizing bottom turbidity currents, which are differentiated by the positively high magnitudes of the first spatial EOF mode and the relatively higher Shannon entropy indices.