People today consume saturated fat and cholesterol exces-sively due to a westernized diet, change in lifestyle, and the increased demands on their time that lead them to pursue con-venient eating options that are often less healthy. Excessive saturated fat and cholesterol intake leads to obesity, hyperlip-idemia, and cardiovascular diseases such as arteriosclerosis and myocardial infarction, causes regressive processes medi-ated by lipid peroxides, enhances cancer and aging, and alters or destroys biomembranes (Bidlack and Tappel, 1973; Lee, 1990; Hill et al., 1992). Blood cholesterol concentration is a risk factor for ischemic cerebrovascular diseases and cardio-arterial diseases, and free radicals are a known cause of ag-ing and cerebrovascular diseases, cardiovascular diseases, and cancers (Valko et al., 2007). The three major causes of death in 2008 in Korea were malignant neoplasm (cancer), cerebro-vascular disease, and heart disease, representing 48.1% of the total. Statistics show that the mortality rate of heart disease had increased compared to that in 1998, although the mortality rate of cerebrovascular disease decreased (National Statistical Office of Korea, 2010).
Several risk factors of hyperlipidemia have been reported: greater age, sex, obesity, wrong diet, blood pressure, blood sugar, stress, smoking, and the environment. Hyperlipidemia, together with hypertension and smoking, is one of the three major risk factors of cardioarterial disease (Connor et al., 1964).
The main ingredients of sea algae are carbohydrates and minerals. The carbohydrate of sea algae is indigestible dietary fiber, the health benefits of which are recognized. Sea tangle is a perennial brown sea algae that is produced in large quanti-ties; indeed, only the production of seaweed fusiforme, agar, and sea mustard is greater (Ministry of Maritime Affairs and Fisheries, 1999).
The dietary fiber content of sea tangle is 32-75%, which comprises 51-85% of water-solu-ble dietary fiber. Water-soluble and viscous dietary fiber, such as alginic acid and pectin, can reduce low density lipoprotein (LDL)-cholesterol levels, since it tends to absorb or bind to cholesterol. The general mechanism of the cholesterol-reducing effect of water-soluble fiber is hindering the absorption of dietary cholesterol or bile acid (Lahaye, 1991).
The alginic acid-rich sea tangle also contains a high iodine, magnesium, and iron content compared to other sea algae (Nishino et al., 1991). Alginic acid is the main ingredient of the viscous material and has myriad functions, such as reduc-ing blood cholesterol, eliminating heavy metals to the outside of the body, reducing blood pressure, and preventing cancer, in addition to the general functions of dietary fiber, such as im-proving intestinal function. The alginic acid content of dried sea tangle is ~20% (Yim, 2007). Recently, the fucoidan con-tained in brown algae was highlighted as a new physiologi-cally active substance (Choi et al., 1999). Fucoidan, which is a fucose-containing acidic polysaccharide, is known to improve blood flow, reduce clotting, and regulate blood pressure, in ad-dition to its anticancer, anticholesterol, and lipid metabolism functions. Generally, 100 g of dried sea tangle contains more than 5 g fucodian. Additionally, sea tangle contains a small quantity of laminine, an amino acid known to reduce blood pressure (Yim, 2007). The healthy benefits of sea tangle are known to originate from fucosterol (Yim, 2007).
In this study, to examine the effect of fucosterol on health indicators, we investigated whether the activity is contained within sea tangle ethanol extract (EE-ST) by administering sea tangle powder, EE-ST, and the extracted residue (ER-ST) to hyperlipidemic rats.
Sea tangle (
Ethanol (500 mL; 95%) was added to 100 g sea tangle pow-der in a 1,000-mL Erlenmeyer flask, followed by sonication for 30 min at 30℃ (Power Sonic 520; Hwashin Technology, Seoul, Korea). After filtering (Whatman No. 2; Whatman, Maidstone, Kent, UK), extracts were concentrated, frozen, dried in a rotavator (Rotavator R-200; Buchi, Flawil, Swit-zerland), and stored at -40℃. Samples used were sea tangle powder, EE-ST and sea tangle ER-ST.
>
Raising of experimental animals
Male Sprague-Dawley (140 ± 10 g) rats were provided by Hyochang Science (Daegu, Korea). They were divided into six groups, five rats per group. After a 1-week adaptation pe-riod, healthy rats were used. They were provided with a basal diet, a hyperlipidemic diet, or a diet containing sea tangle. Wa-ter was provided freely, but diets were measured in the raising term. They were housed at a relative humidity of 50 ± 10% and temperature of 22 ± 3℃ with a 12-h (07:00-19:00) light/dark cycle throughout the experiment (Tecniplast, Buguggiati, Italy). Each rat received 200 mg/kg of sea tangle samples daily for 6 weeks coercively by oral administration. Twenty-four hours before the experiment, only water was offered to the animals. Due to the daily variations in enzyme activity, ani-mals were killed at a fixed time (10:00-12:00).
>
High-fat diet-induced hyperlipidemia
Preliminary blood lipid measurements indicated that hyper-lipidemia was induced in rats treated with a high-fat diet for 6 weeks. A normal diet was given to rats in the untreated control group, while a high-fat diet was also given to the control and treated groups. Diet compositions are shown in Table 1. The rats were fasted for 8 h after the final treatment and euthanized with CO2; blood was collected from abdominal aortas. Blood samples were collected from the heart with non-heparinized syringes and incubation on ice for 30 min. Serum was sepa-rated by centrifugation at 1400 g for 10 min at 4℃. After mi-crocentrifugation, sera were preserved at -70℃.
[Table 1.] Composition of basal and hyperlipidemic diet (g/kg diet)
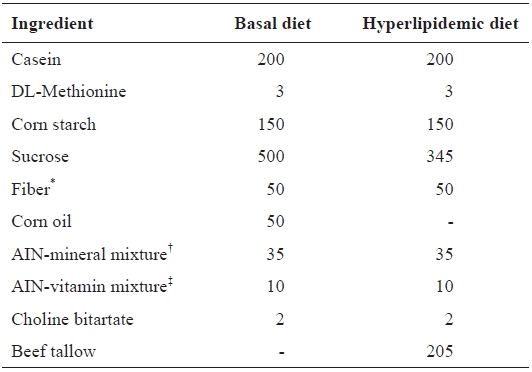
Composition of basal and hyperlipidemic diet (g/kg diet)
>
Weight and fatty tissue weight
Weight was measured once per week and abdominal fat pad weight was calculated by taking the retroperitoneal and epi-didymal fat.
Hepatic lipids were extracted using the procedure devel-oped by Folch et al. (1957), and the hepatic cholesterol and triglyceride concentrations were analyzed with the same en-zymatic kit as used for plasma analysis.
Frings and Dunn (1970) sulfo-phospho-vanillin reaction principles were used to determine the blood lipid content. After heating with sulfuric acid together vanillin phosphoric acid, the optical density at 540 nm was measured, and the lipid level was determined from a standard curve and expressed as mg/dL.
Total serum cholesterol levels were measured using an AM 202-K assay kit (Asan Pharmaceutical Co., Seoul, Korea) pre-pared by Richmond (1976) according to the manufacturer’s instructions. Three milliliters of solution (cholesterol esterase 20.5 U/L, cholesterol oxidase 10.7 U/L, sodium hydroxide 1.81 g/L, potassium phosphate monobasic 13.6 g/L, phenol 1.88 g/L) was mixed with 20 μL serum and incubated at 37℃ for 5 min. For the determination of total cholesterol levels, the absorbance at 500 nm was measured and levels were calcu-lated using a standard curve.
Triglyceride levels were measured using an AM 157S-K as-say kit (Asan Pharmaceutical Co.) prepared by McGowan et al. (1983) according to the manufacturer’s instructions. Three milliliters of solution [lipoprotein lipase 10,800 U, glycerol kinase 5.4 U, peroxidase 135,000 U, ?-α-glycero phospho-oxidase 160 U,
Phospholipid levels were measured using a kit (Iatron Chemical Co., Tokyo, Japan) prepared by Chen and Anderson (1979) according to the manufacturer’s instructions.
>
High- (HDL) and LDL-cholesterol levels
Serum HDL-cholesterol levels were measured using an AM 203-K assay kit (Asan Pharmaceutical Co.) prepared by Lehtonen et al. (1986) according to the manufacturer’s instruc-tions. Twenty microliters of serum was mixed with 200 μL of solution (dextran sulfate 0.1%, magnesium chloride 0.1 M), incubated at room temperature for 10 min, and centrifuged at 2,500 g for 10 min. Supernatant (100 μL) was mixed with 3 mL solution [lipoprotein lipase 10,800 U, glycerol kinase 5.4 U, peroxidase 135,000 U, ?-α-glycero phosphooxidase 160 U,
LDL levels were calculated using the Friedwald (1972) equation:
LDL cholesterol = [total cholesterol - (HDL-cholesterol + tri-glyceride/5)]
The serum lipid peroxide content was measured according to the method of Yagi (1987). After preincubating the serum with 1/12 N HSO and 10% phosphotungstic acid for 5 min, it was then centrifuged. The protein pellet obtained was resus-pended in 1/12 N HSO and 10% phosphotungstic acid. The resultant protein pellet was resuspended in 1 mL distilled wa-ter, 0.67% thiobarbituric acid, and 50% acetic acid at 95℃ for 60 min; 5 mL of
Serum hydroxyl radical levels were measured according to the method of Kobatake et al. (1987). Briefly, 333.3 μL solu-tion comprising 34.8 μL serum, 0.54 M NaCl, 0.1 M potas-sium phosphate buffer (pH 7.4), 10 nM NaN, 7 nM deoxy-ribose, 5 nM ferrous ammonium sulfate, and distilled water was vortexed and allowed to stand at 37℃ for 15 min. This mixture (67 μL) was added to 75 μL of a solution of 8.1% sodium dodecyl sulfate, 67 μL 20% acetic acid, and distilled water, and then 222 μL 1.2% thiobarbituric acid was added. The final solution was boiled for 30 min and cooled to room temperature before centrifuging at 700 g for 5 min. The absor-
Effect of the sea tangle on the body weight in rats fed a normal and hyperlipidemic diet for 6 wk
bance of the supernatant was determined at 532 nm using a spectrophotometer (JP/V-550; Jasco) and the hydroxyl radical concentration (unit: nmol/mg protein) was calculated from a standard curve.
>
Superoxide dismutase (SOD) activity
Serum SOD activity was determined by the method of Oyanagui (1984). Serum was 100-fold diluted with potassium phosphate buffer (pH 7.8) and 100 μL was transferred to a test tube; then 200 μL solution A (3 nM hydroxylamine/3 nM hy-poxanthine), 200 μL solution B (7.5 mU/mL xanthine oxidase with 0.1 mM EDTA-2Na), and 500 μL distilled water were added, followed by vortexing. Mixtures were then allowed to stand in 37℃ water for 40 min. Solution C (2 mL; 300 mg sulfanilic acid/5.0 mg
>
Protein content and statistical analysis
The protein content of samples was determined by the method of Lowry et al. (1951). Data were used to calculate the mean and standard deviation. Significant differences were determined by Duncan’s multiple range test. A value of
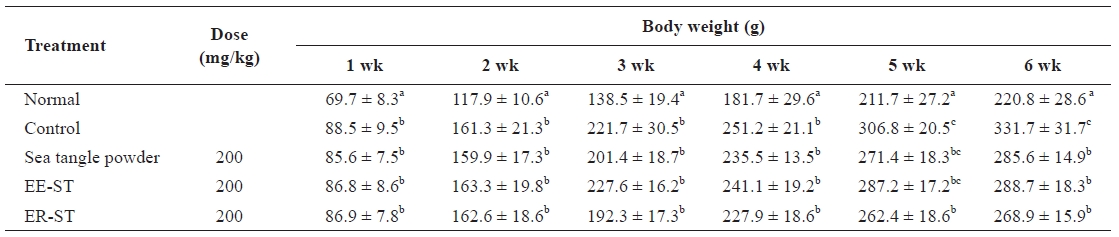
Table 2 shows the weight change of diet-induced hyperlip-idemic Sprague-Dawley rats after the addition of sea tangle to the diet. In weeks 1 and 2, the weight of rats receiving EE-ST decreased. In the sixth week, the weight declined in rats fed sea tangle powder, EE-ST, and ER-ST as compared to the controls. In particular, the rate of weight decrease was great-est in the group receiving ER-ST. Choi et al. (1999) reported that the sea tangle-mediated weight reduction indicated an an-tiobesity function (Kang, 2008). Thus, ER-ST may suppress body weight to a greater degree than sea tangle powder and so may be a useful antiobesity and weight-reducing agent.
>
Fatty tissue weight fluctuations
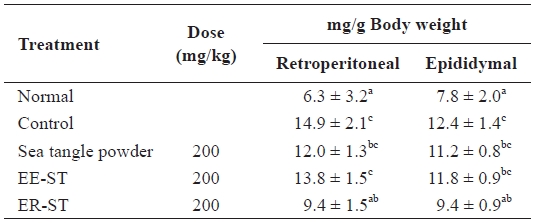
Table 3 shows of the effect of a diet of sea tangle on diet-in-duced hyperlipidemic Sprague-Dawley rats. We orally added each type of sea tangle to the diet for 4 weeks and determined the fat contents. The retroperitoneal lipid quantities after the addition of sea tangle powder, EE-ST, or ER-ST were 12.0 ± 1.3 mg/g, 13.8 ± 1.5 mg/g, and 9.4 ± 1.5 mg/g, respectively, compared to the control group (14.9 ± 2.1 mg/g). In contrast, the epididymal lipid quantity after the addition of ER-ST was 9.4 ± 0.9 mg/g, a 24% decrease from the 12.4 ± 1.4 mg/g of the control group. These results indicate ER-ST had the grea-test effect on local fat stores, likely due to its fiber content.
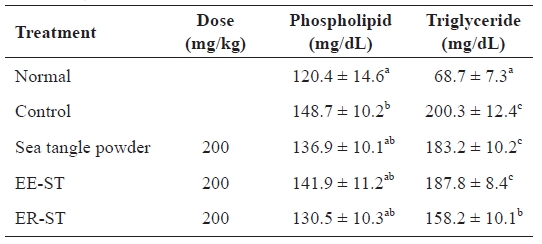
Table 4 shows the concentration of serum lipid components after adding sea tangle to hyperlipidemic Sprague-Dawley rats. The phospholipids levels in rats fed ER-ST were 130.5 ± 10.3 mg/dL, a 12.2% decrease compared to the 148.7 ± 10.2 mg/dL of the control group. Also, the rate of serum triglycer-

Abdominal fat pad weight in the normal and fat diet-induced rats fed the sea tangle for 4 wk
ide levels in rates fed sea tangle and ER-ST were 183.2 ± 10.2 mg/dL and 158.2 ± 10.1 mg/dL, respectively, an 8.5% and 21.0% decrease from the 200.3 ± 12.4 mg/dL of the control group. Vahouny et al. (1980) reported that the combination of fiber with bile salt was the major mediator of reduced lipid ab-sorption. Akiba and Matsumoto (1982) also observed that fi-ber decreased serum phospholipid levels. Furthermore, Goode et al. (1995) reported that serum lipid content was intimately related with blood pressure, and that a patient with high blood pressure has a higher total serum lipid level. Thus, these data suggest that the addition of sea tangle to the diet resulted in reduced hyperlipidemia.
>
Serum cholesterol and atherogenic indices
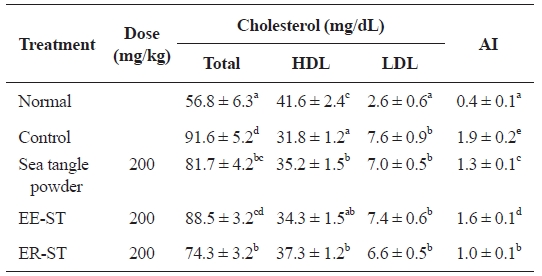
Table 5 shows the effect of sea tangle samples on serum cholesterol content and atherosclerosis indices in diet-induced hyperlipidemic rats. The serum total cholesterol in rats with diet-induced hyperlipidemia was 91.6 ± 5.2 mg/dL. However, administration of sea tangle powder and ER-ST lowered this

Effect of the sea tangle on the concentration of serum lipids in rats fed a hyperlipidemic diet for 4 wk

Effect of the sea tangle on serum cholesterol and AI in rats fed a hyperlipidemic diet for 4 wk
to 81.7 ± 4.2 and 74.3 ± 3.2 mg/dL, respectively, represent-ing 10.8% and 18.9% decreases. In contrast, ER-ST admin-istration had the greatest effect on HDL-cholesterol levels, increasing them to 37.3 ± 1.2 mg/dL, 17.3% higher than the 31.8 ± 1.2 mg/dL of the control group. This result is similar to that of another report, in which the sea algae supplementation reduced serum total lipid by 15-20% in exogenous obesity and arteriosclerosis mice (Nishino et al., 1991). Additionally, the result is consistent with the work of Hsueh and colleagues, who reported that HDL-cholesterol level was increased by oral administration of sea tangle and 200 mg/kg of sea tangle alginic acid extract (Hsueh and Anderson, 1992). LDL-cho-lesterol levels were 7.6 ± 0.9 mg/dL in diet-induced hyperlip-idemic rats, but after administering sea tangle powder, EE-ST, and ER-ST, this decreased to 7.0 ± 0.5, 7.4 ± 0.6, and 6.6 ± 0.5 mg/dL, respectively.
A report has described that fiber decreases lipid absorption in the intestine, increases bile acid excretion, and promotes bile acid synthesis from cholesterol, while decreasing the cho-lesterol concentration. Also, water-soluble fiber, pectin, gums, mucilages, and sea algae polysaccharide, reportedly decrease the total cholesterol and LDL-cholesterol concentration, while increasing that of HDL-cholesterol (Park et al., 1994; Yang et al., 1996).
Therefore, we demonstrated the effect of sea tangle and ER-ST on total cholesterol. HDL- and LDL-cholesterol lev-els were also influenced by ER-ST. These data suggest that the addition of sea tangle effectively improves hyperlipidemia because hyperlipidemia originates from an increased triglyc-eride synthesis in the small intestine and liver, a decreased HDL-cholesterol synthesis, and increased VLDL-cholesterol synthesis and secretion. Furthermore, atherosclerosis indices were 1.9 ± 0.2 mg/dL in diet-induced hyperlipidemic rats, but 1.3 ± 0.1 mg/dL in rats fed sea tangle powder, 1.6 ± 0.1 mg/dL in rats fed ER-ST, and 1.0 ± 0.1 mg/dL in rats fed ER-ST. These represent 31.6, 15.8, and 47.4% decreases respectively, and indicate that sea tangle lowers atherosclerosis indices.
This experiment showed that a decrease in serum total cho-lesterol, HDL-cholesterol, and LDL-cholesterol atherosclero-sis indices was effective for hyperlipidemia.
>
Lipid and cholesterol content of hepatic tissue
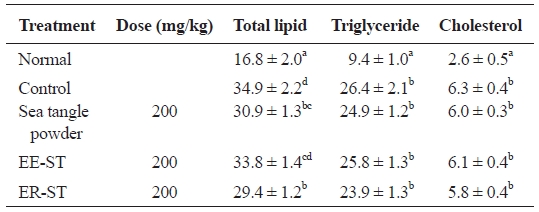
Table 6 shows the effect of sea tangle powder and extracts on hepatic lipid concentration and cholesterol content in the diet-induced hyperlipidemic rats. Compared to controls, total lipid in diet-induced hyperlipidemic rats fed sea tangle powder and ER-ST were 30.9 ± 1.3 and 29.4 ± 1.2 mg/g, respectively, with 11.5% and 15.8% decreases, respectively. Triglyceride level was 23.9 ± 1.3 mg/g in rats fed ER-ST, a 9.5% decrease from that of the control group (26.4 ± 2.1 mg/g). These data suggest that the addition of sea tangle to the diet affects the disease state, suggesting its effect on hyperlipidemia.

Effect of the sea tangle on the hepatic lipid concentration of hepatic tissue of rat fed a hyperlipidemic diet for 4 wk
Effect of the sea tangle on TBARS concentration of hepatic homogenate of rats fed hyperlipidemic diet for 4 weeks

Effect of the sea tangle on the serum hydroxyl radical and superoxide dismutase activities in rats fed hyperlipidemic diet 4 wk
>
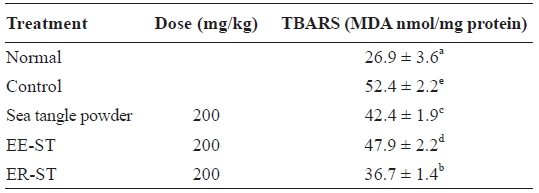
Thiobarbituric acid (TBARS) levels in hepatic tissue
Table 7 shows the effect of sea tangle samples on TBARS levels in the hepatic tissue of diet-induced hyperlipidemic rats. These were 52.4 ± 2.2 nmol/mg in the control group, 42.4 ± 1.9 nmol/mg in rats fed sea tangle powder, and 36.7 ± 1.4 nmol/mg in those fed ER-ST, representing 19.1% and 30.0% decreases, respectively. Lipid peroxidation, which could be the reason for cancer, atherosclerosis, and aging, is considered a cell damage mechanism (Cho and Bang, 2004).
When glycosuria occurs, it is generally accompanied by el-evated oxidative stress, itself a result of increases in the tissue lipid peroxidation index. Also, the organized MDA contents of the kidney and liver increased (Celik et al., 2002). When the reasoning is that lipid content increases are caused by these re-search results, the lipid peroxidation index increased, similar to other research results (Velthuis-te et al., 1996).
Since lipid peroxides can cause regressive diseases, cancer, aging, and changes in biomembranes (Nishide et al., 1993), the anti-oxidizing effect of ER-ST may prevent such condi-tions. Tissue MDA content is increased by oxidative stress in the case of diabetes.
>
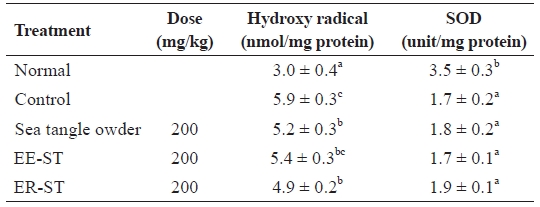
Serum hydroxyl radical and SOD activities
Table 8 shows the effect of sea tangle samples on serum hydroxyl radical and SOD activities in diet-induced hyper-lipidemic rats. Hydroxyl radical levels in the control group were 5.9 ± 0.3 nmol/mg, but the administration of sea tangle powder and ER-ST reduced this to 5.2 ± 0.3 and 4.9 ± 0.2 nmol/mg, respectively. SOD enzyme activities compared be-tween the control and sea tangle powder and EE-ST groups were completely different. However, SOD enzyme activities of rats fed ER-ST markedly increased. Blood lipid peroxide and active oxygen exhibit cytotoxicity that causes aging and other pathological phenomena related to aging, but this can be ameliorated by the action of the body’s detoxification mecha-nisms.
Animal experiments did not show a significant difference in SOD enzyme activities after oral administration of sea tangle powder, EE-ST, or ER-ST. However, SOD activity was in-creased to the greatest degree in rats fed ER-ST and sea tangle powder, in which the polysaccharides remain undamaged, when compared to rats fed EE-ST. These data confirmed that ER-ST had the strongest anti-oxidizing effect.