Fish is known to be a source of protein rich in essential amino acids (lysine, methionine, cysteine, threonine, and tryp-tophan). Fish muscle also contains micro- and macroelements and fat-soluble vitamins (Larsen et al., 2007).
Chub mackerel’s popularity worldwide is due to the pres-ence of two important fatty acids: eicosapentaenoic acid (EPA) and docosahexaenoic acid (DHA). These are known to have many health benefits, particularly with regard to heart disease and a decreased risk of prostate cancer and Alzheimer’s dis-ease (Huang et al., 2005).
Chub mackerel is rarely eaten raw and is usually cooked in different ways before consumption. Application of heat is achieved by boiling, baking, roasting, frying, grilling, steam-ing, or microwaving. Each of these serves to enhance the taste and flavor as well as increase the shelf life of the product (Gar-cia-Arias et al., 2003).
The protein quality of fish is affected during processing as a result of the application of heat, which causes protein dena-turation. The extent of protein denaturation depends on the duration and temperature, as well as the processing facility (Sikorski, 2001). Note that the nutritive value of proteins is determined not only by their quantitative and qualitative ami-no acid composition, but also by their availability to digestive tract proteolytic enzymes (Lee and Ryu, 1987).
Processing by heat is hypothesized to increase food di-gestibility due to breakdown of complex proteins and car-bohydrates. Despite this, however, vitamins, minerals, some essential amino acids, and other beneficial nutrients are lost (Mirnezami et al., 2002).
Lipid oxidation is one factor that contributes to loss of pro-tein quality. Fish oils are converted to ketones, aldehydes, and hydroxyacids. These reactions are enhanced by iron and cop-per ions, so red muscle readily becomes rancid, especially in tuna, swordfish, bluefish, and mackerel. This appears as a thin brownish-gray layer next to the larger portion of edible flesh. Chemical reactions of oxidized lipids with amines, amino ac-ids, and proteins have received considerable attention because they are associated with changes in functional properties, nu-tritive value, flavor, and color of foods (Xiong, 2000).
Reduced digestibility, as well as limiting the amount and degree of amino acid availability, is mediated partially by the formation of amino acid bonds with lipid oxidation products (Lee and Ryu, 1987). These protein-lipid complexes contrib-ute to the quantity of indigestible substances in foods that are not available to proteolytic enzymes.
Various studies have determined the protein quality of sea-food. Ryu et al. (1992), observed an increase in
Chub mackerel is very popular in Ghana and is mostly consumed in the smoked form, although the grilled form has also become popular. The popularity of mackerel has soared because of the much publicized health benefits of omega-3 fatty acids. Protein quality is severely affected by the heat ap-plied during processing as the equipment used does not al-low control of cooking conditions. Therefore, one must know the beneficial/optimal processing conditions that result in the production of nutritionally superior products, rather than just satisfying the consumer’s organoleptic appetite.
Although many studies have examined the effect of differ-ent cooking conditions on the nutritional quality of fish, little has been done on chub mackerel. Therefore, the main objec-tive of this study was to investigate the effect of four cooking methods (grilling, steaming, frying, and microwaving) on the protein quality of chub mackerel and to determine which re-sults in the retention of a high nutritional value.
Fresh chub mackerel samples, caught in the Korean South-ern Sea during February 2011, were delivered to the labo-ratory as individual quick frozen products. Products were prepared using just-landed fish from 3S Seafood Company, Busan, Korea. The average sizes of semi-dressed samples without viscera were 28.0 ± 2 cm in length and 380.0± 12 g in weight. They were immediately frozen at -13℃ after weigh-ing. Samples were then randomly divided into five units. One unit was kept raw and used as the control. Each of the other four units were again divided into three subunits and soaked in 2, 6, and 10% sodium chloride for 1 h. These subunits were then cooked by frying, steaming, microwaving, or grilling.
Grilling of fish was performed for 12 min at 250℃ using an oven (OAS6.10, Convotherm, Eglfing, Germany). Steam-ing was done for 12 min at 200℃ in the same oven. Fish were pan-fried in a large pan with soybean oil at 180℃ for 10 min. Microwaving was performed for 6 min in an oven (Zipel DG68-00216B-01, Samsung, Gwangju, Korea).
>
Determination of the proximate composition
Cooked mackerel meat without the skin was homogenized using a kitchen blender (Super Power Mixer HMF 985, Han-Il Electric, Busan, Korea). A raw sample was also homogenized with the skin. Moisture was determined by drying at 105℃ to constant weight (Association of Official Analytical Chem-ists, 1990). Fat was determined using the method described by the Association of Official Analytical Chemists (1990) using a Soxhlet solvent extractor. Crude protein was determined by the semi-micro Kjeldahl procedure using a conversion factor of 6.25 (Association of Official Analytical Chemists, 1990). The remaining samples were freeze-dried and stored.
>
Drip loss and water-holding capacity (WHC)
Drip loss was calculated from the difference in the mass of raw mackerel samples before and after thawing in a cold room at 6℃ for 4 h.
% Drip loss = (mass before thawing - mass after thawing) × 100 /mass before thawing
Weight of drip from the all thawed samples ranged from 3.5 to 3.9 g/100 g sample with a mean of 3.7 g/100 g sample.
The WHC was determined by the press method introduced in the Handbook of Food and Nutrition, published by The Ko-rean Society of Food Science and Nutrition (2000) using a 35-50 kg/cm2 compressor.
Cooking loss was measured according to the method of Niamnuy et al. (2008), and was calculated from the difference in sample mass before and after cooking (frying, grilling, mi-crowaving, and steaming).
% Cooking loss = (mass before cooking - mass after cooking)/mass before cooking × 100
Water activity measurements were taken for all raw and processed samples using water activity-measuring equipment (BT-RSI-7557 012; Rotronic, Grindelwald, Switzerland).
Thiobarbituric acid-reactive substances (TBARS) levels were determined by the method of Witte et al. (1970). Ab-sorbance at 530 nm was measured and the concentration of TBARS in samples was calculated by multiplying the optical density by 5.2 and expressed as mg/g solid.
>
In vitro protein digestibility
The
% Digestibility = 234.84 - 22.56x, where x is the pH of the sample at 20 min.
>
Trypsin inhibitor (T1) assay
The amount of TI in samples was determined using the procedure of Ryu and Lee (1985), which is a modification of the Rhinehart (1975) method. TI levels are expressed in TI equivalents, which equal the milligrams of purified soybean TI per gram sample.
The correlation coefficient between pH and TI content was 0.9914, calculated by the equation:
y = 4.0434x - 26.281, where y = purified soybean TI (mg) and x = pH at 10 min incubation.
Amino acid compositions were determined using an amino acid analyzer (Sykam S433, Eresing, Germany). Samples were hydrolyzed with 6 N HCl
>
Computed in vitro protein quality
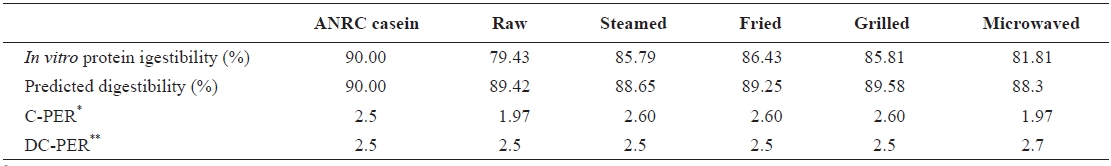
C-PER, DC-PER, and predicted digestibility were calcu-lated using the corrected Association of Official Analytical Chemists (1982) procedure. Protein digestibility and amino acid profiles were used to calculate these
Data were analyzed using a one-way analysis of variance (ANOVA), followed by Tukey’s multiple range test. All data are expressed as the mean ± S.D. The significance of results was at 5%. The software used was SPSS, version 18(SPSS Inc., Chicago, IL, USA).
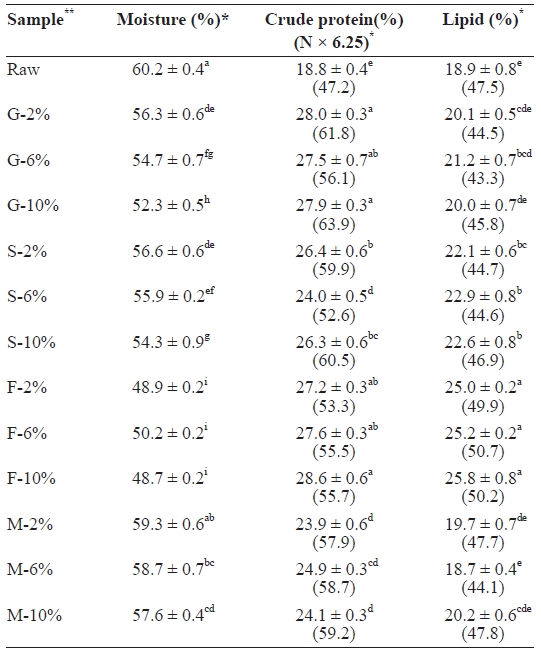
The proximate composition of raw and cooked mackerel samples are presented in Table 1. The proximate composition of raw mackerel was similar to that reported by the National Fisheries Research and Development Institute (NFRDI) in fall 2009. Moisture content decreased in all cooked samples. Moisture loss was highest in fried samples (F-10, 48.7%), fol-lowed by grilled (G-10, 52.3%), steamed (S-10, 54.3%), and then microwaved (M-10, 57.6%) samples. In all sample cat-egories, 10% NaCl brine treatment recorded the highest mois-ture loss, which was due to the high level of salt. Protein also increased in all cooked samples, with the highest in fried, fol-lowed by grilled, steamed, and microwaved samples. On a dry weight basis, fat content decreased in all cooked samples, with the exception of those that were fried, which increased, which was likely due to absorption of fat from the vegetable oil by the fish during frying. Grilled samples recorded the highest fat
[Table 1.] Proximate composition of raw salted and cooked chub mackerel.

Proximate composition of raw salted and cooked chub mackerel.

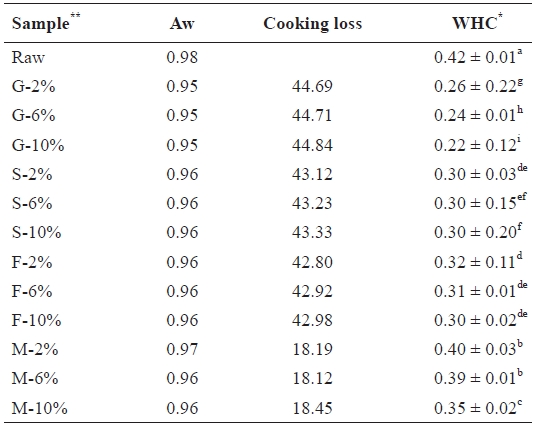
Water activity (Aw) cooking loss and water holding capacity (WHC) of salted and cooked chub mackerel.
loss due to the higher temperature employed during cooking.
The decrease in moisture and increase in protein in all cooked samples was also reported by Jannat Alipour et al. (2010). The decrease in moisture content has been described as the most prominent change that makes the protein content increase significantly in cooked fish (Gokoglu et al., 2004). The heat and flow of gases caused drying of the cooked mack-erel samples. This decreased the water content, thereby caus-ing dehydration-associated changes, such as an increased pro-tein concentration. The cooking conditions employed in the steamed, grilled, and microwaved samples may have caused fat extraction, hence the decrease in fat content.
An average of 3.72% (g drip/100 g frozen sample) (data not shown) was recorded for the raw sample after thawing in a cold room at 6℃ for 4 h. This suggests that the fish was in excellent condition before cooking. A low drip loss indicates that frozen protein denaturation has not taken place.
The water activity values of samples showed no significant differences (Table 2), ranging from 0.98 in raw samples to 0.95 in grilled samples. Foods found in this range are classi-fied as water-rich and support profuse growth of microorgan-isms, as well as other chemical reactions. Thus all mackerel samples had to be preserved to prevent spoilage (Pigott and Tuker, 1990).
Table 2 also shows cooking loss of the various cooked sam-ples, which depended on the cooking process. Significant loss-es occurred in the grilled samples (G-10, 44.84%), followed by steamed (S-10, 43.33%), fried (F-10, 42.98%), and then microwaved (M-10, 18.45%) samples. No significant differ-ences were observed among the NaCl brine treatments in each sample category. Water in the mackerel muscle is held within the myofibrils, in the space between the thick filaments (myo-sin) and thin filaments (actin) as well as in the connective tis-sue (Offer et al., 1989). As cooking proceeded, heat-induced protein denaturation and aggregation lead to shrinkage of both the filament lattice and the collagen. This also led to exposure of the hydrophobic areas of the myofibrillar structure, which allowed new intra- and inter-protein interactions, resulting in a denser structure (Straadt et al., 2007). The subsequent aggre-gation and denaturation of proteins led to a loss in WHC, and hence the loss of water. Salts enhance denaturation by reduc-ing the WHC (de Man, 1999). The WHC values of the 10% NaCl brine-treated samples and the cook-ing loss values of the 10% treatment in Table 2 clearly show this relationship. Cook-ing loss leads to a significant loss of matter and is thought to
have a linear relationship with cooking time and temperature (GarcIa-Segovia et al., 2007).
The primary products of fat oxidation are hydroperoxides, which are not harmful to food quality. These hydroperoxides are, however, unstable and undergo scission to form volatile carbonyl compounds, such as aldehydes and ketones. Malo-ndialdehyde, a major secondary product of fat oxidation, is the principal factor involved in protein cross-linked reactions. Schiff base formation between the amino group of lysine and other free amino groups could lead to a reduction in the avail-ability of these amino acids (Crawford et al., 1967). Malondi-aldehyde has been reported to be toxic to living cells because it can be absorbed through the digestive system (Piche et al., 1988).
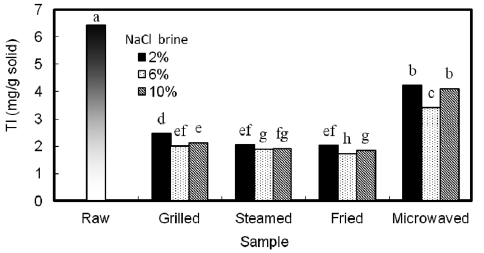
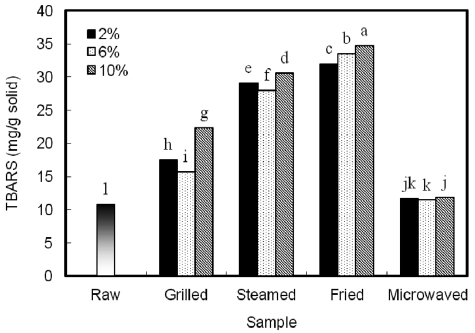
TBARS increased in all cooked samples, with the highest in the fried, followed by the steamed, grilled, and microwaved samples (Fig. 1). A similar trend was observed by Ryu et al. (1984a) in boiled whole anchovy. The lowest value being in microwaved samples was likely because little oxygen was in-volved in this processing method; oxygen is needed for fat oxidation to occur. The high temperatures (over 150℃) and the presence of oxygen are responsible for the high oxidation in most samples. Salt may act as a prooxidant in fish flesh with a subsequent reduction in some vitamins and increased lipid oxidation (Daun, 1975). The degree of oxidation was highest in the 10% NaCl brine-treated samples. Treatment with 6% NaCl brine caused the lowest degree of fat oxidation. Similar results were reported by Lee et al. (1997) when higher NaCl concentrations resulted in higher TBARS levels.
The fried samples showed the highest values, followed by steamed, grilled, and microwaved samples. Loss of amino acid availability results mainly from the interaction of proteins with oxidized lipids and their secondary products. The oxida-tion of protein leads to both physical and chemical changes, including amino acid destruction, decrease in protein solubil-ity due to polymerization, formation of amino acid derivatives and reactive carbonyls, changes in protein digestibility, and loss of enzyme activity (Carpenter et al., 1963). In addition, oxidative changes may give rise to altered water-binding ca-pacity, and protein hydration and can also lead to formation of protein-lipid complexes.
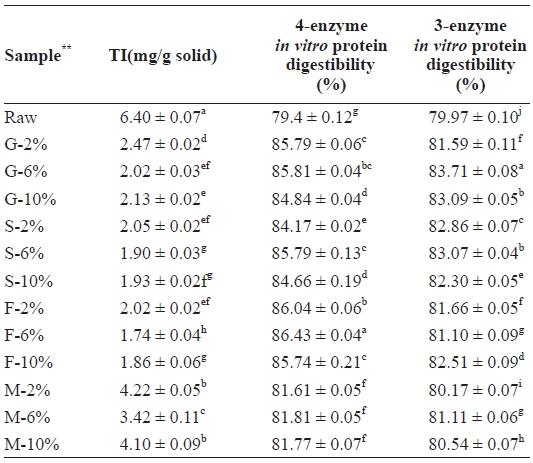
Table 3 shows the TI values of the mackerel samples. TI includes typical proteinaceous inhibitory materials contained in raw sources and indigestible materials such as TIS induced by interactions between protein and other components, such as lipid oxidation products. As shown in Fig. 2, the amount of TI decreased in all samples from 6.40 mg/g solid in the raw sam-ple. Microwaved samples showed the highest amount (M-2%, 4.22 mg/g solid), followed by grilled (G-2%, 2.47 mg/g solid),

Level of trypsin inhibitor (TI) and in vitro protein digestibility of raw salted and cooked chub mackerel.
steamed (S-2%, 2.05 mg/g solid), and then the fried sample (F-2%, 2.02 mg/g solid). Even though the microwaved sample received uniform heat, the duration of the process was too short to inactivate TI, which likely explains the high TI levels in those samples. However, the amount of TI in each sample category was noted to be lowest in the 6% treated samples. Similar results were observed by Lee et al. (1984b) with yel-low corvenia (
>
In vitro protein digestibility
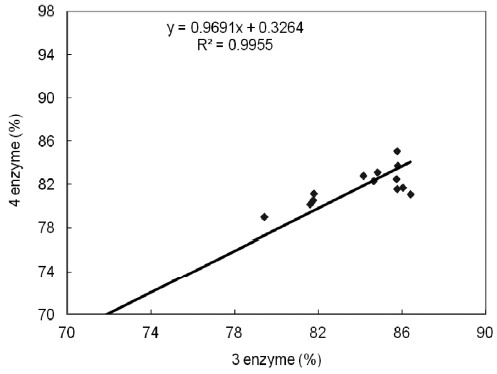
The three- and four-enzyme assays were used to deter-mine the
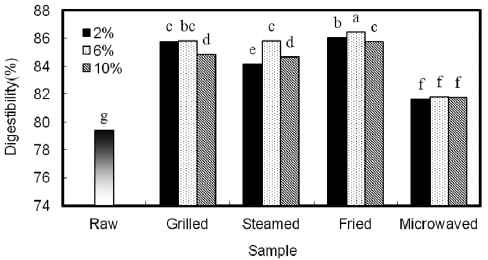
Such a phenomenon was also observed by Lee et al. (1984a, 1984b) during the processing of dried anchovy and yellow corvenia, and also by Jannat Alipour et al. (2010) during processing of the Persian sturgeon. With the four-enzyme as-say, the fried meat sample recorded the highest digestibility (86.43%), followed by grilled (85.81%), steamed (85.79%), and microwaved (81.81%) samples. Even though the 6% NaCl brine-treated samples recorded the highest values, significant differences were observed between the 2% and 10% NaCl brine-treated samples, with the exception of those that were fried. In each case, the digestibility values of the 10% NaCl brine treated samples were higher. In the three-enzyme assay, all cooked samples showed an increase in their digestibility as compared to the raw samples. Here, however, the rates were highest in the grilled, followed by the steamed, fried, and microwaved samples. A strong correlation, however, was ob-served between the two assays, as seen in Table 3 and Fig. 3.
Protein digestibility is influenced by the presence of anti-nutritive factors (Liener, 1976), the levels of which are affect-ed by different processing and cooking methods. In general, heating improves digestibility by inactivating enzyme inhibi-tors and denaturing the protein, which exposes new sites to digestive enzyme action (Sikorski, 2001). This is evidenced by the inverse relationship between
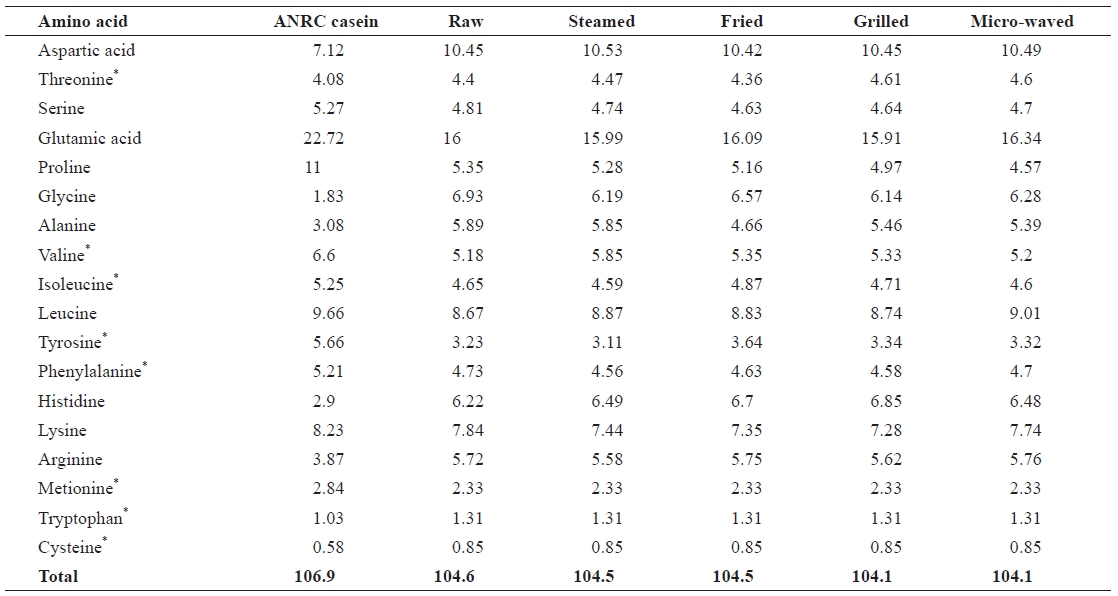
The amino acid profiles of chub mackerel samples (Table 4) were similar to those reported by Lee et al. (1987). Glu-tamic acid showed the highest concentration in all samples, which is also in agreement with Badiani et al. (1996). Tryp-tophan, methionine, and cysteine recorded the lowest concen-trations in all samples. The total essential amino acid level increased in all cooked samples (31.22-31.54) when compared with the raw sample (30.62). Aspartic acid, valine, leucine, and histidine levels also increased in all cooked samples. Ser-ine, proline, glycine, alanine, phenylalanine, lysine, and iso-leucine levels decreased in all samples. The losses of some amino acids, such as lysine, may have been due to the forma-tion of different Maillard products during heating, as reported by Garcia-Arias et al. (2003). Lysine is the most susceptible amino acid in intact proteins because it has a free amino group at the ε-carbon unit that is readily available to react with re-ducing sugars. Free lysine is even more reactive because it has two free amino groups. Differences between serine and threo-nine content in raw samples compared to some heat-treated samples may be due to their conversion of these amino acids to other compounds, leading to the rupture of disulfide bonds and liberation of a sulfide ion and free sulfur (Sikorski, 2001). Thermal degradation of tryptophan was reported by Rakows-ka et al. (1975), who found many derivatives of tryptophan in fried products. The rate of thermal decomposition of sensitive amino acid residues generally increases with temperature, as well as in the presence of oxygen and reducing saccharides (Sikorski, 2001). The results showed a significant change in the essential amino acid content of samples after cooking.
>
In vitro protein quality of raw and cooked chub mackerel
The
[Table 4.] Amino acid profiles of raw salted and cooked chub mackerel.

Amino acid profiles of raw salted and cooked chub mackerel.
[Table 5.] In vitro protein quality of raw salted and cooked chub mackerel.
In vitro protein quality of raw salted and cooked chub mackerel.
digestibility were calculated solely from the amino acid pro-files of sample proteins. C-PER and DC-PER are known to be highly correlated with the rat bioassay (
C-PER values for steamed, grilled, and fried samples were higher than standard casein, raw, and microwaved samples. These results are similar to those of Abdul-Hamid et al. (2002). Also, C-PER and DC-PER seemed to correlate well for steamed, fried, and grilled samples, but not for the raw and microwaved samples. This could be due to the low di-gestibility values of the raw and microwaved samples, indi-cating that DC-PER is not suitable for samples with digest-ibility values below 85%. The same argument holds for the
The duration of the cooking method and the temperature employed had an impact on TI content, as indicated by the reduced TI levels in the grilled, steamed, and fried samples. Heating inactivated the enzyme inhibitors and denatured the protein, which led to the exposure of greater amounts of protein to proteolytic enzymes. Although fried samples showed the highest digestibility values, frying is not beneficial due to the high fat content. A high degree of fat oxidation also indicates the presence of carcinogenic compounds (malondialdehydes).
The microwaved samples showed the lowest digestibility values and high TI levels. This suggests that much of their protein is unavailable for digestion by proteolytic enzymes.
Grilled and steamed meat samples exhibited comparatively high digestibility values and low fat content. Therefore, these methods retained the highest nutritional values and are thus recommended for processing of chub mackerel. Brining using 6% NaCl is recommended, since it gave the highest digestibility value and lowest fat oxidation level. Since the amount of moisture is essential for reactions in foods, 6% brine treatment is believed to have been optimal; the 2% treatment exhibited dilution effects and the 10% treatment, extreme protein denaturation, and reduced WHC.