The ayu,
To date, isozymes have been widely used as markers in studies of ayu population genetics. Taniguchi et al. (1983) studied genetic variability and differentiation among amphi-dromous, landlocked, and hatchery populations of ayu in Ja-pan. Seki and Taniguchi (1985) and Nishida (1985) studied genetic divergence among amphidromous ayu populations in Japan. Although the variability of isozymes is beneficial for population genetic analyses of ayu, isozyme analysis re-quires careful collection and handling of tissues (Park et al., 1993). Furthermore, the resolution of isozymes is most effec-tive at regional levels (Han et al., 2003). Han et al. (2003) found substantial gene flow that was sufficient to genetically homogenize 11 natural Korean ayu populations. In addition, a limited number of studies have applied genetic analyses to Korean amphidromous ayu populations. Seki et al. (1988) and Sawashi et al. (1998) showed genetic divergence between Ko-rean and Japanese ayu populations, but they only studied four populations in Korea.
Microsatellites are highly polymorphic nuclear loci that have been used successfully in studies of population genet-ics, pedigree analysis, parentage assignment, and linkage mapping. Among the many types of DNA markers, micro-satellites are particularly useful because they are evenly dis-tributed in genomes, have a codominant Mendelian manner of inheritance, and are easily genotyped via PCR. Takagi et al. (1999) demonstrated the great potential of microsatellites as indicators of genetic variability and divergence among ayu populations, finding higher levels of polymorphism than were obtained during previously isozyme analyses.
The present study investigated genetic variation and popu-lation structure in natural populations of
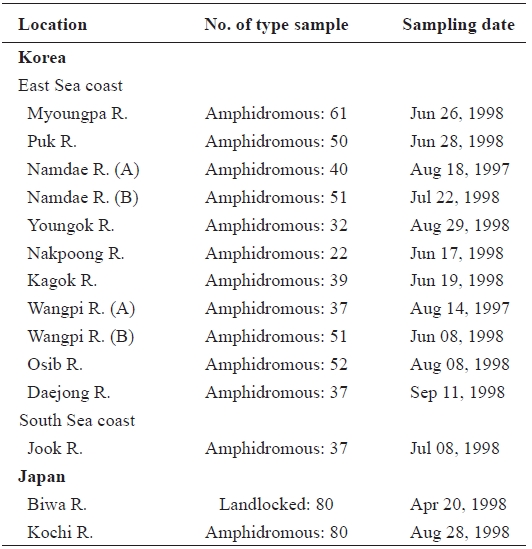
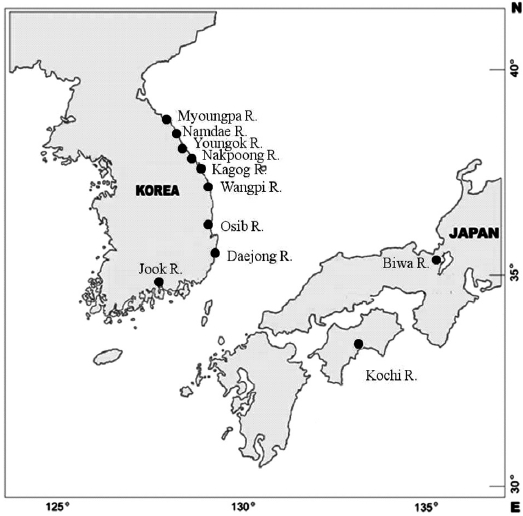
Samples of ayu were collected from 10 rivers located in eastern and southern Korea in 1998 (Table 1, Fig. 1). Ayu samples were also collected from the Namdae River and the Wangpi River in 1997. The Kochi River and the Biwa River populations in Japan were studied previously by Takagi et al. (1999) and were compared with the Korean populations. Wild fish were caught at a single location at each site within a few days using a pot, frozen with dry ice, and stored at -20℃ until use.
>
DNA extraction and microsatellite genotyping
For each ayu sample, DNA was extracted from a fin-clip following a slight modification of the methods described by Taggart et al. (1992). Fin tissue was placed in 700 μL TNES-Urea (10 mM Tris-HCl pH 7.5, 1.5 M NaCl, 10 mM EDTA, 0.5% sodium dodecyl sulfate, and 4 M Urea) and 5 μL of proteinase K (50 μg/μL final concentration). The mixture was then shaken gently and incubated overnight at 37℃. DNA was purified by successive extractions with phenol : chloroform : isoamylalchol (25:24:1) and chloroform-:-isoamylachol (24:1), respectively. DNA was precipitated with 3 M sodium acetate trihydrate and a double volume of 99% cold ethanol. The precipitate was decanted, washed with 70% ethanol, and air-dried. The DNA pellet was resuspended in 100 μL TE buf-fer (10 mM Tris-HCl, 1 mM EDTA pH 7.2) and stored at 4℃ prior to PCR analysis.
[Table 1.] Sample sites sample number and sampling date of ayu in the present study

Sample sites sample number and sampling date of ayu in the present study
For the microsatellite analysis, three primers,
The genetic diversity of each location was estimated by the number of alleles per locus and observed (Ho) and expected (He) heterozygosities, which were calculated using FSTAT ver-sion 2.9.3 (Goudet, 2001) and GENEPOP version 1.2 (Raymond and Rousset, 1995). The inbreeding coefficient, FIS, was calcu-lated in an analysis of variance framework following Weir and Cockerham (1984) using GENEPOP. Departure from Hardy-Weinberg equilibrium (HWE) and linkage disequilibrium were calculated using GENEPOP version 1.2 (Raymond and Rousset, 1995). Tests for the occurrence of null alleles were performed with MICRO-CHECKER version 2.2.3 (Van Oosterhout et al., 2004). Pairwise
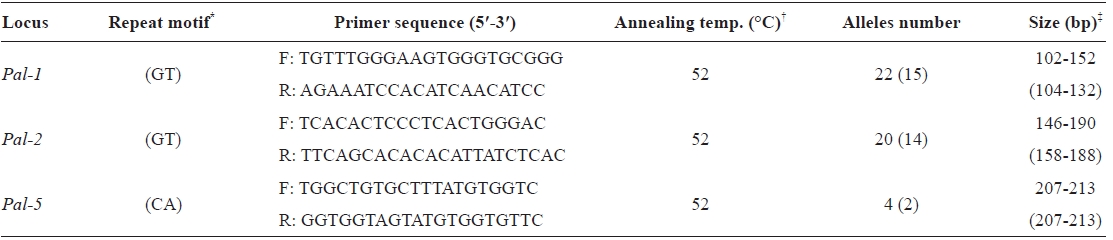
Nucleotide sequence of 3 microsatellite PCR primers repeat motif and amplification condition in Korean and Japanese populations
In addition, after constructing a genetic distance matrix based on a set of gene frequencies in different populations, which was estimated according to Nei (1972), a NJ tree was constructed for each replicated genetic distance matrix via bootstrapping of 1000 replications using NEIGHBOR in the PHYLIP version 3.5 software package (Felsenstein, 1993).
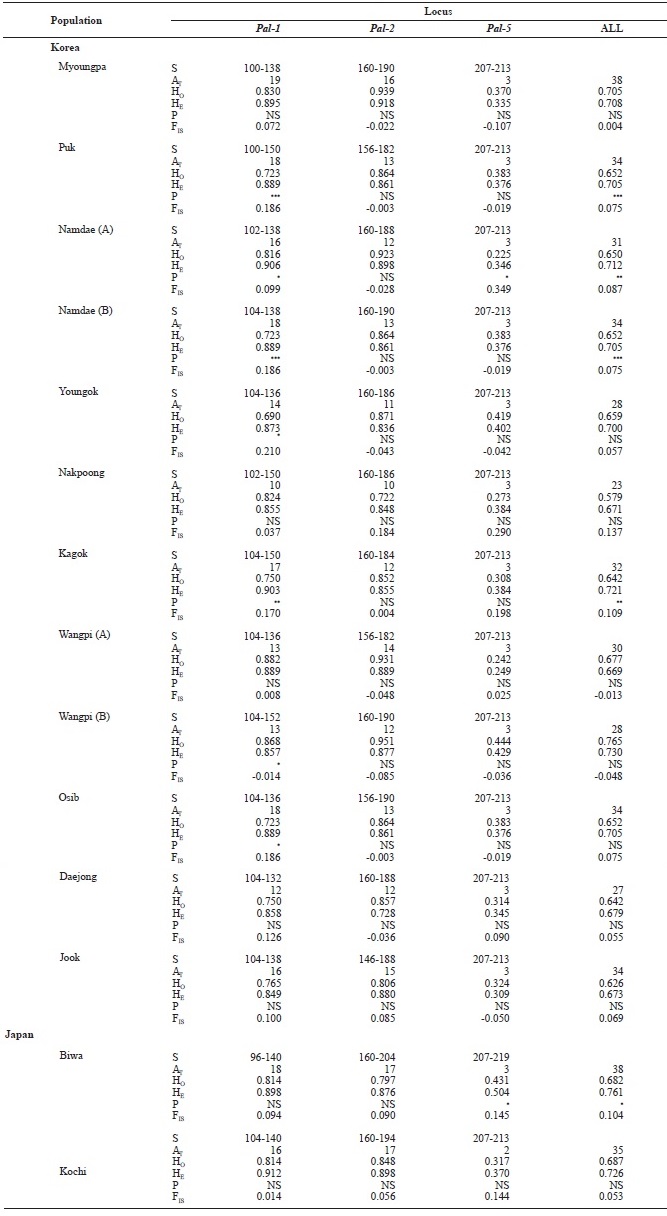
We examined 669 individuals from 14 ayu populations in Korea and Japan using three microsatellite DNA markers. Al-lele size in base pairs (S), the total number of alleles (AT), and observed (HO) and expected (HE) heterozygosities for the three loci (
Pairwise
[Table 3.] Genetic variabilities at 3 loci of microsatellite DNA in Korean and Japanese ayu

Genetic variabilities at 3 loci of microsatellite DNA in Korean and Japanese ayu
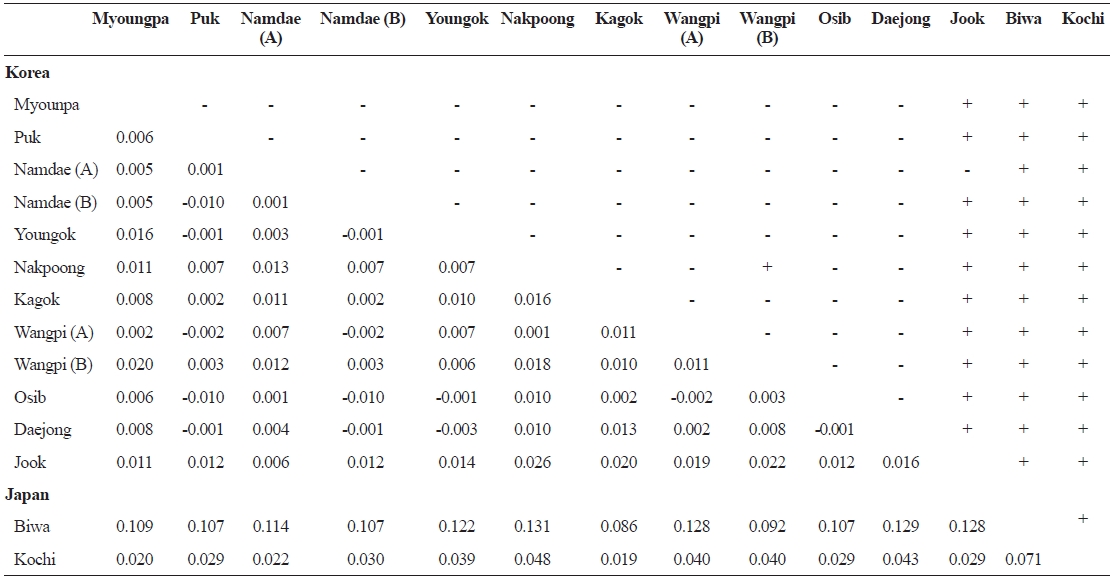
FST values between samples (below diagonal) and probability of differentiation with P value in FST estimate (above diagonal)
of
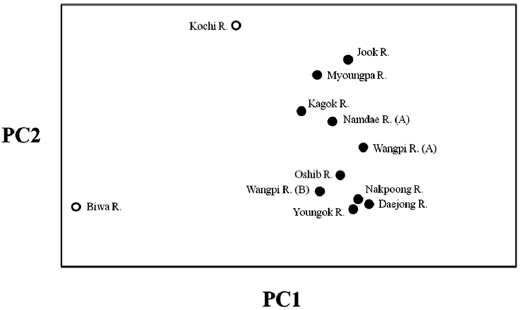
The lack of differentiation (Table 4) and the PCA indicated (Fig. 2) that there were no geographical trends among the popu-lations on the East Sea coast of Korea. Indeed, matrices of lin-earized genetic distance (

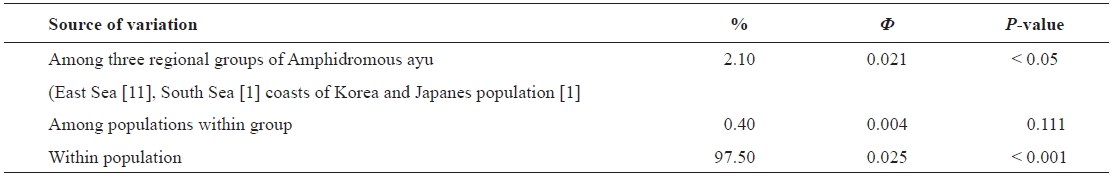
Analysis of molecular variance (AMOVA) based on microsatellite DNA variation in amphidromous ayu
level of gene flow through migration. The lack of regional equi-librium with isolation by distance within the Korean populations suggests that they may still remain in an unstable condition be-cause the equi-librium pattern with isolation by distance should require a sufficiently long period of time to achieve a stable condition (Hutchison and Templeton, 1999). However, pairwise population
The genetic structure of ayu populations in Korea and Japan was estimated by AMOVA (Table 5). The variation within three groups (East Sea coast, South Sea coast, and Japan coast) was 2.10% (
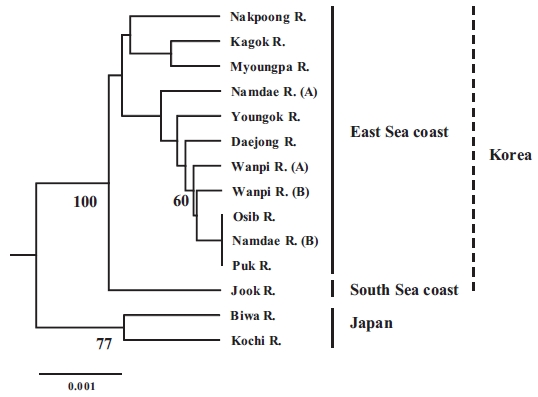
The populations examined in this study were clustered us-ing the neighbor-joining (NJ) method (Fig. 3). All of the Korean populations were separated from the two Japanese populations. The Jook River population was also separated from the cluster of the other Korean populations. Our findings support the pat-tern of genetic structure in wild ayu populations in Korea and Japan that has been revealed by genetic analyses (pairwise pop-ulation
In conclusion, our results suggest that the ayu populations on the East Sea coast of Korea form a single population, and all of
the Korean populations are distinct from the Japanese popula-tions. The observed importance of genetic variation and genetic structure will provide a means for defining evolutionary and conservation units for the management and sustainable use of ayu resources. Further analyses of other genetic markers, such as maternally inherited mitochondrial DNA, and studies that in-clude more populations from other areas of Japan would help identify gene flow patterns in ayu.