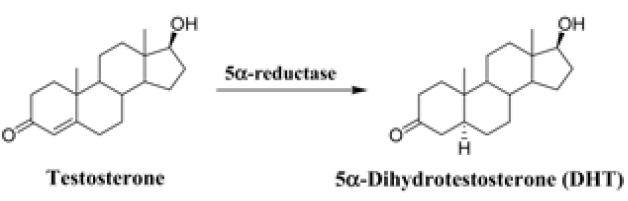
5α-Dihydrotestosterone (DHT) is primarily produced from a major androgen testosterone by the enzyme 5α-reductase (5αR), which is present throughout the body in two forms, type 1 and 2 (Figure 1). The formation of DHT is associated with the development of prostate diseases and androgenic alopecia.1-3 Finasteride, a selective inhibitor of 5αR type 2, has been medicated for both benign prostate hyperplasia (BPH) and male-pattern baldness (MBP) and suppresses serum DHT by about 70%.4
The quantitative analysis of steroid metabolites, including testosterone and DHT, and their interesting biological pathway have been used for physiological monitoring, toxicological evaluation, and disease diagnosis.5,6 In routine clinical screening, immunoassays have advantages but they are not selective in small molecule analysis, which can result in overestimations owing to the cross-reactions of antibodies.7,8 In contrast, gas chromatography-mass spectrometry (GC-MS)-based techniques show better quantitative reproducibility, and GC-MS profiling is widely used in steroid analysis.9,10 Isotope-dilution mass spetrometry (IDMS) is the primary method, using an adjusted isotope labeled standard to minimize run-to-run variations.11,14 In an isotope-dilution
assay, both accuracy and precision are potentially improved against other calibration methods owing to compensation by identical losses and correcting matrix effects.13
Liver S9 fraction is most frequently used in assays that measure the metabolism of xenobiotics, and it contains cytosol and microsomes, which are easier to prepare than purified microsomes.15 Therefore, we compared two different steroid profiling techniques with GC-IDMS14 and a traditional GC-MS method16 for quantitative detection of testosterone and DHT, in the evaluation of 5α-reductase activity after incubation of the rat liver S9 fraction.
Testosterone and DHT reference standards examined were obtained from Steraloids (Newport, RI, USA). The internal standards (ISTDs), 16,16,17-
>
Preparation of standard solution
The stock solutions of all the reference standards were dissolved in methanol at 100 μg/mL, and the working solutions were made up with methanol at concentrations of 0.01?10 μg/mL. Finasteride and testosterone used in the liver S9 fraction incubation system were made using DMSO at a concentration of 0.1 mM. All standard solutions were stored at ?20℃ until required.
>
Sample preparation of the liver S9 fraction
Male Sprague-Dawley (SD, 8-9 weeks) rats were obtained from Japan SLC, Inc. (Shizuoka, Japan). They were anesthetized with isoflurane before extraction of the liver. The liver was washed with PBS buffer and homogenized in five volumes of 20 mM potassium phosphate buffer containing 0.32 M sucrose and 1 mM DTT (pH 6.5). To remove the nuclei and other debris, the whole-liver homogenate was centrifuged at 1,000 g for 10 min. The liver S9 fraction was then obtained by centrifugation of the homogenate supernatant at 9,000 g for 30 min. The supernatant was then measured for protein content by Bradford’s assay.
>
Incubation of finasteride and testosterone with rat liver S9 fraction
Incubation was performed as described previously, with a minor modification.17-19 The incubation mixture consisted of 0.2 μM testosterone, a NADPH-generating system (0.5 μmol of NADP+, 5 μmol of glucose-6-phosphate, 5 μmol of MgCl2), 0.1 mM finasteride, and 500 μg of S9 fraction in a final volume of 0.5 mL of 40 mM potassium phosphate buffer (pH 6.5). The incubation was carried out at 37℃ for 1 h. An incubation system without finasteride was used as a control.
>
Comparative GC-MS methods in evaluation of 5α-reductase activity
Both the GC-IDMS method and the GC-MS-based steroid assay for quantitative detection of testosterone and DHT were based on our previous reports.14,16 Briefly, the microsomal fractions (0.5 mL) were spiked with 10 μL of ISTDs (
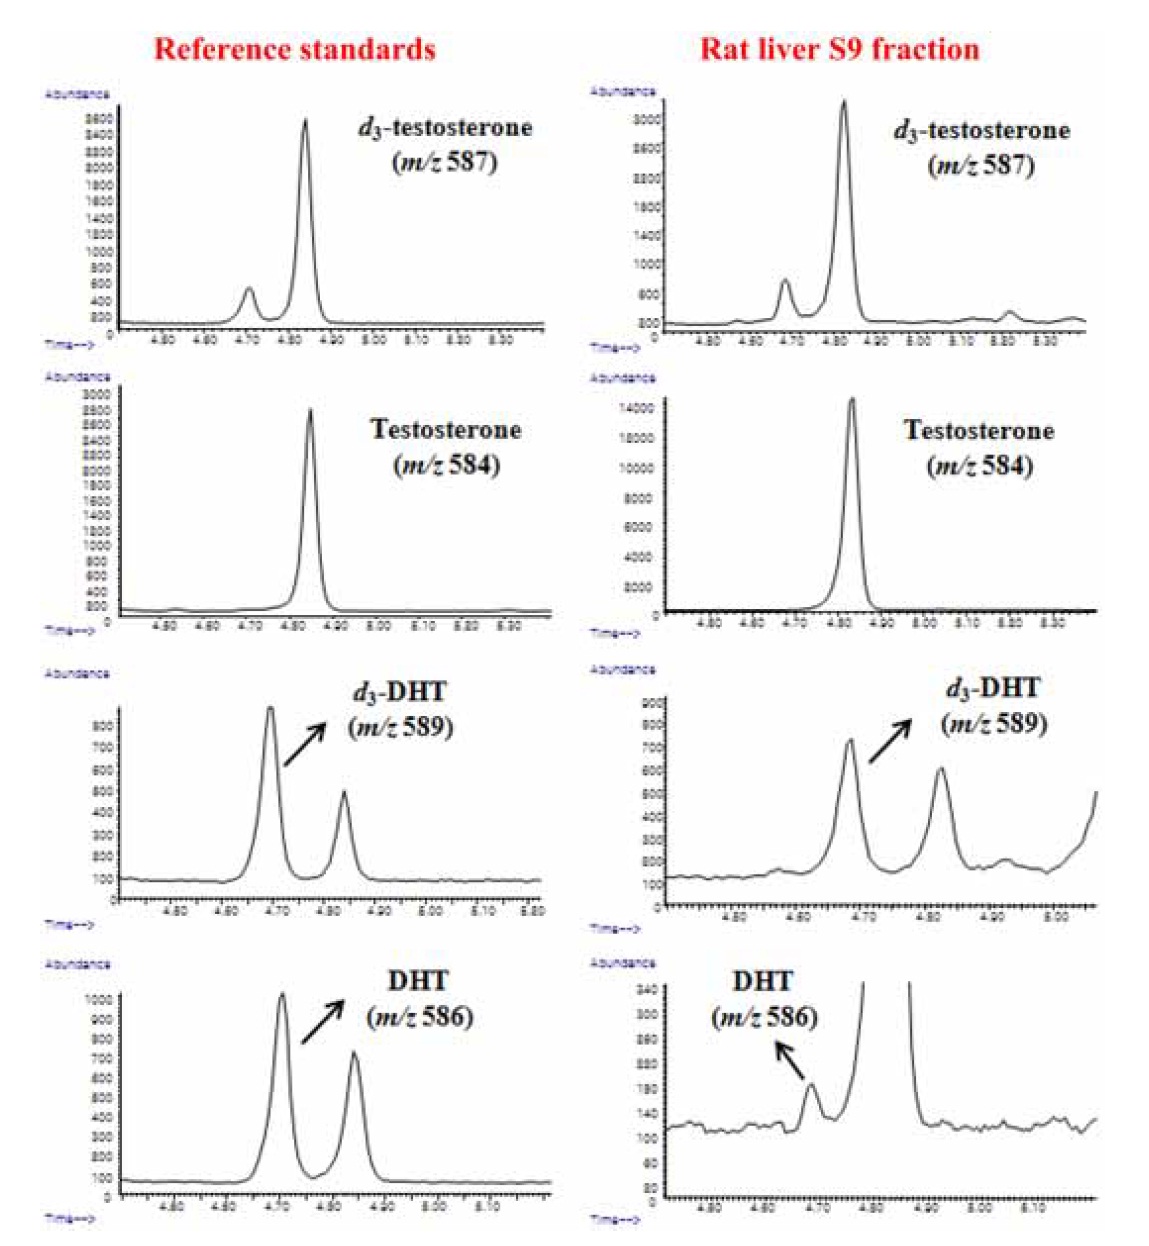
GC-IDMS analysis was performed using an Agilent 6890 Plus gas chromatograph interfaced with a single-quadrupole Agilent 5975 MSD at an electron energy of 70 eV. Each sample (2 μL) was injected in split mode (8:1) at 280℃ with helium as the carrier gas at 234.42 kPa (0.8 mL/min) and at a constant flow-rate, and they separated through an Ultra-1 capillary column (25 m × 0.2 mm i.d., 0.33 μm film thickness; Agilent Technologies; Palo Alto, CA, USA). The GC oven temperature was initially set to 280℃. It was then increased to 320℃ at 8℃/min; this temperature was maintained for 6 min, with an ion source temperature of 230℃. For quantitative analysis, the characteristic ions of each androgen were determined as their flophemesyl-TMS derivatives (Figure 2).
For steroid assay, the sample was injected in split mode (8:1) at 280℃ and separated using an Ultra-1 capillary column. The GC oven temperature was initially set to 215℃, increased to 260℃ at 1℃/min and then increased to 320℃ at 15℃/min; this temperature was maintained for 1 min. The carrier gas was helium at a constant head pressure of 255.1 kPa. For quantitative analysis, the characteristic ions of each steroid were determined as their TMS derivatives (data not shown).
>
Extraction of rat liver S9 fraction
Various techniques have been tested for the extraction of
[Table 1.] Extraction efficiencies of three different techniques for preparing rat liver fractions
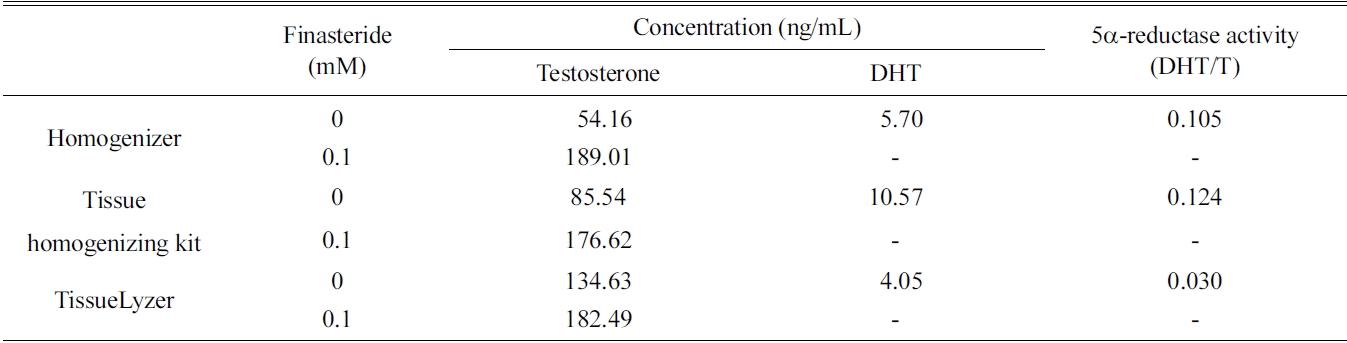
Extraction efficiencies of three different techniques for preparing rat liver fractions
the rat liver S9 fraction such as homogenizer, tissue homogenizing kit, and TissueLyzer. The 5α-reductase activity of all three fractions was measured, and the former two methods showed relatively low efficacy than that of the TissueLyzer (Table 1). However, the simple homogenizing technique was selected because the tissue homogenizing kit is designed only for small scale incubation.
>
Measurement of protein amount in rat liver S9 fraction
Solubilized protein content in the obtained S9 fractions were measured with a simple and accurate Bradford assay procedure. This required five dilutions of a protein standard, in this case bovine serum albumin (BSA), ranging from 5 to 20 mg/mL. These dilutions were incubated with Coomassie® Brilliant Blue G-250 dye at room temperature for 5 min and were then measured for absorbance at 570 nm by using a UV spectrometer. Comparison of the absorbance of the extract of rat liver S9 fraction with the BSA standard curve provided a relative measurement of protein concentration.
>
Evaluation of 5α-reductase activity
To quantitatively detect testosterone and DHT, both GC-IDMS and steroid assay were tested. The metabolic ratio of DHT to testosterone, which reflects the 5α-reductase enzyme activity,13,16 was evaluated. Owing to better selective and sensitive detection of DHT in the absence of finasteride when the concentration of testosterone was lower than 0.2 μM in the S9 fraction, the 5α-reductase activities could be comprehensively evaluated only by the GC-IDMS method.
Due to compensation by identical losses and correcting matrix effects in IDMS analysis, the devised GC-IDMS resulted in a precise and accurate quantification technique for evaluating 5α-reductase activity compared to the steroid assay. Owing to the easy preparation of the enzyme fraction, the combined method of GC-IDMS with rat liver S9 fraction assay can be useful for evaluating drug efficacy in large-scale clinical applications.