It is estimated that about 50% of all mammalian proteins are carrying glycan residues,1 and 30% of all proteins are phosphorylated.2 Protein post-translational modifications (PTMs) have been known as directly involved in protein function and cellular activities,3-5 therefore the identification and characterization of these PTMs from the same sample are the prerequisites for biological discovery. Due to the frequently low stoichiometry of PTMs and the ion suppression effect from unmodified peptides of high abundance, phosphopeptides and glycopeptides have to be isolated before MS analysis to minimize such suppression.6-10
So far, for protein fractionation to reduce sample complexity and increase the sensitivity, strong cation exchange (SCX)8,9 and anion-exchange (AEX) chromatography10 are the two most common types of chromatography. Recently, a novel mode of chromatography termed electrostatic repulsion hydrophilic interaction chromatography (ERLIC) was first introduced by Alpert for separation of biomolecules and phosphopeptide enrichment.11 It has been extended to the fractionation of N-linked glycopeptides from complex samples based on negatively charged sialyl group in glycopeptides.12 However, it might be able to enrich other hydrophilic glycopeptides when an oligosaccharide side chain is a large and hydrophilic domain that causes a significant increase in retention time of the peptide in any hydrophilic interaction liquid chromatography-based mode of ERLIC. Based on using AEX column set up at the ERLIC mode, the combination of electrostatic attraction and hydrophilic interaction suffices to pull phosphorylated tryptic peptides and many glycopeptides away from the unmodified peptides. The simultaneous characterization of the glycoproteome and phosphoproteome of mouse brain membrane has been achieved with ERLIC.13 The method was developed in optimization of mobile phases and gradient for comprehensive profiling proteome along with PTMs study.14
In this work, ERLIC was applied to simultaneously characterize phospho- and glyco-proteome of epicardial adipose tissue in obesity mouse.
PolyWAXTM packed with silica coated by cross-linked polyethyleneimine (200 × 4.6 mm, 5 μm particle diameter, 300 A0 pore diameter, item 204WX0503) was a product of PolyLC Inc. (Columbia, MD). The mobile phases which made by acetonitrile (ACN) and formic acid (FA) as described with 80% ACN, 0.1% FA as buffer A and 10% ACN, 2% FA as buffer B to establish 140 minutes gradient for ERLIC.14 The detector (Waters 484) was set up at wavelength 280 nm.
Six purified proteins purchased from Sigma Aldrich including bovine serum albumin (BSA), α-amylase, β-casein, β-lactoglobulin, transferrin, myoglobulin were used as the standard, with 500 μg each set. Samples were dissolved in 6M urea, reduced with 5 mM tris (2-carboxyethyl) phosphine (TCEP) (Thermo Scientific) at 37 ℃ and alkylated with 15 mM iodoacetamide in the dark. For digestion, sequence-grade trypsin (Promega) was added at ratio of 1:25 (trypsin/protein) then incubated at 37 ℃ overnight. The sample was cleaned up by a C18 spin column (Harvard Apparatus) and eluted by 80% ACN in 0.1% FA which can be immediately injected into ERLIC system.
>
ERLIC in phospho- and glyco-proteome study of epicardial adipose tissue from obesity mouse
Mouse was fed with fat diet for sixteen weeks, and then the epicardial adipose tissue was collected. Proteins were extracted and assayed by 2-D Quan Kit (GE Healthcare Life Sciences). 4 mg of protein was reduced, alkylated and digested into peptides mixture, which then cleaned up by SepPak cartridges. 2 mg of digest reconstituted in 200 μl of buffer A was loaded into a PolyWAX column. Fractions were collected at 1-min intervals. The consecutive fractions were combined, and finally a total of eight fractions were then dried, reconstituted into 30 μl of 25 mM NH4HCO3, and treated with 3 μL of 500 units/μl peptide-Nglycosidase F (New England Biolabs) at 37 ℃ overnight. All samples were dried in a SpeedVac.
To determine the efficiency of ERLIC in glycopeptides capturing, commercial hydrazide bead (Biorad) was tested with 2 mg of the same sample to compare. The procedure was followed the widely-used protocol for solid phase extraction of N-glycosylated peptides.15
Each dried fraction was reconstituted in 20 μl of 0.1% FA and analyzed three times using the 6520 Accurate-Mass QTOF LC/MS (Agilent Technologies, DE) coupled with the 1200 HPLC unit (Agilent). For each analysis, 5 μl of the samples was injected and separated in a capillary column packed with C18 at a flow rate of 0.3 μL min?1. Mobile phase A (0.1% FA in H2O) and mobile phase B (90% ACN, 0.1% FA in H2O) were used to establish the 30 min gradient of 5 to 45% B, 0?15 min; 45 to 90% B shocking, 15?15.01 min; 90% B, 15.01?20 min; 90 to 5% B, 20?20.01 min; and 5% B for 20.01?30 min. Peptide were then analyzed by at an electrospray potential of 1.8 kV. A drying gas flow of 5 Lmin?1, and the fragmentor of 175 V were used. The q- TOF was set to perform data acquisition in the positive mode that the m/z range of 100-3000 was used in the MS/MS scan.
Raw data from Q-TOF were converted to mzXML format and searched against the Mouse IPI (version 3.81). The database search was performed using both X!Tandem, Sorcerer (SEQUEST) with precursor and peptide mass tolerance of 50 ppm and 20 ppm respectively. The results were combined by iProphet. Carbamidomethylation (C) was set as a static modification, and oxidation (M), carbamylation at any residues, deamidation (N) after PNGase F deglycosylation for glycopeptides and phosphorylation (S, T and Y) for phosphopeptides were set as variable modifications. Peptides indentified with a consensus N-X-S/T (with X is not Proline) and a modification of deamidation of Asparagine were regarded as N-linked glycopeptides. PeptideProphet and ProteinProphet were used to evaluate the quality of peptide and protein identification with error rate less than 1% and 5% respectively.
>
Protein classification and functional annotation using MetaCore
MetaCore version 6.4 (GeneGo Inc. St. Joseph, MI, USA) (www.genego.com) was used to classify and annotate the identified.
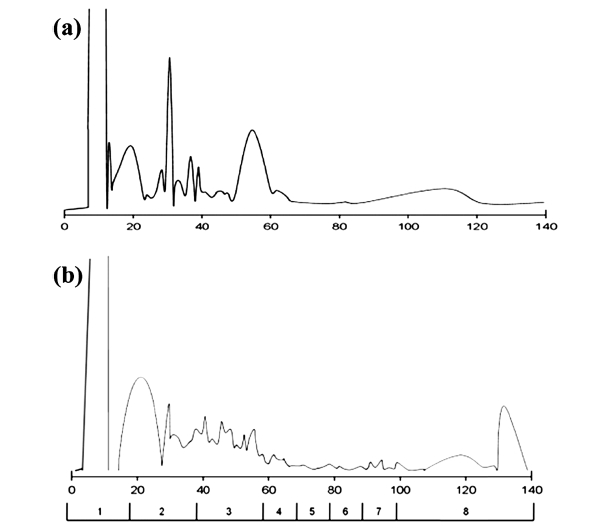
According to the principle of peptide fractionation by ERLIC, unmodified peptides hypothetically eluted in early fractions whereas glycopeptides retained in column and come out later.
The chromatography system was tested first with 500 μg peptide mixture of 6 purified proteins, signal was detected at 280 nm in 140 minutes of gradient. Chromatogram generated as Figure 1a demonstrated that ERLIC is capable in peptide fractionation and ready to be applied on biological samples. A 2 mg protein extracted from epicardial adipose tissue of 16-week high fat diet mouse was digested and peptides were injected into ERLIC. In each ERLIC run, a total of 140 fractions were collected, but only eight fractions were finally submitted for LC-MS/MS analysis by combining twenty (early stage) or ten (late stage) consecutive fractions (Figure 1b) as we anticipated the peptide complexity to be substantially reduced such that it was below the detection sensitivity of one-dimensional LC-MS/MS.
>
Identification and characterization of subproteome
Protein identification was achieved by using two search engines, SEQUEST and Tandem. We unambiguously identified 159 unique phosphoproteins matched with 75 phosphoproteins. Meanwhile, totally 802 unique peptides were detected with N-linked glycosylation sites validated by consensus sequence N-X-S/T, assigned to 313 glycoproteins. In addition, only 219 unique glycopeptides and 96 glycoproteins were recovered from the hydazide resin bead. Certainly, ERLIC showed the better performance in glycoproteome enrichment much more than the common widely-used hydrazide approach.
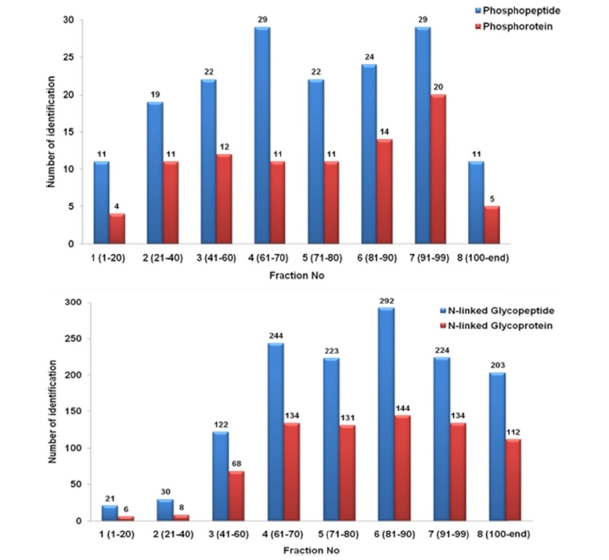
Figure 2 presented the distribution of subproteome through fractions. It clearly showed that, phosphopeptides and glycopeptides were eluted later with fewer identification in the earlier fractions (less than 1% in fraction 1 and 2) and more in the later fractions (70?90 % specificity in fraction
3?8). The results confirmed that these two modified peptides had an elution profile different from intact peptides under two-buffer elution system.
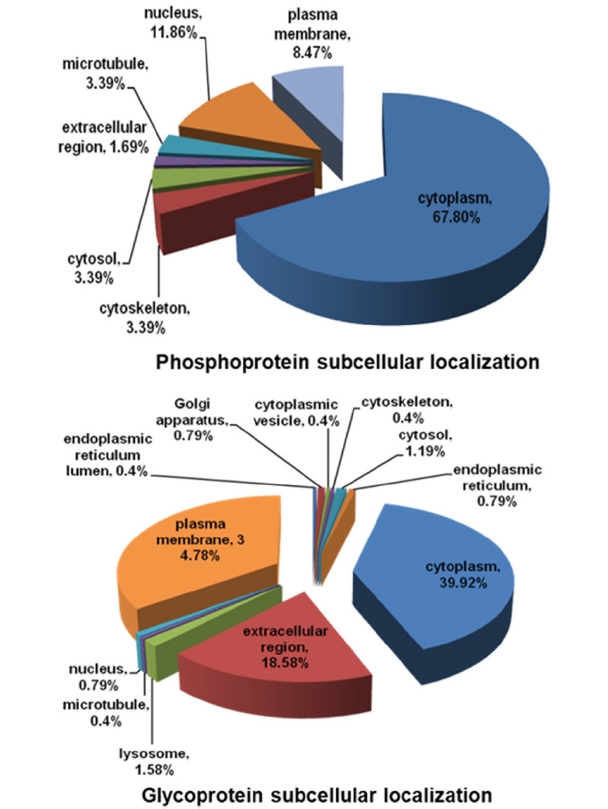
In addition, the identified were categorized according to their subcellular locations using GeneGO program. The venn diagram in Figure 3 showed that most of phosphoproteins exist in cytoplasm (67.8%) and nucleus (11.86%), whereas higher abundance glycoproteins distributed at cytoplasm (39.92%), extracellular membrane (34.48%) and extracellular region (18.58%). Study of both subproteomes might suggest some insights about correlation between intra- and extracellular signaling pathways.
>
Simultaneous phosphorylated and N-linked glycosylated proteins
Notably, among identified results, there are four proteins listed with both phosphorylated and glycosylated sites, demonstrating the potential of ERLIC method for simultaneous characterization of post-translational modifications in a single protein, for example, alpha-2-hs-glycoproteins (Ahsg), Low-density lipoprotein receptor-related protein 2 (Lrp2), myosin-9 and serum deprivation response protein. Of these, phosphorylation and glycosylation occurs at the different sites of proteins results in different modified peptides observed. These results are in very good agreement with known facts regarding the identified may have
roles in physiological processes in obesity biospecimen.16,17
>
Functional annotation of proteins involving adipose tissue of obesity sample
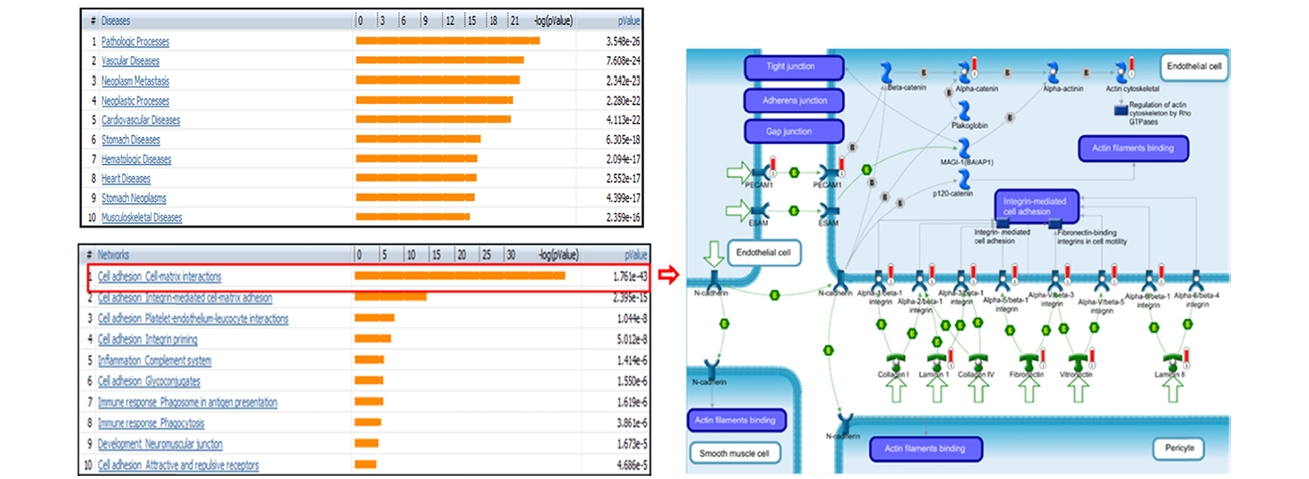
From the list of the identified, we performed functional studies of phospho- and glyco- proteins of epicardial adipose tissue from high fat diet mouse using MetaCore software. The top-scored diseases correlative with the identified showed the high relevance with obesity syndromes, significantly expressed with vascular diseases, cardiovascular diseases or heart diseases (Figure 4). In addition, the top-scored of GO process networks were built with the highest probability of Cell adhesion_Cell- matrix interactions which associated with pathological impairment of the structure and function of adipose cells in obesity phenotype, results in the initial stage of pathologic processes.18
ERLIC is a simple and robust approach for the recovery of not only glycoproteins but also phosphoproteins. The combination of both hydrophilic and electrostastic repulsion modes enabled this method to comprehensively identify PTMs from complex sample in one run experiment without any further clean up steps. Moreover, glycopeptides were collected from ERLIC fraction with their attached glycan, which could permit further glycan analysis. We expect that ERLIC could help to uncover more phospho- and glycoproteins and novel PTM sites from biomarker discovery