The synthetic inhibitors of phosphodiesterase type 5 enzyme (PDE-5) including sildenafil, vardenafil and tadalafil, are generally prescribed for the treatment of erectile dysfunction (ED). Recently, many dietary supple- ments claimed for effective ED treatment are easily accessible
Among the various techniques had been developed for the simultaneous determination of ED inhibitors and its analogues3, liquid chromatography (LC) combined with tandem mass spectrometry (MS/MS) with selected reaction monitoring (SRM) mode has been widely used, because of its excellent sensitivity and selectivity4. Although SRM-based MS approach is useful for the determination of target molecules, the selective nature of SRM can conceal the other valuable information such as the presence of other (nontargeted) potential adulterants. Considering these points, high resolution/mass spectrometry seems to be the best candidate for simultaneous screening of both targeted and non-targeted analysis. The use of high resolving power-mass spectrometry, such as a linear ion trap coupled with an Orbitrap (LTQ-Orbitrap), might further improve the confidence in screening results obtained by full-scan accurate mass. The use of reconstructed ion chromatograms (RICs) with very narrow mass tolerance windows (< 10 ppm) is an efficient way to improve the selectivity and sensitivity of an LC-MS method5. However, the use of narrow mass tolerance windows is only feasible when the mass spectrometer provides sufficient resolving power to discriminate target molecules from isobaric co-eluting sample matrix compounds6. To our knowledge, no method has been developed to screen PDE-5 inhibitors in dietary supplements using liquid chromatography-highresolution/ tandem mass spectrometry (LC-HR/MS).
In this paper, we report a rapid and sensitive analytical method for simultaneous screening of nine PDE-5 inhibitors using LC-HR/MS. This method applies to the determination of those substances in the illegal dietary supplements.
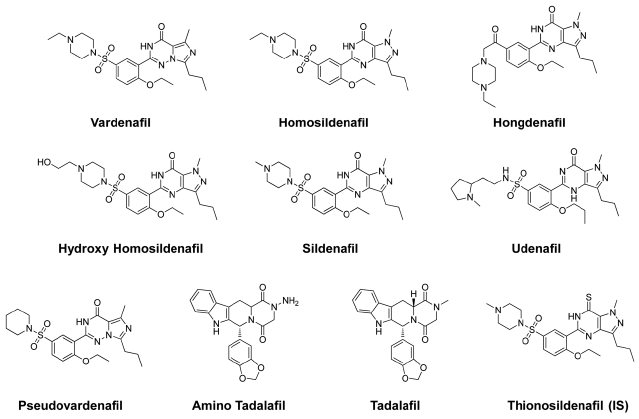
Standard references of sildenafil and its derivatives (vardenafil, homosildenafil, hongdenafil, hydroxyl homosildenafil, udenafil, pseudovardenafil, amino tadalafil, and tadalafil) including tablet of drugs were provided by Drug Analysis Center (Supreme Prosecutors’ Office, Korea). The other four pellet-typed natural products (Schizandra & balloon flower, pine needles, kelp and glasswort) were purchased from Pluslife (Seoul, Korea) (Table 3). Thionosildenafil as an internal standard (IS) was synthe- sized at Korea Institute of Science and Technology (Seoul, Korea). The structures of these drugs and IS, are shown in Figure 1. HPLC grade solvents (acetonitrile and methanol) were purchased from Burdick & Jackson (Ulsan, Korea). Formic acid was obtained from Sigma (St. Louis, MO, USA). All other chemicals were analytical grade commercially available.
>
Standard solutions and blank suspension
Standard stock solutions at concentration of 1000 mg/mL were prepared by dissolving each nine standard references in methanol. The nine standard stock solutions were mixed and diluted with methanol at concentrations of 2, 5, 10, 50 and 100 μ;g/mL for the preparation of calibration samples. All stock solutions were stored at 4 ℃ and brought to room temperature just before use.
To prepare the blank suspension, 1000 mg sample of each four kinds of natural supplements (pellet) were taken, mixed and ground into fine powders. 1000 mg of sample powders was transferred to a volumetric flask (100 mL) and ultrasonically extracted with 100 mL methanol for 30 min.
Calibration samples at concentrations of 40, 100, 200, 1000 and 2000 μ;g/g powders were prepared by adding 0.2 mL of each calibration solution (2, 5, 10, 50 and 100 μ;g/mL) to 1 mL of blank suspension (10 mg powders/mL). Quality control samples used in the validation study at concentrations of 40, 200 and 1,000 μ;g/g were prepared by the same way. 400 μ;L of IS solution (0.5 mg/mL in acetonitrile) was added to 100 μ;L of calibration samples or
quality control samples. After mixing and centrifugation, the supernatants was filtered through a 0.45 μ;m membrane filter and directly injected into the LC-HR/MS.
Analysis of the drugs was performed on a Finnigan LTQ Orbitrap mass spectrometer (Thermo Fisher Scientific, San Jose, USA) equipped with a binary pump system (Thermo Fisher Scientific, San Jose, USA). The analytical column was a reversed-phase C18 (100 mm × 2.1 mm i.d., 5 mm, Neston, UK). The mobile phase consisted of (A) water with 0.1% formic acid and (B) acetonitrile with 0.1% formic acid. A linear gradient was employed from 20 to 95% (B) for 6 min with a flow rate of 0.3 mL/min. Column temperature was maintained at 30 ℃ using a column oven controlled by thermostat.
Electrospray ionization (ESI) was performed in the positive mode with nitrogen as sheath gas, sweep gas and auxiliary gas with the optimum values set at 40, 5, and 20 (arbitrary units). The capillary temperature was set at 320 ℃ and ESI spray voltage was adjusted to 5 KV. The mass spectrometer was operated at a resolution of 30,000. The full scan was acquired in centroids mode for each target molecules in the range of
Linearity and calibration curve
The calibration curves for sildenafil and its derivatives were generated by plotting the peak area ratio of standard to the IS versus the concentrations of reference in the calibration range by least-square linear regression. The dynamic ranges constructed from 40 to 2000 μ;g/g for all reference standards.
Accuracy and precision
Quality control samples at concentrations of 40, 200 and 1000 μ;g/g (n = 3) were prepared and assayed to determine the accuracy and precision of an analytical method. The accuracy and precision were determined using intra-day and inter-day (3 days) data. The lower limit of quantification (LOQ) was determined as the lowest concentration on the standard calibration curve which was measured with an accuracy of between 80% and 120% and a precision of less than 20%.
This method was developed for the simultaneous determination of sildenafil and its derivatives in natural dietary supplements using a high resolution mass spectrometry with a positive-ESI mode. All nine analytes produced the protonated molecule [M+H]+ that could be detected as base peak ions ranging
[Table 1.] Names and compositions of nine standard references
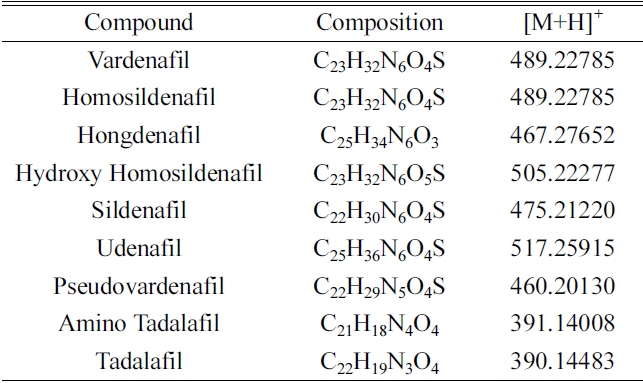
Names and compositions of nine standard references
ions. Therefore, a full scan mode was performed in the range of
The use of reconstructed ion chromatograms (RICs) with very narrow mass tolerance windows enabled the discrimination of the target molecules from sample matrix and improved the selectivity of an LC-MS method.
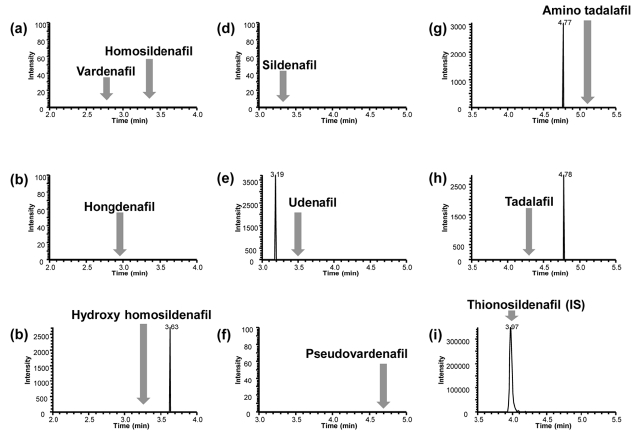
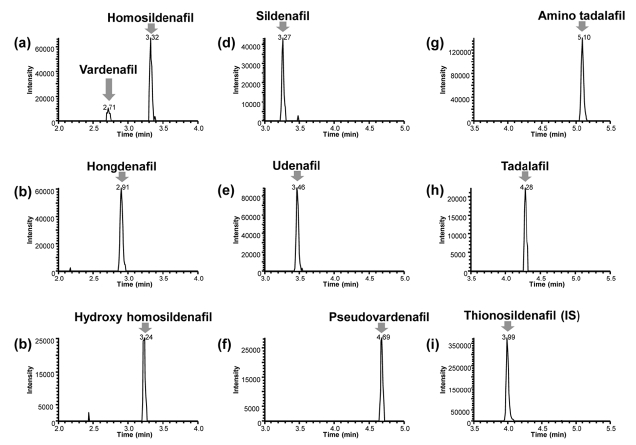
Representative chromatograms of blank sample spiked with IS and the calibration sample at the lowest concen- tration are shown in Figure 2 and 3, respectively. No interfering peaks were observed near the retention time of all target molecules in the blank sample matrix. The signal to noise (
Calibration standards of all nine target molecules were prepared by spiking appropriate amount of the standard solutions over the concentration range from 40 to 2000 μ;g/ g. The correlation coefficient (
[Table 2.] Intra-day and inter-day validation
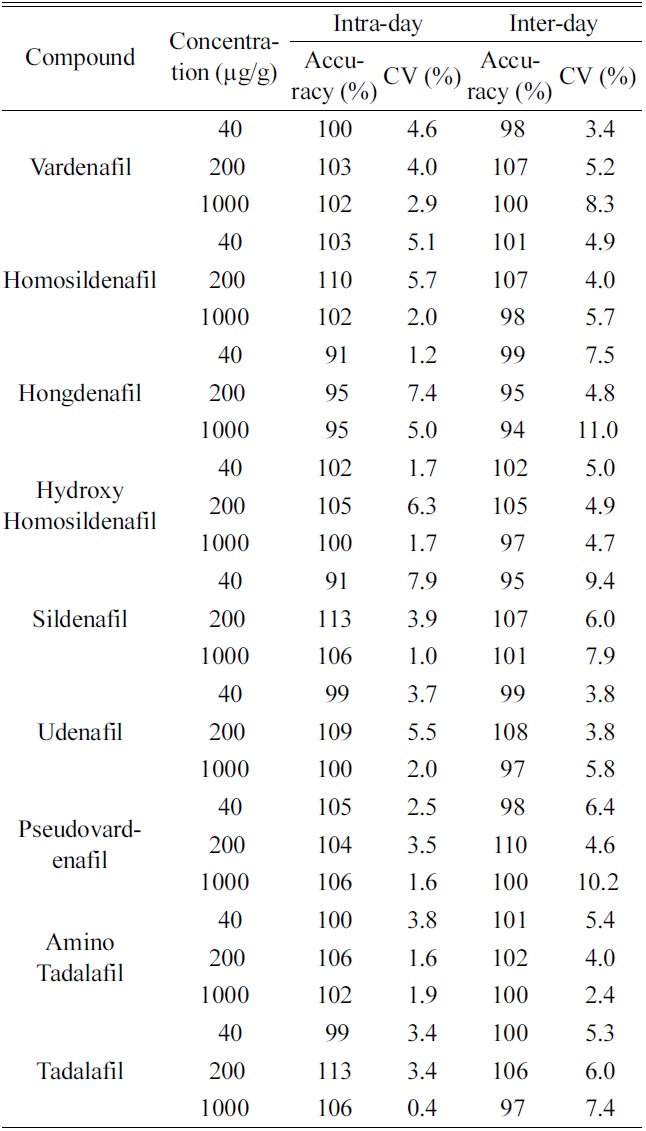
Intra-day and inter-day validation
[Table 3.] Determination of PDE-5 inhibitors in dietary supplements
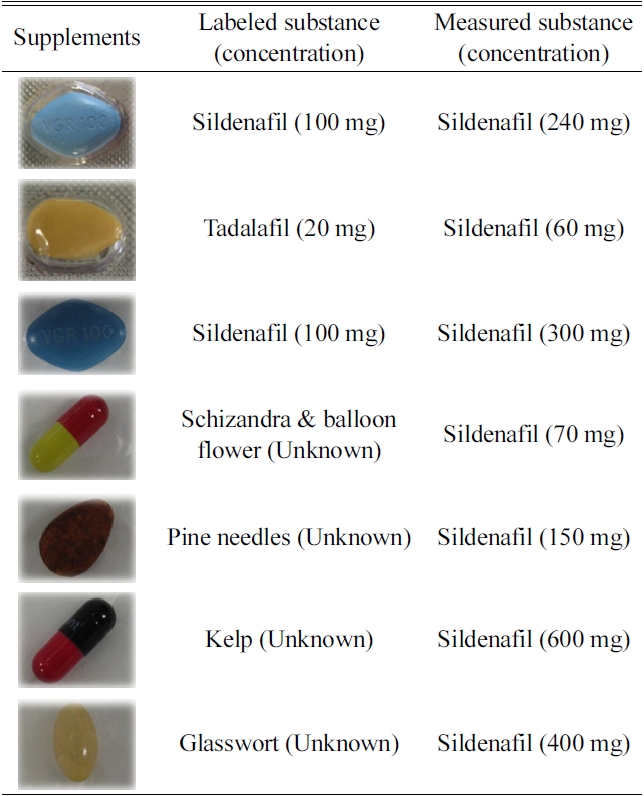
Determination of PDE-5 inhibitors in dietary supplements
observed for all substances (
>
Precision, accuracy and sensitivity
To evaluate precision and accuracy, the intra-day and inter-day validations were performed by determining quality control samples at three concentrations levels (40, 200 and 1000 μ;g/g). The intra-day and inter-day variation for nine PDE-5 inhibitors over the entire concentration ranges are presented in Table 2. The intra-day coefficients of variation were 0.4?7.9%, and accuracies ranged 91?113%, respectively. The inter-day coefficients of variation were 2.4?11.0%, and accuracies ranged 94?110%, respectively.
The lower limit of quantification (LOQ) was determined as the lowest concentration on the standard calibration curve which was measured with an accuracy of between 80% and 120% and a precision of less than 20%. The current assay had the LOQ of 40 mg/g for all nine PDE-5 inhibitors.
>
Determination of PDE-5 inhibitors in supplements
The developed method was applied to the analysis of the seven illegal supplements including two tablets of unofficial Viagra and one of Cialis, and four pellets of natural products, supported from Supreme Prosecutors’ Office (Table 3). The results revealed the serious in consistent doses of active pharmaceutical ingredients in illegal supplements, suggesting that the indiscriminate administration of these illegal supplements could run into danger.
A simple and rapid LC-HR/MS method has been developed and validated for the simultaneous determination of sildenafil and its derivatives in the illegal supplements. The present method was accurate and reproducible with 40 μg/g of the limit of quantification and useful for the analysis of the PDE-5 inhibitors in the illegal supplements.