Triacylglycerols (TGs) are essential fatty acids, and the major components of naturally occurring fats and oils from animal and vegetable sources consisting of 95-98% of the whole oil compositions.1 Structurally, TGs consist of three fatty acids esterified to a glycerol molecule.2 In human beings, TGs as source of energy are stored in fat tissues, and in thermal and mechanical protective layers surrounding important organs. They are playing an important part of human diet and their imbalances can lead to several human diseases, i.e. coronary heart disease, dyslipidaemia, obesity or inborn errors of metabolism.3 Malabsorption of fat is one of the most important gastrointestinal causes of malnutrition and growth retardation in childhood. Steatorrhea is the presence of excess fat in feces, and has a symptom of disorders of fat metabolism and malabsorption syndrome. The detection of steatorrhea is useful for the diagnosis of intestinal and pancreatic disease.4 Major methods to diagnose steatorrhea include van de Kalmer method,5 Sudan staining,6 Steatocrit test,7 and acid steatocrit test.8
Van de Kalmer method requires large samples and often takes as long as a week to complete the analysis.5 Sudan staining is the use of Sudan dyes to stain Sudanophilic substances in the feces. Normally a stool sample of a healthy subject should show only a few drops of red-orange stained fat under the microscope.6 Steatocrit test or acid steatocrit test (separation of homogenate fecal by centrifugation) is a simple, rapid and semi-quantitative method to determine steatorrhea.7,8
TGs have been separated using several chromatographic techniques such as gas chromatography (GC), super critical fluid chromatography and high-performance liquid chromatography (HPLC), and others. Analysis of TGs using GC requires a step to derivatize TGs due to its nonvolatile properties. HPLC methods are widely used in the analysis of TGs mixtures using silver ion normal-phase HPLC (Ag- HPLC)9,10 and non-aqueous reversed-phase HPLC (NARPHPLC). 11-13 Ag-HPLC is very successful in the separation of lipids differing in the number and positions of double bonds as well as cis/trans isomerism. The retention of TGs in AG-HPLC increases as the number of double bonds increases, but the method has a low selectivity in the saturated part of the molecules.14-17 Separation by NARPHPLC is reserved for very hydrophobic samples that are retained strongly and not eluted by 100% acetonitrile (ACN) as mobile phase.18 Several detectors are generally coupled with NARP-HPLC for TGs analysis. UV detection at low wavelengths (205 or 210 nm) provide a linear response; however, a low sensitivity for saturated TGs has been reported.19,20 Evaporative light scattering is also employed, but is not appropriate for quantitative analyses due to the non-linear response.19 The refractive index detection cannot be applied with gradient elution21 although it is often used for routine quality control. Recently, mass spectrometry (MS) combined with atmospheric pressure chemical ionization (APCI) have been reported in the detection of TGs.3,22,23 However, when a mixture of TG was separated using RP-HPLC and identified using APCI-MS, the minimal fragmentation in APCI produced intense diacylglycerols ions24,25 and less information about molecular weight of the TGs is provided in general. During the interpretation of APCI mass spectra, the lack of intact protonated molecules produced from some oxygen functional group containing TGs is another shortcoming.26
The objective of this study was to develop a rapid, simple, and quantitative liquid chromatography-electrospray ioniza tion/mass spectrometry (LC-ESI/MS) method for simultaneous determination of oleins in steatorrhea. The current steatorrhea analysis is complex, time-consuming, nonquantitative, and therefore a new quantitative and accurate method is needed. We developed a method for the simultaneous determination of triolein, diolein, and monoolein in mouse feces using LC-ESI/MS after oral administration of triolein. In the future, this analysis can become an accurate and routine method for early diagnosis of fat malabsorption disease.
Reference standards of triolein, diolein, and monoolein were obtained from Sigma-Aldrich (St. Louis, MO, USA). 1,1,1-13C3-Triolein as the internal standard (IS) was purchased from Cambridge Isotope Laboratories (Andover, MA, USA). Orlistat was a product of Biocon (Bangalore, India). Sudan IV was obtained from Sigma (St. Louis, MO, USA). All organic solvents, methanol, acetone and isopropyl alcohol were of analytical or HPLC grade and purchased from Burdick & Jackson (Muskegon, MI, USA). Deionized water was prepared using a Milli-Q purification system
[Table 1.] The LC-ESI/MS information of oleins analyzed
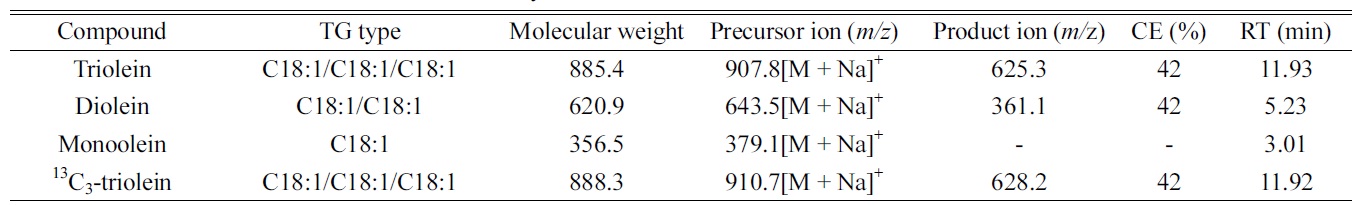
The LC-ESI/MS information of oleins analyzed
(Millipore, Billerica, MA, USA).
>
Standard solutions and quality-control samples
The stock solutions of all the reference standards and IS were dissolved in ethanol at 1 mg/mL, and the working solutions were made up with ethanol at concentrations of 1, 10, and 100 μg/mL. The IS working solution at 10 μg/mL was prepared by diluting the IS stock solution. All standard solutions were stored at ?20 ℃ until required. The qualitycontrol (QC) samples were prepared using olein-free fecal extract spiked with oleins at three different concentrations (1, 5, and 20 μg/mL).
LC-ESI/MS analysis was performed using Shiseido Nanospace SI-2 high performance liquid chromatograph (Tokyo, Japan) interfaced with an ion-trap ThermoFinnigan LCQ Advantage mass spectrometry (San Jose, CA, USA). All oleins were separated using a Sunfire C8 (150 mm length × 2.1 mm i.d., 3.5 μm particle size; Waters, Milford, MA, USA) at 150 μL/min. After injection, the mobile phase consisting of A (methanol) and B (acetone-isopropyl alcohol (1:1, v/v)) was controlled as follows: 0 min at 1% B; 0-7 min, 1-50% B; 7.1-17 min, 50-60% B; 17.1-19 min, 60-95% B; 19-20 min, 95-1% B. The gradient was then returned to the initial condition (1% B) and held for 10 min before the next sample was run. All oleins were detected in positive ionization with their [M + Na]+ ion as the precursor ion (Table 1). The mass spectrometry was operated under the following optimized conditions: ion spray voltage, 5.5 kV; capillary voltage, 18 V; tube lens offset, 30 V; capillary temperature, 280 ℃ ; multiplier voltage, 400 V. Nitrogen was used as the sheath gas at 20 arbitrary units. Mass spectra were acquired in the range of
Female BALB/c (7 weeks) mice were obtained from NARA biotech Co. Ltd (Seoul, Korea). They were housed under a 12 h light/dark cycle in a cage and given food and water
use. To 200 μL of supernatant, 25 μL of internal standard (IS) solution containing 1,1,1-13C3-triolein (10 μg/mL) was added. The mixture was vortexed for 30 s and then filtrated using polyvinylidene fluoride (PVDF) membrane syringe filter (0.2 μm pore size; Millipore). Three microliters of the filtrate was subjected to LC-ESI/MS analysis.
The QC samples containing the oleins were quantified using the peak area ratios of each olein versus the corresponding IS. Calibration samples were made up at twelve different concentrations, which depended on the sensitivity. The limits of detection (LOD) and quantification (LOQ) were defined as the lowest concentration with a signal-to-noise (S/N) ratio > 3 and 10, respectively. Three samples at three different concentrations (1, 5, and 20 μg/ mL) were analyzed. Precision and accuracy were expressed as the coefficients of variation (% CV) and the percentage relative errors (% bias), respectively. The intra- and interday assays were determined by the analysis of five replicates and the running of the samples on five different days. The extraction recoveries were determined using the QC samples at three different concentrations by adding known amounts of analytes to the olein-free samples.
Thin layer chromatography (TLC) experiments were performed on 5 × 10 cm aluminum-backed precoated silica gel HPTLC 60 Merck-5556-4 plates (Merck, Whitehouse Station, NJ, USA). The mobile phase was methyl alcohol: chloroform = 1:4 by volume. Sudan IV, a red dye, was visualized by naked eye. TLC plate was scanned by a laser scanner for image analysis. After scanning, the plate was immersed in 10% sulfuric acid solution briefly. TLC plate was heated to about 250 ℃ for about 10 minutes on a hot plate to reveal charred black carbon for sample detection. The plate was scanned once again for image processing of blackened spots. Each spot on the scanned images was processed by using Photoshop software. The area and average intensity was evaluated to calculate the intensity (= area x average intensity) for each spot.
>
Optimization of the LC-ESI/MS conditions
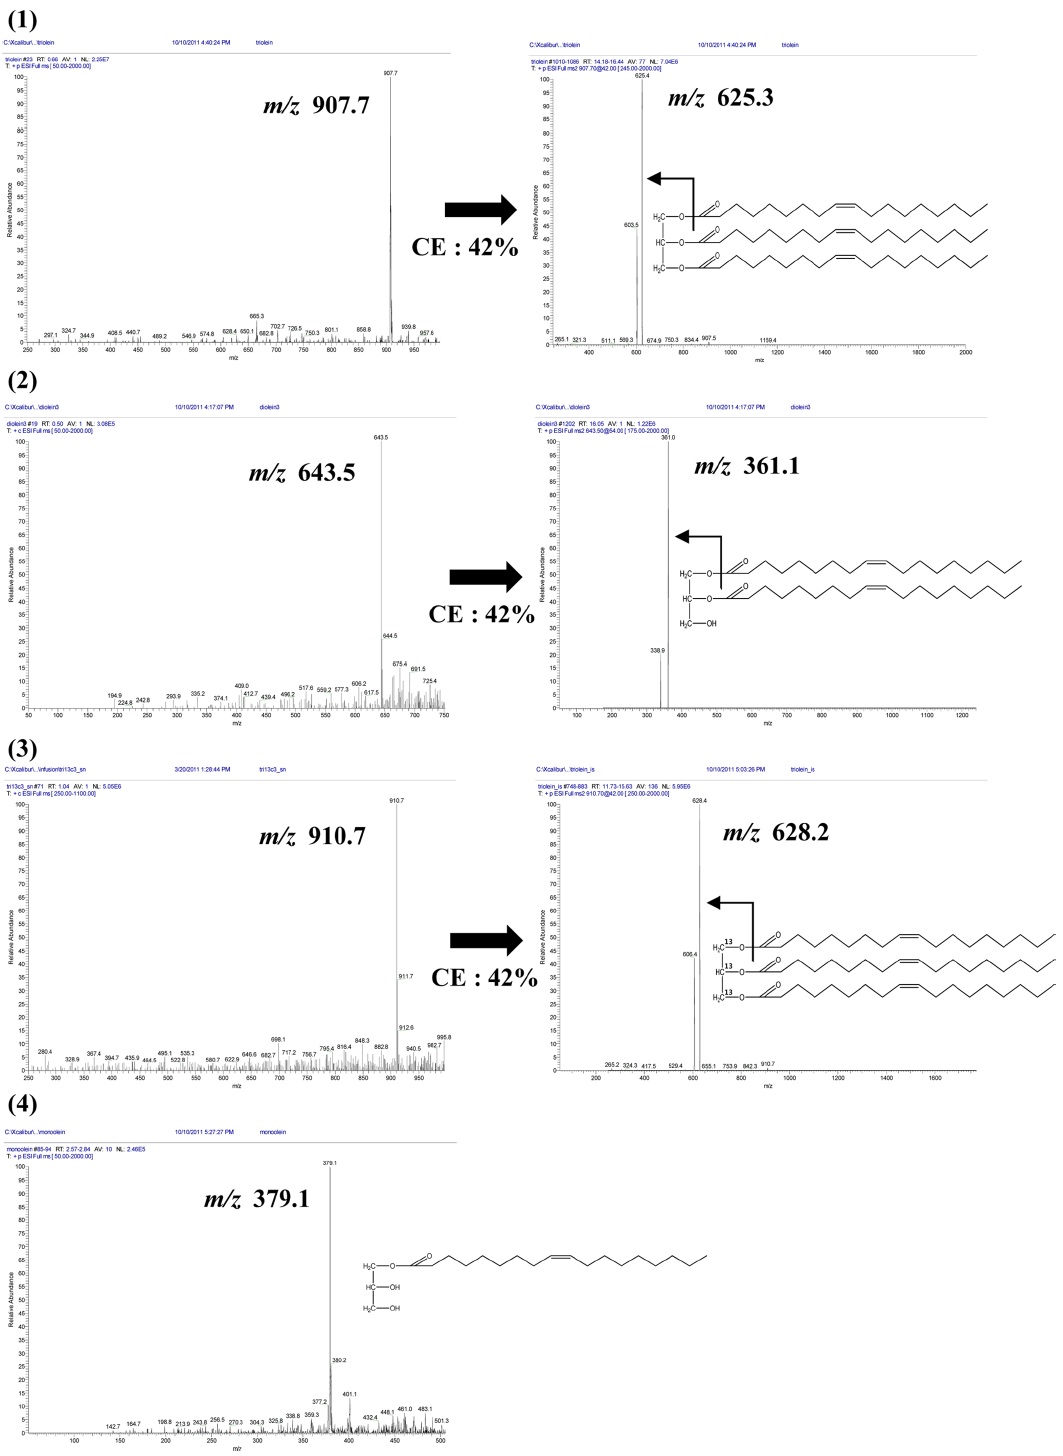
The mass spectra of the analytes and IS demonstrated a sodium adducted ions [M+Na]+ at
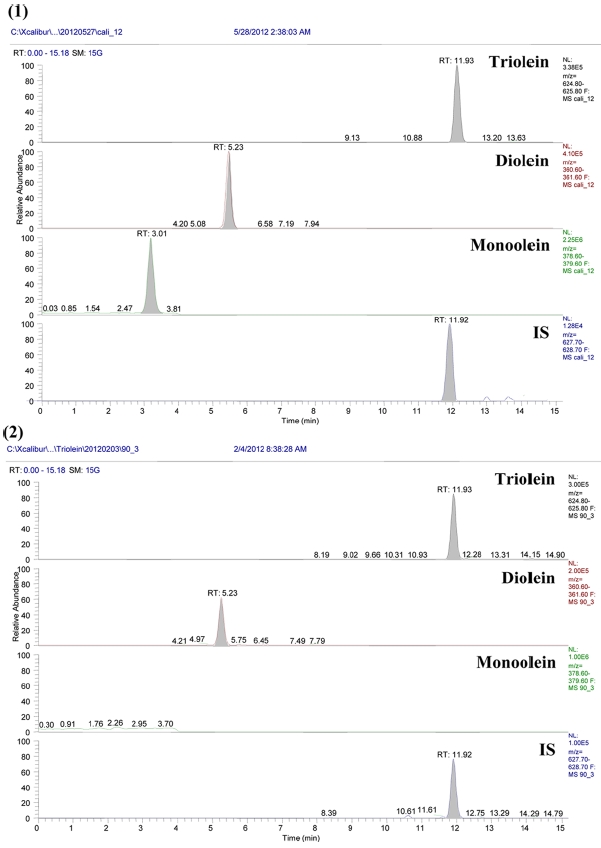
Separation of TGs required non-aqueous reversed-phase chromatography (NARP), because hydrophobic samples are strongly retained in RP column and are not eluted by 100% ACN as the mobile phase.27,28 The mobile phase for NARP separations will therefore consist of a mixture of more polar (A-solvent) and less polar (B-solvent) organic solvents. Often the A-solvent can be ACN or MeOH, while the B-solvent can be acetone, chloroform, iso-propyl alcohol, methylene chloride, or other less polar organic solvents. Sample retention is controlled by the gradient mode by varying the percentage and/or the polarity of the B-solvent. Both C8 and C18 columns are considered as examples of reversed phase liquid chromatography (RP). The difference between the two columns will be in the length of the carbonchain attached to the silica surface. Both are reversed phase, but C18 columns will be more hydrophobic rather than the C8 columns. So, we used C8 column as a less hydrophobic column with symmetric peak shape and optimized RT. Under the LC conditions used, chromatographic resolution was improved oleins were separated within 30 min in olein standards (triolein, diolein, monoolein and 13C3-triolein) and mouse feces sample (Figure 2).
Method validation required an LOD, an LOQ, linearity,
[Table 2.] Validation results of intra- and inter-day assays for the oleins
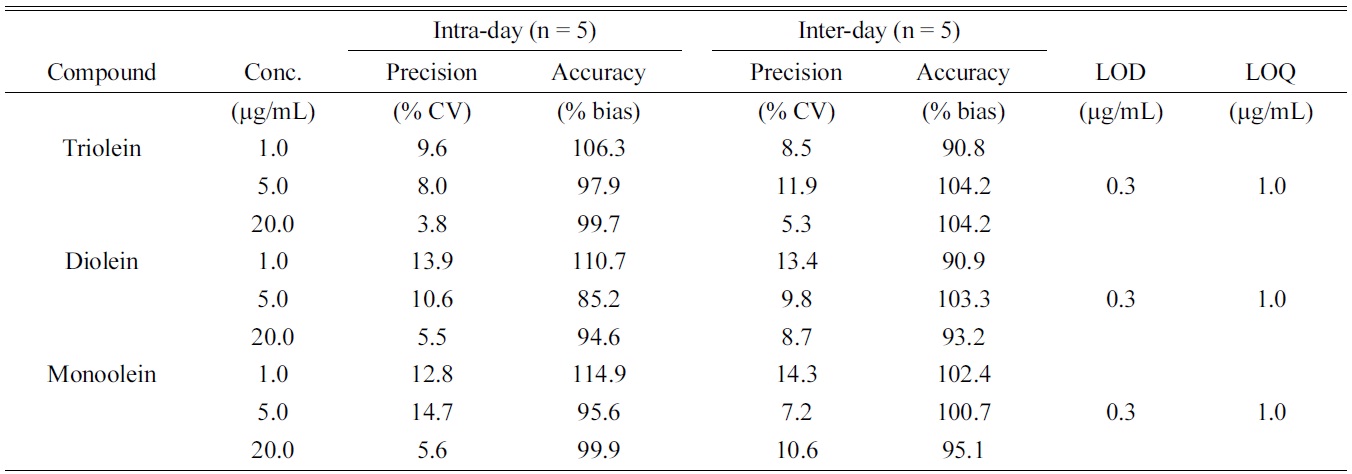
Validation results of intra- and inter-day assays for the oleins
recovery, precision, and accuracy using QC samples. A calibration curve was generated for all analytes using the QC samples fortified with all reference standards at three different concentrations (1, 5 and 20 μg/mL) for the three oleins. Quantification was based on peak area ratios versus the IS. Calibration samples were prepared at twelve different concentrations (each containing triolein, diolein and monoolein). Least-squares regression analysis was performed on peak area ratios obtained at different concentrations to obtain the calibration curves. The assay method was found to be linear and all the validation parameters were within acceptance range. Triolein, diolein and monoolein had an LOQ of 1.0 μg/mL. The devised method was found to be linear (R2 = 0.994 ? 0.999) over the dynamic ranges (LOQ-50 μg/mL each; Table 2). Precision and accuracies were determined by the analysis of the prepared QC samples. The intra-day (n = 5) precision (% CV) was 3.8-14.7%, while the accuracy (% bias) was 85.2- 114.9%. The inter-day (n = 5) precision and accuracy was 5.3-14.3% and 90.8-104.2%, respectively.
>
Quantification of oleins in mouse feces
Fat in the mouse feces and fur were extracted and homogenized as above. We determined the concentrations of oleins (trioein, diolein and monoolein) in mouse feces
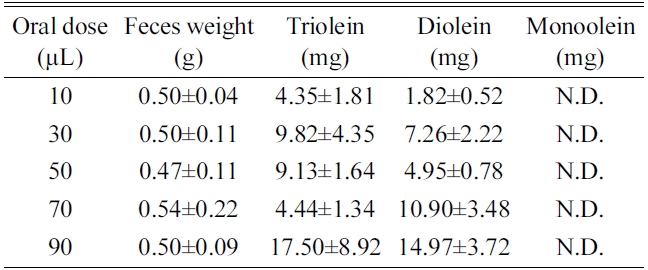
[Table 3.] Result of triolein, diolein and monoolein (mean±SD)

Result of triolein, diolein and monoolein (mean±SD)
extract by LC-ESI/MS method. The concentrations of triolein and diolein increased as the administrated dose increased. Monoolein was not detected in the feces and fur
probably because orlistat was co-administrated to prevent lipid digestion in the intestine. Portion of triolein was degraded to diolein by lipase, monoolein, however, may not have been formed or could have been absorbed to the system to be detected in the fecal matter (Table 3).
>
Quantification of excreted oils by thin layer chromatography
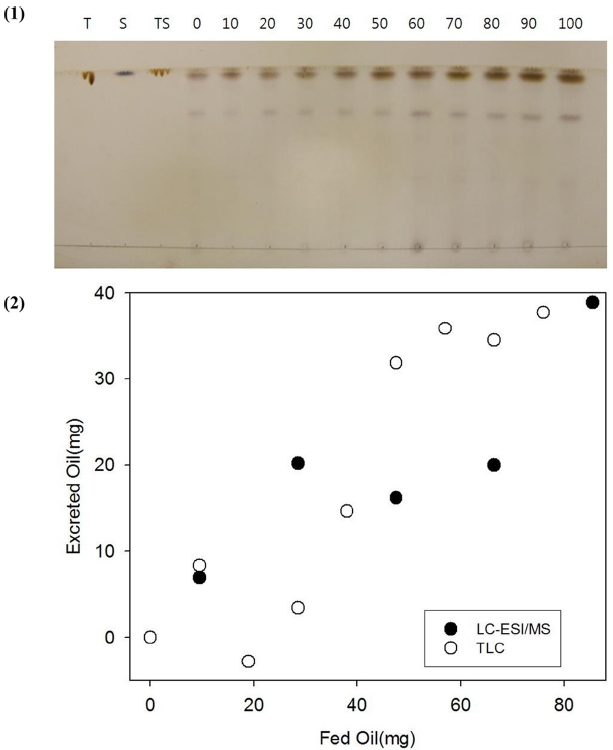
The extracts obtained from feces and fur after feeding 0 to 90 μL of triolein containing Sudan IV at 2 mg/mL were spotted on a TLC plate and developed to reveal oil spots (Figure 3). Triolein, Sudan IV and triolein/Sudan IV were used as controls. Sudan IV had red color that can be identified by naked eye. After burning the plate, Sudan IV was charred to black spots at Rf = 1. A little below the spots from Sudan IV, spots from triolein were revealed at Rf = 0.95. Diolen and other oils were spotted at Rf = 0.72. The Spots from triolein were quantified by image analysis and plotted in Figure 3 (1). The excreted oils from the mice quantified by TLC (open circles) coincide well with those quantified by LC-ESI/MS (solid circles) in Figure 3 (2).
In this paper, a LC-MS method was developed for simultaneous quantitative analysis of triacylglycerols (TGs) in mouse feces using liquid chromatography-electrospray ionization/mass spectrometry. Our sample preparation procedure was rapid, simple than traditional measurements of stool fat. Moreover, separation of TGs was optimized with well-defined peak shapes and RTs by using a less hydrophobic C8 column than C18 reverse-phase column. This method has been successfully applied to simultaneous determination of triolein, diolein and monoolein in feces from 30 mice. The concentrations of triolein and diolein increased linearly as the administrated dose increased. However, monoolein was not detected in the samples because orlistat, a lipase inhibitor, was co-administrated with triolein. This method can therefore be applied to measure TGs in mouse feces accurately and precisely by LC-ESI/MS, thereby helping to predictive biomarker in fat malabsorption such as steatorrhea, intestinal and pancreatic disease and for the diagnostic research.